

CRUDE OIL PRICE OUTLOOK:
- Both API and EIA reported unexpected build in crude inventories for the week ending April 16th
- Viral resurgence in India, Japan and other parts of the world weighed on the energy demand outlook
- The OPEC+ group is expected to maintain current production level unchanged for the next 3 months

Recommended by Margaret Yang, CFA
Get Your Free Oil Forecast
Crude oil prices extended lower during Thursday’s APAC trading session after the Energy Information Administration (EIA) reported an unexpected rise in inventories. Stockpiles increased by 0.6 million barrels for the week ending April 16th, compared to a baseline forecast of a 2.86-million-barrel drop. Prior to this, the American Petroleum Institute (API) also released a small build in crude inventory. This marked the first climb seen in four weeks, suggesting that demand is probably not as strong as people have thought (chart below).
Viral resurgence in some of the world’s major oil importing countries, such as India and Japan, dented the prospect for energy demand. A worsening pandemic situation in those countries underscored the fragility of a global recovery as uneven distribution and adoption of the Covid-19 vaccines posed a threat to reopening.
While stocks have rebounded overnight, the market remains jittery about the unwinding of “reflation trades”. Risk sentiment is tilted to the cautious side as haven-linked Treasuries were bid for a third day, sending the 10-year rate to a five-week low.
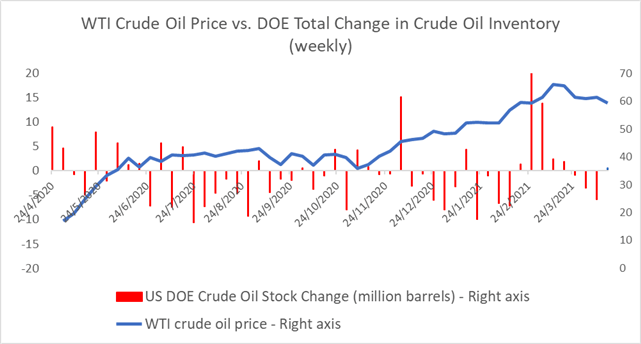
Source: Bloomberg, DailyFX
The OPEC+ will hold a Joint Ministerial Monitoring Committee (JMMC) meeting on April 28th. The oil cartel and its allies are expected to maintain the current pace of production unchanged, according to Russia’s Deputy Prime Minister Alexander Novak. “Currently, the market is balanced”, he said, adding that the OPEC+ can pump more if a deficit occurs. A balanced view of the current supply and demand relationship may help to stabilize prices.
In the previous OPEC meeting held on April 1st, the group surprised the market by introducing a total 2.25-million-barrel production hike from May to July to meet rising global demand.
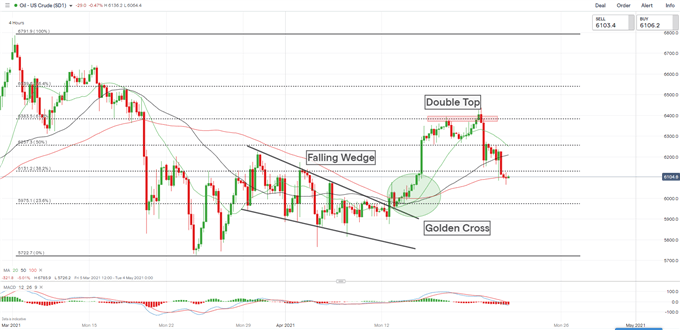
Technically, WTI appears to haveformed a “Double Top” chart pattern after hitting a strong resistance level at US$ 63.83 on the four-hour chart. A “Double Top” pattern usually occurs at the end of a bull trend and signals a trend reversal. Prices have breached below the 38.2% Fibonacci retracement (61.31) and may be looking for support at the 100-period SMA line (60.90).
The MACD indicator has formed a bearish crossover and trended lower since, suggesting that further consolidation may be underway.
WTI Crude Oil Price – 4 Hour Chart

Recommended by Margaret Yang, CFA
Building Confidence in Trading
— Written by Margaret Yang, Strategist for DailyFX.com
To contact Margaret, use the Comments section below or @margaretyjy on Twitter
Be the first to comment