

Crude Oil, WTI – Talking Points:
- Crude oil prices aim higher during Asia-Pacific trading session
- Near-term falling trendline breakout is in focus, gains to follow?
- Watch retail trader positioning, which recently flipped net-long
Technical Analysis
Crude oil prices pushed higher over the past 24 hours following steep losses since last week, extending gains during Friday’s Asia-Pacific trading session. WTI also confirmed a breakout above a near-term falling trendline from March 8th, opening the door to reversing the short-term downtrend. Prices seem to have left behind key support, which is a range between 93.51 and 95.22.
Immediate resistance appears to be a combination of the 38.2% Fibonacci retracement level at 107.23 and the 50-period Simple Moving Average (SMA). Clearing these points may further open the door to extending gains, placing the focus on the midpoint, 61.8% and 78.6% levels at 111.46, 115.70 and 121.73 respectively.
To the upside, prices may struggle to clear the 125.93 – 129.42 resistance zone, where the latter is the current 2022 high. Downtrend resumption entails a break under the 93.51 – 95.22 support zone, exposing the late February low at 90.05 before 86.74 comes into focus. Keep a close eye on RSI if prices turn lower and retest the support zone, positive divergence could signal downtrend exhaustion, hinting at a reversal.
WTI 4-Hour Chart
Chart Created Using TradingView
Oil Sentiment Analysis – Neutral
According to IG Client Sentiment (IGCS), 59% of retail traders are net long WTI crude oil. IGCS tends to behave as a contrarian indicator, meaning that prices may continue falling if downside exposure remains elevated. Still, short bets have increased by 16.13% compared to yesterday while falling 22.91% compared to a week ago. The combination of overall positioning and recent shifts in exposure offer a mixed trading bias.
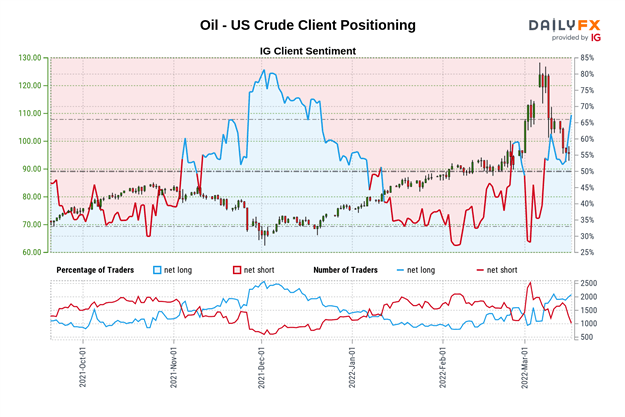
*IGCS chart used from March 17th report
–— Written by Daniel Dubrovsky, Strategist for DailyFX.com
To contact Daniel, use the comments section below or @ddubrovskyFX on Twitter
Be the first to comment