

CRUDE OIL PRICE OUTLOOK:
- Oil prices pulled back slightly during APAC trade after rising 1.3% on Tuesday
- A stronger US Dollar and elevated viral concerns appear to weigh on prices
- US crude inventories fell for 7 weeks in a row, reflecting strong demand and a tight market condition
Crude oil prices pulled back slightly during Wednesday’s APAC session amid souring sentiment, as investors mulled the ramifications of strong US core CPI data for the Fed’s monetary policy. Meanwhile, uncertainties surrounding OPEC+ production hikes and lingering viral concerns are also weighing on energy prices. Australia extended the lockdown in Sydney by another 14 days as locally transmitted Covid-19 cases remained elevated, casting a shadow over growth prospects and the demand outlook in the region.
On the bright side, the American Petroleum Institute (API) reported a 4.08-million-barrel draw in crude stockpiles for the week ending July 9th. This marks a 7th consecutive fall in America’s crude inventories, underscoring strong underlying demand for fuel as the summer driving season peaks.
According to the US Department of Energy (DoE), total commercial crude inventories have fallen to 445.5 million barrels recently. This marks the lowest level seen since February 2020 (chart below), reflecting tightened market conditions as supply continues to trail demand. It is estimated that the global supply shortfall will reach 3 million bpd by the end of this year without a meaningful output increase from the major producers such as OPEC+.
Therefore, unresolved deadlock between Saudi Arabia and the United Arab Emirates (UAE) remains a wildcard in the oil market. Traders are worried that escalated disputes may reignite a price war among OPEC+ members and sink oil prices. A resolution may lend support for prices to challenge higher levels however.
WTI vs. US Crude Oil Total Inventory – Past 12 Months
Source: Bloomberg, DailyFX
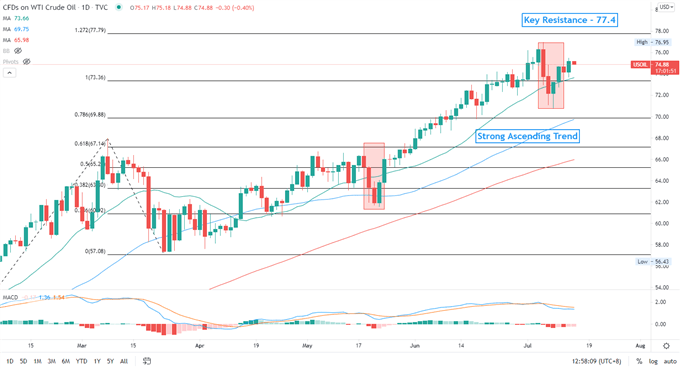
Technically, WTI entered a technical correction that resembles the one that occurred during the end of May (chart below). A healthy pullback may pave the way for prices to challenge higher highs towards $77.4 – the 127.2% Fibonacci extension. A deeper pullback may signal a bearish trend reversal.
The MACD indicator formed a bearish crossover and trended lower, suggesting that near-term momentum may be tilted to the downside.
WTI Crude Oil Price – Daily Chart
— Written by Margaret Yang, Strategist for DailyFX.com
To contact Margaret, use the Comments section below or @margaretyjy on Twitter
Be the first to comment