

Crude Oil Price Forecast:
- WTI Crude oil declined to its lowest price per barrel since 2002 on Wednesday
- Despite modest gains in other risk-sensitive assets like the Dow Jones, crude is vulnerable
- A sustained decline in volatility would be an encouraging development for the commodity’s outlook
Crude Oil Price on Pace for Worst Monthly Decline in its History
Crude oil suffered another historic decline on Wednesday, sending the commodity to its lowest level since early 2002 when it traded beneath $20 a barrel. Now, the West Texas Intermediate blend is priced at a similar level and is on pace for its worst monthly performance in its history. As it stands, the current monthly decline of -44% is significantly greater than the -33% loss in October 2008 and the -28.4% decline in January 1986 which were previously the worst two months on record.
Crude Oil Price Chart: Monthly Time Frame (January 1984 – March 2020)
Chart created in TradingView. Monthly rate of change in blue.
Despite mounting losses, there is little to suggest crude oil has bottomed with volatility trading at historical extremes amid the unprecedented fundamental headwind of coronavirus. With that in mind, the outlook for crude oil may remain bleak until the VIX, or “fear index,” recedes to more normalized levels, signaling investors are becoming more confident.
VIX Rewrites Records
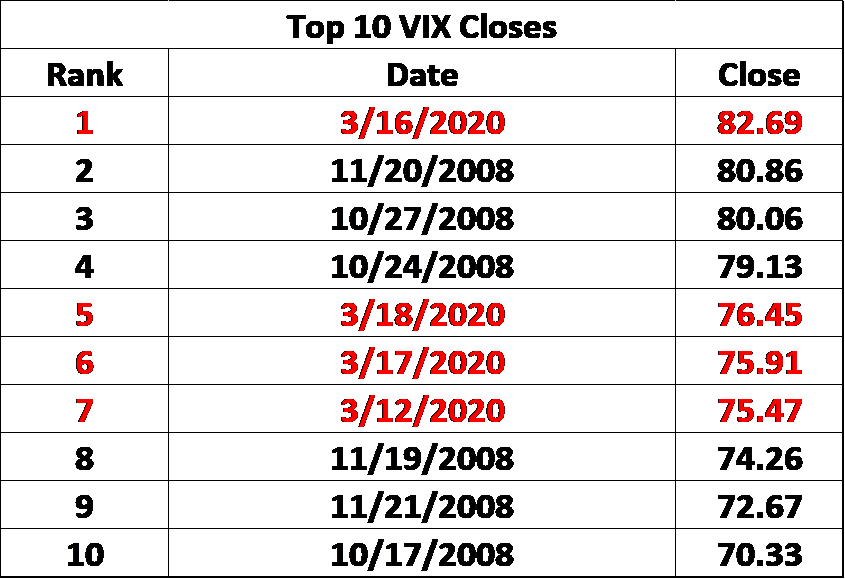
Source: Bloomberg
Until then, crude oil gains may be short-lived as the push and pull of risk trends wreak havoc on growth-sensitive assets like crude oil. Improvements in other commodities like silver and copper could also hint at a blossoming recovery, with the latter showing early signs of bullishness, but further evidence is required at this stage. Further still, the overwhelmingly bullish positioning on WTI Crude amongst IG clients could suggest further losses ahead.
| Change in | Longs | Shorts | OI |
| Daily | -7% | -11% | -8% |
| Weekly | 49% | 5% | 39% |
Therefore, subsequent support may be required at the $16.96 area which marks the commodity’s 2001 low. As risk appetite looks to recover and crude searches for a bottom, follow @PeterHanksFX on Twitter for updates and analysis.
Starts in:
Live now:
Mar 26
( 15:03 GMT )

Recommended by Peter Hanks
Trader’s Toolbox: How to Identify Price Trends with Trader Sentiment
–Written by Peter Hanks, Junior Analyst for DailyFX.com
Contact and follow Peter on Twitter @PeterHanksFX
Be the first to comment