jeffbergen/E+ via Getty Images
Investment summary
We advocate investors to keep a constant weight to quality, liquidity and resiliency in equity portfolios for FY22 and beyond. With the macro thematic dominating equity markets measures of profitability and return on capital are paramount in the budget for equity risk. In that vein, we reiterate that Cross Country Healthcare, Inc. (NASDAQ:CCRN) is a buy and note the company has delivered outsized return on its invested capital since FY20 and looks set to continue along this trajectory. A premium in valuation is justified by this and superior investor ROE measures. With the macro-backdrop supportive of further upside in health care as well, we rate CCRN a buy with a $28 price target.
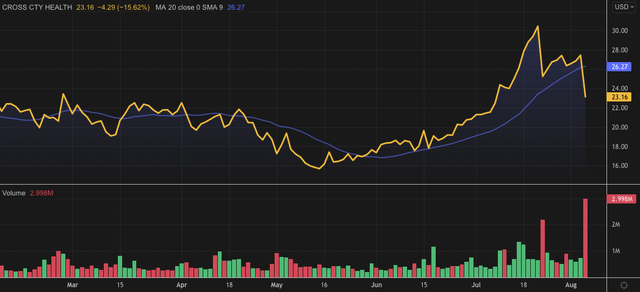
Exhibit 1. CCRN 6-month price action
Q2 earnings illustrate key differentials
Second quarter earnings came in with another strong performance with upsides at the top and bottom line versus consensus earnings estimates. Consolidated revenue was $754 million and came in more than 120% higher YoY. It did decrease by ~400bps sequentially due to normalization in its bill rates in the travel business. Gross margins lifted by 70bps YoY to 22.6%, underpinned by a more favourable bill-pay spread on the travel division, recognizing $170 million in gross profit, up 135% YoY. Management expects further margin improvements as the bill-pay spreads continue to work back to range.
Segmentally, nursing and allied health turnover was up 131% YoY and printed $731 million and representing more than 96% of quarterly revenue. It was another record quarter for the travel nurse and allied division as the company has its highest number of travellers on assignment in its history. As a result, billable travel hours grew by 300bps YoY despite a 700bps decrease to the average realized travel bill rate.
Importantly, travel bill rates are projected to continue their decrease throughout H2 FY22. However, with labour shortages and increased demand for travel assignments, management notes it’s seen a spike in travel bill rates indicating prices may have found a floor for now. Therefore, even though it projects a further decline, it notes the forecasts are skewed due to the completion of assignments that commanded higher bill rates.
CCRN Revenue Split
Data: HB Insights, CCRN SEC Filings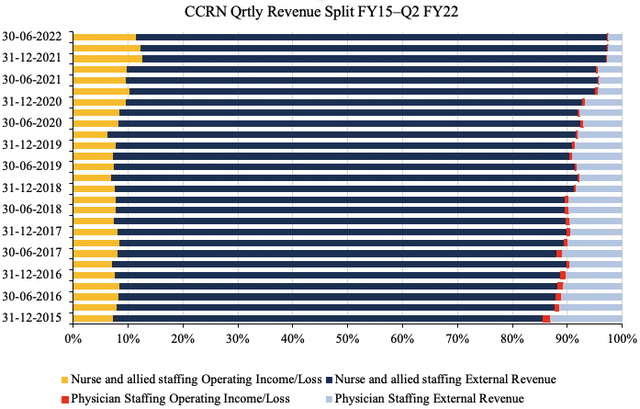
Meanwhile, its physician staffing segment grew 41% YoY to $22 million and also contracted 400bps QoQ in line with the whole business. It saw major upside here thanks to a 27% spike in the number of billable days booked across an increased number of specialties. This led to a higher average revenue per day and generated a high degree of operating leverage to feed more cash down to the bottom line.
Moving down the P&L, the company saw a 71% headwind at the SG&A line although the SG&A margin tightened by ~400bps YoY to just 11% of revenue. Furthermore, the homecare acquisition added pro forma 23% increase in revenue over the previous year, whilst the education segment also saw a 23% YoY gain but was down sequentially due to seasonality and timing of holidays. It brought this down to a net income of $52.9 million, up from just $11.5 million the year prior, printing EPS of $1.40 – well up from $0.30 a year prior.
CCRN ended the quarter with $300 million in cash on the balance sheet with $209 million in debt. This was made up of $124 million subordinated facility and another $85 million under the AB facility. It also saw DSO increase by 4 days to 66 days although average weekly collections rose more than 17%.
As seen in Exhibit 2, the asymmetry in operating metrics has begun to narrow substantially and the company has begun to grow operating income and FCF substantially off a recent low point. However, keep in mind, that a negative FCF and/or FCF yield is not only acceptable, but desirable if the return on investment is positive and higher than the company’s hurdle rate.
Exhibit 2. Asymmetry in quarterly operating metrics beginning to narrow with substantial bottom-line growth
Data: HB Insights, CCRN SEC Filings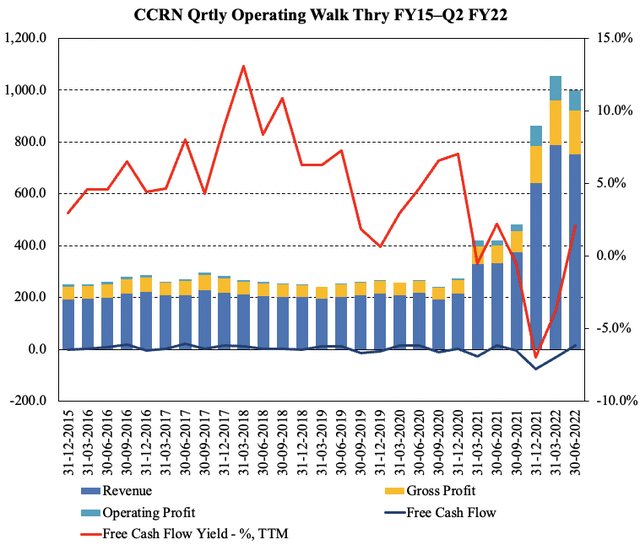
On this point, CCRN exhibits the kind of profitability and quality characteristics we are looking to keep at a constant weight across portfolios in FY22. As investors step up in quality and look to maintain resiliency in portfolios in the forward regime, a high ROIC is essential. As mentioned above, CCRN also realized a negative FCF these past few quarters, however, the downshift in FCF has been directly tied to a substantial increase in return on its invested capital, which is actually a desirable characteristic, as mentioned.
As seen in Exhibit 3, 2-year normalized quarterly ROIC is around 4.7%, and it printed a Q2 FY22 return on investment of almost 15%, well above the company WACC of 6.8%. Hence, the ROICC/WACC ratio is 2.2x and provides an excellent bedrock to generate further profitability ahead of peers. Moreover, it has averaged a quarterly NOPAT of $23.5 million since FY20.
Exhibit 3. Return on investment substantially gaining pace and it generates average 4.7% ROIC since FY20
Data: HB Insights, CCRN SEC Filings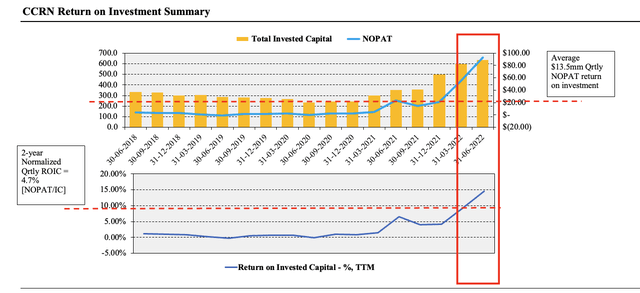
Management was in a position to provide Q3 guidance and project top-line decline of 18-20% YoY calling for $605-$615 million at the top. This is well baked in and has been anticipated for some time as a result of the reduction in average travel bill rates, plus seasonality in its education business model. It forecasts gross margin of ~22.3-22.8% and looks to decompress margins further as the bill-pay spread and bill pay rates begin to normalize in the back end of FY22. It hopes to carry this down to non-GAAP EBITDA of $60 million at the upper end and EPS of $0.95 at the higher range.
Valuation
Shares are trading at a substantial discount to peers across key multiples in the GICS Industry peer group. CCRN is priced at 8.6x trailing earnings and 6x forward P/E, suggesting the market is expecting a below-peer result from the company. We are contrarian to this view. Moreover, shares trade at a deep discount to book value both top and bottom line multiples to peers. We are paying 6.6x trailing earnings and 6x forward earnings to access superb profitability, a company that’s in a defensible industry and as growing gross margins into a weakening economic outlook.
Exhibit 4. Multiples and comps
Data: HB Insights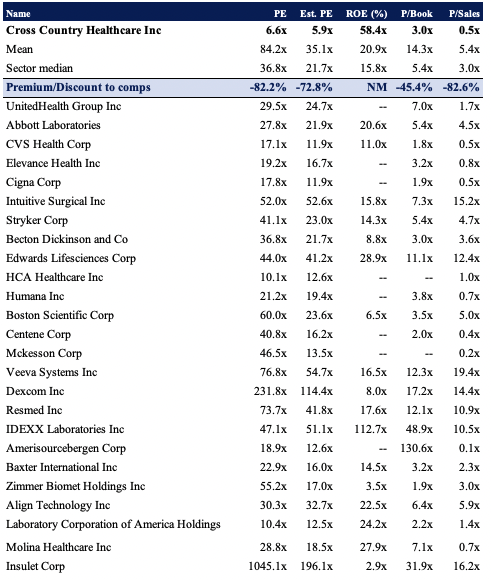
At 3x enterprise value (“EV”) to book value, we would theoretically be paying $33 for the stock a 43% premium to the current market price. The question then becomes, is an investor willing to pay a 43% premium to corporate value in order to access the equity premia listed above?
One factor to help guide the decision is that CCRN exhibited a 66% ROE from its Q2 TTM earnings. However, that’s CCRN’s return, we would be paying 3x that equity value. Even still, our ROE as investors is still 25%, giving an equity duration of just 2.9 years, as seen in Exhibit 5. and therefore we find the economics of CCRN’s valuation quite attractive. At 6x FY22 EPS estimates of $4.65 sets a price objective of $28 or ~21% upside potential to that valuation.
Exhibit 5. Valuations are supportive when factoring in investor return metrics, and a 43% premium can perhaps be justified
Data: HB Insights Estimates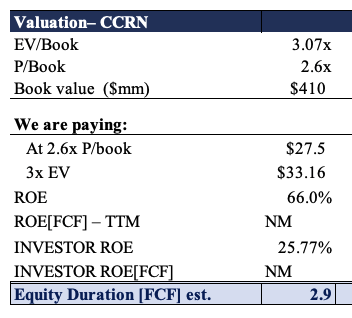
In short
We reiterate CCRN as a buy following its Q2 earnings. A strong period of growth across all segments plus acknowledgement of impeding headwinds gives more confidence on an estimate of value for the stock. In particular ROIC and profitability metrics continue to measure up and offer upside capture looking ahead. We advocate investors keep a constant weight to ‘quality’ features such as this in portfolios for FY22 and CCRN fits the bill here, by estimate. Valuations are also supported by the ROIC and investor ROE metrics that show a potential equity duration of 2.9 years from earnings. We look forward to further coverage.


Be the first to comment