


Phiromya Intawongpan/E+ via Getty Images
A Quick Take On Courtside Group
Courtside Group (PODC) has filed to raise an undetermined amount in a direct listing of its common stock, according to an S-1 registration statement.
The firm provides a podcasting platform for audio and video content to listeners and watchers worldwide.
PODC’s revenue growth is rapidly decelerating, a major concern for a company preparing to list its shares.
So, I’m on Hold for PODC’s direct listing.
Courtside Overview
Beverly Hills, Calif.,-based Courtside Group was founded as a subsidiary of LiveOne to create podcasts and vodcasts (video podcasts) and related content for distribution on its own website and major distribution platforms.
Management is headed by co-founder and president Kit Gray, who has been with the firm since its inception in 2012 and previously worked at Katz Media Group.
The company’s primary offerings include:
-
Podcasts
-
Vodcasts
-
Merchandise
-
Live Events
-
LaunchPadOne
The firm’s platform covers major interest verticals including entertainment, sports, business, society and culture, true crime, self-help and so on.
The system also includes LaunchPadOne, a self-publishing podcast platform for independent podcasters.
PODC generates revenue primarily from advertising, segment sponsorships and programmatic monetization channels.
As of September 30, 2022, Courtside has booked fair market value investment of $18.8 million in equity and $4.3 million in a bridge loan from investors including LiveOne, Inc.
Courtside – User Acquisition
The firm advertises its platform and content online, with over 14 million monthly unique listeners and more than 60 million IAB monthly downloads.
The company’s LaunchPadOne, aimed at independent podcasters, also serves as a “talent pool” for the firm’s funnel of new podcasters to grow and feature.
Sales and marketing expenses as a percentage of total revenue have remained within a narrow range as revenues have increased, as the figures below indicate:
|
Sales and Marketing |
Expenses vs. Revenue |
|
Period |
Percentage |
|
Six Mos. Ended September 30, 2022 |
16.4% |
|
FYE March 31, 2022 |
15.9% |
|
FYE March 31, 2021 |
16.7% |
(Source – SEC)
The Sales and Marketing efficiency multiple, defined as how many dollars of additional new revenue are generated by each dollar of Sales and Marketing spend, dropped to 0.4x in the most recent reporting period, as shown in the table below:
|
Sales and Marketing |
Efficiency Rate |
|
Period |
Multiple |
|
Six Mos. Ended September 30, 2022 |
0.4 |
|
FYE March 31, 2022 |
1.7 |
(Source – SEC)
Management did not provide any user retention metrics.
Courtside’s Market and Competition
According to a 2021 market research report by Grand View Research, the global market for podcasting was an estimated $11.5 billion in 2020 and is forecast to reach $100 billion by 2028.
This represents a forecast CAGR of 31.1% from 2021 to 2028.
The main drivers for this expected growth are improved smartphone and mobile device access and connectivity as well as the desire by consumers for time-shifting their listening interests.
Also, the chart below shows the historical and projected future U.S. podcast market trajectory by genre:
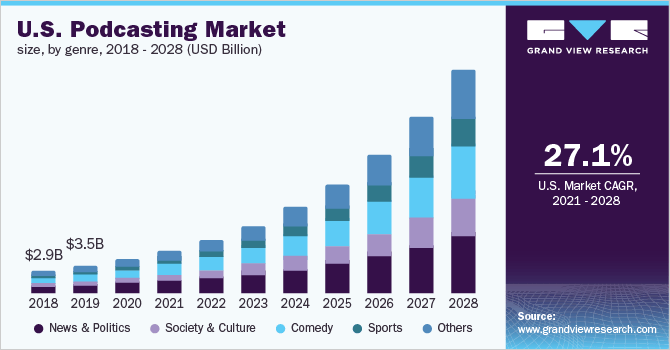
U.S. Podcasting Market (Grand View Research)
Major competitive or other industry participants include:
-
Amazon.com
-
Apple
-
iHeartMedia
-
Megaphone LLC
-
Pandora Media, LLC
-
Audacy
-
Soundcloud Limited
-
Spotify AB
-
Stitcher
-
TuneIn
Courtside Group Financial Performance
The company’s recent financial results can be summarized as follows:
-
Decelerating topline revenue growth rate
-
Increasing gross profit but variable gross margin
-
Reduced operating loss
-
Increased cash used in operations
Below are relevant financial results derived from the firm’s registration statement:
|
Total Revenue |
||
|
Period |
Total Revenue |
% Variance vs. Prior |
|
Six Mos. Ended September 30, 2022 |
$ 17,213,000 |
7.3% |
|
FYE March 31, 2022 |
$ 32,348,000 |
35.7% |
|
FYE March 31, 2021 |
$ 23,840,000 |
|
|
Gross Profit (Loss) |
||
|
Period |
Gross Profit (Loss) |
% Variance vs. Prior |
|
Six Mos. Ended September 30, 2022 |
$ 4,304,000 |
72.8% |
|
FYE March 31, 2022 |
$ 6,077,000 |
9.3% |
|
FYE March 31, 2021 |
$ 5,561,000 |
|
|
Gross Margin |
||
|
Period |
Gross Margin |
|
|
Six Mos. Ended September 30, 2022 |
25.00% |
|
|
FYE March 31, 2022 |
18.79% |
|
|
FYE March 31, 2021 |
23.33% |
|
|
Operating Profit (Loss) |
||
|
Period |
Operating Profit (Loss) |
Operating Margin |
|
Six Mos. Ended September 30, 2022 |
$ (283,000) |
-1.6% |
|
FYE March 31, 2022 |
$ (4,702,000) |
-14.5% |
|
FYE March 31, 2021 |
$ (3,236,000) |
-13.6% |
|
Net Income (Loss) |
||
|
Period |
Net Income (Loss) |
Net Margin |
|
Six Mos. Ended September 30, 2022 |
$ 1,219,000 |
7.1% |
|
FYE March 31, 2022 |
$ (4,146,000) |
-24.1% |
|
FYE March 31, 2021 |
$ (4,587,000) |
-26.6% |
|
Cash Flow From Operations |
||
|
Period |
Cash Flow From Operations |
|
|
Six Mos. Ended September 30, 2022 |
$ (3,816,000) |
|
|
FYE March 31, 2022 |
$ (1,988,000) |
|
|
FYE March 31, 2021 |
$ (150,000) |
|
(Source – SEC)
As of September 30, 2022, Courtside had $4.1 million in cash and $18.1 million in total liabilities.
Free cash flow during the twelve months ended September 30, 2022, was negative ($4 million).
Courtside Group Direct Listing Details
Courtside has registered 6.2 million shares of common stock for possible sale by selling shareholders in a direct listing.
The float to outstanding shares ratio (excluding underwriter over-allotments) will be approximately 26.8%. A figure under 10% is generally considered a “low float” stock which can be subject to significant price volatility.
The firm will not receive any proceeds from the sale of selling stockholder shares.
Management’s presentation of the company’s financials and history is not available.
Regarding outstanding legal proceedings, management said its parent company is subject to various lawsuits and did not characterize the firm’s potential liability, if any.
The designated financial advisor to the direct listing is Joseph Gunnar & Co.
Valuation Metrics For Courtside
Below is a table of relevant capitalization and valuation figures for the company, assuming a reference price of $6.50 per share:
|
Measure [TTM] |
Amount |
|
Market Capitalization Assumption |
$149,952,816 |
|
Enterprise Value |
$145,823,816 |
|
Price / Sales |
4.47 |
|
EV / Revenue |
4.35 |
|
EV / EBITDA |
-59.52 |
|
Earnings Per Share |
-$0.02 |
|
Operating Margin |
-7.31% |
|
Net Margin |
-1.23% |
|
Float To Outstanding Shares Ratio |
26.80% |
|
Assumed Listing Price per Share |
$6.50 |
|
Net Free Cash Flow |
-$4,017,000 |
|
Free Cash Flow Yield Per Share |
-2.68% |
|
CapEx Ratio |
-16.47 |
|
Revenue Growth Rate |
7.35% |
(Source – SEC)
Commentary About Courtside’s Direct Listing
PODC is seeking a direct listing as part of a spin-out from parent firm LiveOne.
LiveOne will still be a controlling shareholder of PODC after the listing.
The company’s financials have shown a slowing topline revenue growth rate, rising gross profit but fluctuating gross margin, and lowered operating loss but higher cash used in operations.
Free cash flow for the twelve months ended September 30, 2022, was negative ($4 million).
Sales and Marketing expenses as a percentage of total revenue have varied within a tight range as revenue has increased; its Sales and Marketing efficiency multiple dropped to 0.4x in the most recent reporting period.
The firm currently plans to pay no dividends “for the foreseeable future.”
PODC’s trailing twelve-month capex ratio was negative (16.47), which indicates it has spent lightly on capital expenditures even as operating cash flow was negative.
The market opportunity for podcasting services is large and expected to grow substantially in the coming years, so the firm enjoys strong industry growth dynamics in its favor.
Joseph Gunnar & Co. is the designated financial advisor on the direct listing.
Risks to the company’s outlook as a public company include its reliance on advertising as its primary revenue source, which is common for western podcasting companies in comparison to a subscription-based system in China.
The sharp drop in revenue growth in its most recent reporting period suggests that its advertising focus may be feeling the negative effects of a slowdown.
It’s difficult to get excited about a company whose growth is sharply decelerating into a direct listing.
Therefore, I’m on Hold for the PODC direct listing.
Expected Direct Listing Date: To be announced.
Be the first to comment