

Scott Olson
Introduction
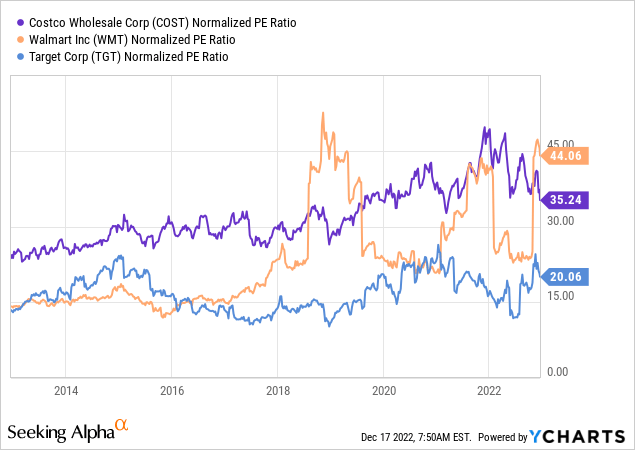
This will be my initial article on Costco Wholesale (NASDAQ:COST) and I plan to cover it regularly in the future. I first took a look at Costco around 3 years ago, in the middle of 2019. Back then, I wondered why the valuation was so high in comparison to peers and why anyone in their right mind would pay 35-40 times earnings for a retailer. The chart below shows the normalized TTM PE Ratio of Costco and peers Walmart (WMT) and Target (TGT). Note that the spikes for Walmart are a result of GAAP earnings not taking into account Non-GAAP adjustments like the $3.325 billion charge in the recent quarter for the Opioid legal charges.
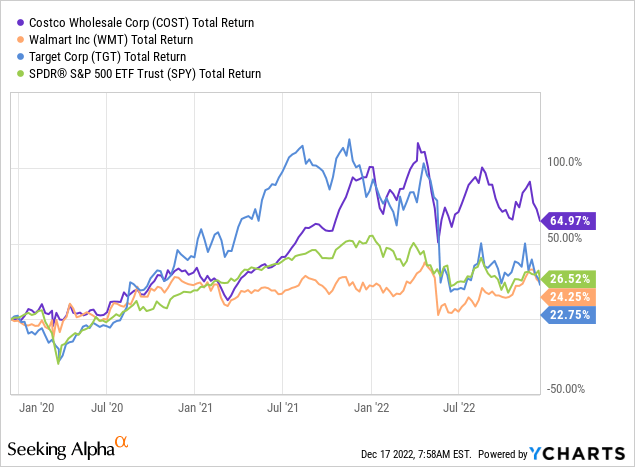
Because of the high valuation, I didn’t bother digging any further into Costco. In hindsight, this might have been a mistake, since Costco outperformed its peers and the broader market in this three-year period, as can be seen in the chart below.
I decided to take another look at Costco, this time more in depth. I want to share my thoughts in this article.
Business model and peer comparison
To start off, I want to give a quick overview of Costco’s operations. Costco operates membership warehouses in the US, Canada, Puerto Rico, Mexico, Japan, UK, Korea, Taiwan, Australia, Spain, France, China and Iceland. As we can see, Costco’s business is quite international, with operations in many countries all over the world. Since 582 out of the 845 warehouses worldwide are located in the US (see slide 13 of the linked presentation), the US is still by far Costco’s largest market.
In the last 10-K, Costco describes its business with the following words, which will be important later in this article:
We operate membership warehouses and e-commerce websites based on the concept that offering our members low prices on a limited selection of nationally-branded and private-label products in a wide range of categories will produce high sales volumes and rapid inventory turnover. When combined with the operating efficiencies achieved by volume purchasing, efficient distribution and reduced handling of merchandise in no-frills, self-service warehouse facilities, these volumes and turnover enable us to operate profitably at significantly lower gross margins (net sales less merchandise costs) than most other retailers. We often sell inventory before we are required to pay for it, even while taking advantage of early payment discounts.
Costco 10-K – Part I, Item 1
The important points here are that Costco can operate profitably at significantly lower gross margins, and the whole last sentence: Costco often sells inventory before they need to pay for it. I will come back to both of these statements later in this article.
Regarding the membership model, Costco divides memberships in Gold Star and Business memberships (for reporting purposes). The snippet from the latest 10-K below shows the number of memberships from 2020 to 2022.
Memberships FY2020-2022 (Costco 10-K)
Business memberships are priced at $60. Gold Star memberships are available to individuals and are divided into Gold Star and Executive memberships. According to Costco, the current number of Executive memberships is 29.1 million so that there have to be 24.9 million Gold Star memberships. The Gold Star membership is also priced at $60, while the Executive membership is priced at $120. To make up for the higher price, the Executive membership gives the holder a 2% annual reward (calculated of pre-tax purchases). I will come back to this later in this article.
Peer comparison – Gross margins
A problem in comparing Costco to its peers is that the membership model is so different from the standard retailing model of Walmart (WMT) and Target (TGT). To make numbers comparable, I adjusted Costco’s numbers to factor out the “membership model effects” as good as possible. These effects are twofold:
(a) According to the 10-K, the 2% annual reward for Executive memberships is accounted for as a reduction in sales. This number has to be added back to sales.
(b) The membership fees are included in total revenues, so they have to be excluded.
Applying the above to the gross margin calculation leaves me with the following numbers (in $ million):
| FY | 2016 | 2017 | 2018 | 2019 | 2020 | 2021 | 2022 |
| Reported revenue | 118,719 | 129,025 | 141,576 | 152,703 | 166,761 | 195,929 | 226,954 |
| (a) Add: 2% Rewards | 1,172 | 1,281 | 1,394 | 1,537 | 1,707 | 2,047 | 2,307 |
| (b) Less: Membership fees | -2,646 | -2,853 | -3,142 | -3,352 | -3,541 | -3,877 | -4,224 |
| Less: Merchandise costs | -102,901 | -111,882 | -123,152 | -132,886 | -144,939 | -170,684 | -199,382 |
| = Adjusted gross profit | 14,344 | 15,571 | 16,676 | 18,002 | 19,988 | 23,415 | 25,655 |
Calculating the adjusted gross margin for Costco and comparing it to the peers resulted in the following chart:
Gross margin comparison FY2016-2022 (Author – Numbers from company reports)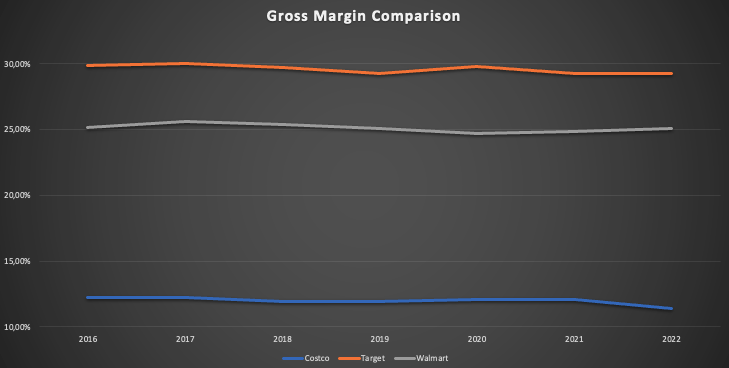
Costco’s adjusted gross margin hovered around 12%, far below the margins of Walmart (25%) and Target (30%). Now of course this is before membership fee revenues, but even when accounting for these while keeping the 2% annual rewards as a reduction of sales, the gross profit would “only” be around $2 billion higher, resulting in the gross margin being around 10% higher for a gross margin of around 13-14% which is not that important in light of the gap to the margins of peers.
Remember how Costco described its own business earlier? They can operate profitably at significantly lower gross margins. Lower gross margins can only come from higher costs of sales or lower prices. I highly doubt that Costco has such higher costs of sales compared to their peers, so I conclude that the reason for the lower gross margins is simply lower prices.
Peer comparison – Net margins
As a second metric, I want to take a look at the net margins. I adjusted Costco’s numbers again to factor out the “membership model effects”. As taxes come into play here, I started my adjustments from the reported net income. I added back the 2% annual rewards (a) and excluded the membership fee revenues (b), just like earlier. Additionally, I took into account the tax effects while assuming a 25% tax-rate (c). Here are the numbers (in $ million):
| FY | 2016 | 2017 | 2018 | 2019 | 2020 | 2021 | 2022 |
| Reported Net Income | 2,350 | 2,679 | 3,134 | 3,659 | 4,002 | 5,007 | 5,844 |
| (a) Add: 2% Rewards | 1,172 | 1,281 | 1,394 | 1,537 | 1,707 | 2,047 | 2,307 |
| (b) Less: Membership fees | -2,646 | -2,853 | -3,142 | -3,352 | -3,541 | -3,877 | -4,224 |
| (c) Add: Tax effect | 369 | 393 | 437 | 454 | 459 | 458 | 479 |
| = Adjusted Net Income | 1,245 | 1,500 | 1,823 | 2,298 | 2,627 | 3,635 | 4,406 |
And here is the comparison to the peers:
Net margin comparison FY2016-2022 (Author – Numbers from company reports))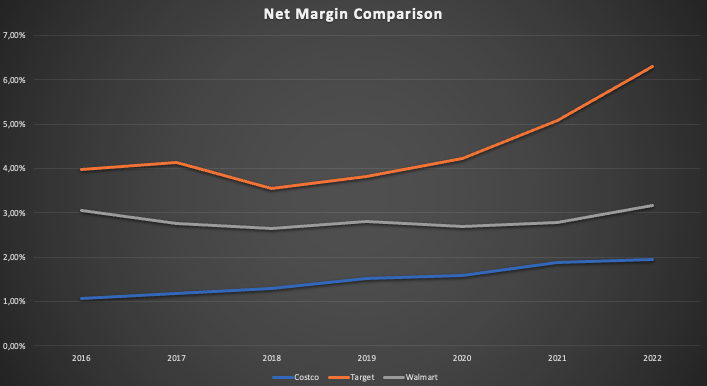
Again, Costco operates with much thinner margins than peers. This is in line with what Costco CEO Craig Jelinek has been preaching in this interview with Yahoo Finance (2:48 to 2:53):
We are a top-line company. We drive sales. We are not a margin company.
This is the essence of the Costco business model.
I need to add that the numbers above are for the last ended fiscal years, so for Target and Walmart the 2022 numbers are for the year ended January 2022. For Costco, the 2022 number is for the year ended August 2022. The TTM net margins for Target and Walmart are 3.2% and 2.8% respectively.
By this point, you might wonder: “Why is he only proving that Costco’s margins are so much lower than their peers? And even on a non membership model basis?”
This leads me to the conclusion regarding this first part of the peer group comparison.
Back of the napkin calculation
What I want to show is the value proposition Costco offers to its members. To show this, I need the above numbers. I will make a comparison of the actual economic costs for consumers shopping at Costco or Walmart, purely based on the reported numbers.
Costco’s FY22 sales excluding membership fees were $222,730 million. According to the latest 10-K, the sales penetration of Executive memberships was 71%, so that sales to Executive members amounted to $158,138 million. Adding back the 2% annual rewards of $2,307 million results in actual sales to Executive members of $160,445 million. With 29.1 million Executive memberships as of the latest 10-K, Executive members spent an average per membership of $5,514 at Costco in FY2022.
The 3-year average net margins (excluding membership model effects) from Costco and Walmart, taken from the numbers above, were 1.81% and 2.88% respectively. Dividing the reported number of 2% annual rewards of Costco Executive members by the sales to them ($2,307/$160,445) results in an actual annual reward of 1.44%. The reward is lower than 2% because it is calculated on a pre-tax basis and there are some items that are excluded from the reward system.
Now here is the comparison for the actual cost (defined as expenses of the consumer that are actually a profit to the selling company) of Executive members of Costco compared to consumers shopping at Walmart, assuming $5,514 spent in the year (numbers in $):
| Costco | Walmart | |
| Purchases | 5,514 | 5,514 |
| x Net Margin 3-Y average | 1.81% | 2.88% |
| = Company net profit before annual reward | 100 | 159 |
| Less: 1.44% Annual Reward on purchases | -80 | 0 |
| = actual company profit | 20 | 159 |
| Add: Membership fee cost | 120 | 0 |
| = Total cost to consumer | 140 | 159 |
This is before factoring in that because of the lower gross margins, prices at Costco are very likely lower to begin with. Now I don’t say that Costco generally has better prices than Walmart just because of the lower gross margins. Prices fluctuate from region to region, country to country and so on. What I am saying is that all things considered, purely based on reported numbers, it is very likely that overall prices at Costco are lower than prices at Walmart, ultimately benefitting the consumer.
Since the membership is a fix cost and the annual reward is only capped at $1,000 per year, higher spending households are benefitting even more from the Costco model. This is also good for Costco because with this model they are the best choice for higher spending/income households that are not hit as hard as lower income households in economic harder times, making Costco much more resilient to economic downturns.
Another benefit of Costco is that they sell items in bulk. According to this article, the average Costco shopper does about 23 trips per year, only visiting Costco every 2 or 3 weeks. The result is basically a save of time because buying in bulk allows shoppers to stack up on the goods they need, a benefit beside monetary benefits that should not be underestimated.
Using the same approach for non-executive members results in a different picture. According to my numbers, the average non-executive member only spent $1,760 at Costco in FY2022. The membership fee is only $60 and there is no 2% annual reward, so the average non-executive member most likely doesn’t benefit from the Costco model versus shopping at Walmart.
This shows again that the Costco model is made for and focuses on high spending/income households. Regarding the focus on different consumers, I read a comment on Seeking Alpha sometime this year. I think it was in one of the news releases regarding the plummeting margins of retailers. The comment assessed the situation perfectly in my opinion. It basically said: “Walmart focuses on lower income, Costco on higher income customers. Target focuses on something in between. The current price increases are pushing these “in between” customers to the lower end, a disaster for Target”. Looking at the recently reported numbers for Target, this might be true.
A union for consumers
To end this first part of the peer group comparison, I want to explain a little bit why I choose “A union for consumers” as the title for this article. So, a union is normally a group of people (employees) who join together to advance common interests. Here in Germany, unions are just a part of the system and there are many unions with many members. The unions members pay a fix fee every year, and the union uses the voices of all members to bargain wage increases and other benefits.
Now all of this also holds true for Costco’s membership model and describes it in the best way possible in my opinion. The members pay a fix fee every year, and Costco uses the number of members to bargain the best prices possible while keeping costs (low gross margin) low. Because of the warehouse model, Costco also keeps operating costs low, something I will show in the second part of the peer group comparison. In this way, Costco is giving all benefits it can achieve through its scale back to the consumer. A win for both sides.
Peer comparison – stores / retail square feet
For the second part of the peer group comparison, I want to focus on footprint growth and operating efficiency.
To start with, here is a table showing the retail store count for the three retailers for FY15 to FY21 and the last reported number according to the 10-K/10-Q filings:
| FY | 15 | 16 | 17 | 18 | 19 | 20 | 21 | Last report |
| Costco | 686 | 715 | 741 | 762 | 782 | 795 | 815 | 838 |
| Walmart | 11,528 | 11,695 | 11,718 | 11,361 | 11,501 | 11,443 | 10,593 | 10,586 |
| Target | 1,792 | 1,802 | 1,822 | 1,844 | 1,868 | 1,897 | 1,926 | 1,941 |
Costco and Target grew their store count every single year for a CAGR of 2.91% and 1.21% respectively, while Walmart’s store count declined in the past few years.
The next table shows the retail square feet (in millions) for the same timeframe:
| FY | 15 | 16 | 17 | 18 | 19 | 20 | 21 | Last report |
| Costco | 98.7 | 103.2 | 107.3 | 110.7 | 113.9 | 116.1 | 118.9 | 122.5 |
| Walmart | 1,149 | 1,164 | 1,158 | 1,129 | 1,129 | 1,121 | 1,060 | 1,056 |
| Target | 239.5 | 239.5 | 239.4 | 239.6 | 240.5 | 241.6 | 243.3 | 244.0 |
Again, Costco and Target grew their retail square feet with a CAGR of 3.15% and 0.26% respectively, while Walmart’s retail square feet declined.
The key takeaway here is that Costco was able to find space to grow organically (excluding same store sales growth) where Target and Walmart were not.
Here are two more impressive charts I ended up with:
Revenue per store FY16-FY22 (Company 10-K reports) Revenue per square feet FY16-FY22 (Company 10-K reports)
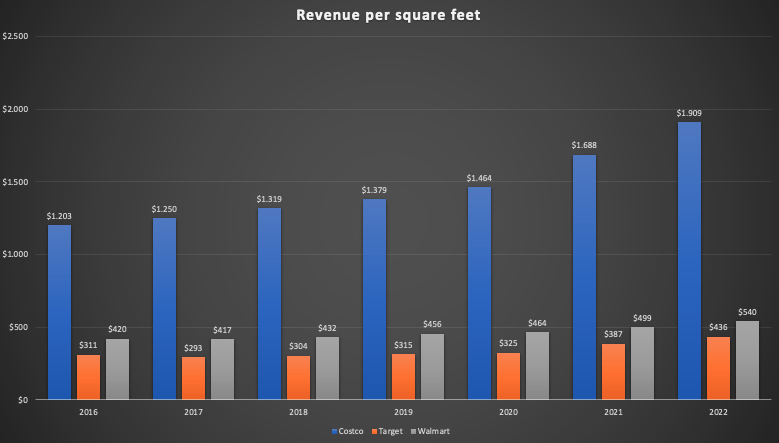
Because of the warehouse model, Costco generates 3 to 4 times the revenue per square feet and 4 to 5 times the revenue per store compared to peers. Adding to that, the gap has even widened over the past few years.
Since the costs of running the stores are fix costs, this leads me to the topic of operating efficiency. The following chart shows the percentage of operational expenditures (OpEx) divided by revenue:
OPEX/revenue FY16-FY22 (Numbers from company 10-K reports)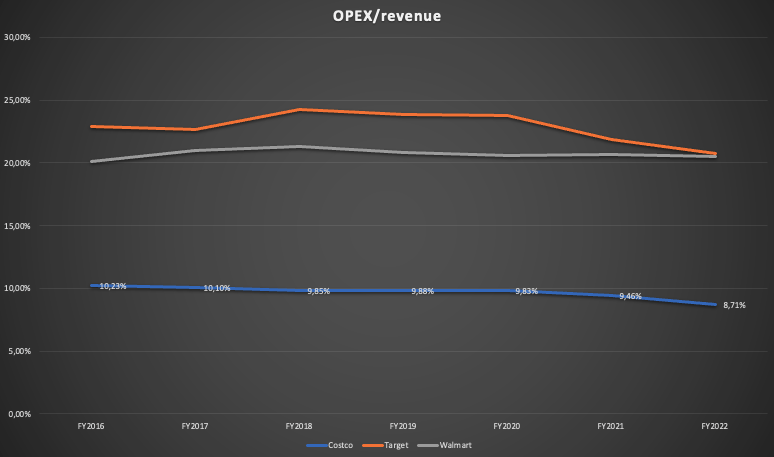
The amount of OpEx Costco has to spend for $1 of revenue is just below 10 cents, more than half of what Walmart and Target have to spend, which makes absolutely sense since they need just a fraction of the retail space for that same $1 of revenue. This also helps to explain why Costco can “operate profitable at much lower gross margins” (remember the business description from the 10-K I highlighted earlier) through lower prices. Since Costco can keep OpEx this low, they have more room to lower prices, taking the “hit” of lower gross margins (remember the CEO’s quote that Costco is not a margin company). This is something that Costco CEO Craig Jelinek also mentioned in this interview (08:40 to 08:54) nearly three years ago:
Really what we need to do is worry about what we can do well. Figure out how to lower prices, lower our expenses. The lower the expenses that we have, the more efficient we become, the more we can lower prices.
To conclude the peer group comparison:
1. Costco has been the only retailer to actually grow its footprint (stores, retail square feet) meaningfully over the past few years.
2. They are much more efficient regarding OpEx, allowing them to offer lower prices through lower gross margins.
3. The customers who benefit the most from the Costco model are higher spending/income households. This makes Costco more resilient in times of an economic downturn.
Growth prospects
For this section, I want to focus on the expansion of Costco’s operations outside of North America.
I will start with two charts:
Number of stores (Costco 10-K reports) International stores as % of total stores (Costco 10-K reports)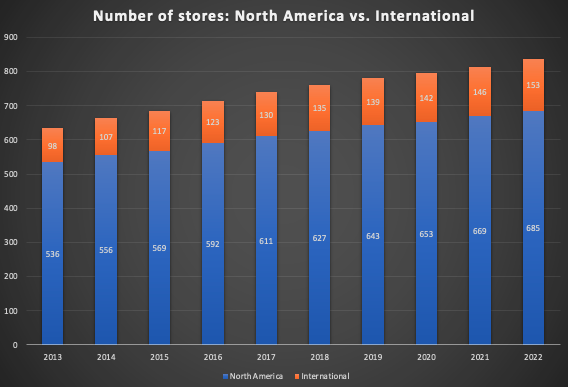
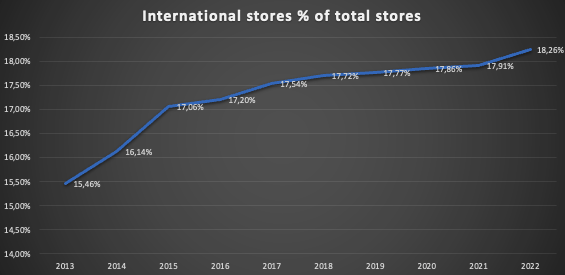
Over the past decade, Costco expanded the international operations at a faster pace than the operations in North America (US+Canada). The percentage of international stores rose from 15.46% in FY2013 to 18.26% in FY2022. It is a slow, but steady process. The important takeaway from this is that the Costco model seems to work all around the world. For example, this report on what Costco has been doing right to succeed in China (where others before them failed) gives some insight on how Costco approaches new markets before opening their first offline stores. Besides that, there are tons of videos on YouTube where people are doing shopping videos from Costco stores all around the world. Unsurprisingly, you can’t really tell the difference between Costco Japan, Costco Korea or Costco Australia. Costco doesn’t need to change anything. They just offer good prices/service, and customers sign up for a membership and become loyal Costco members. I have no doubt that Costco has a long way to grow internationally, either by entering new markets/countries or expanding in already served markets/countries. For Example, they only have two stores in China right now, with two more to come in the near future.
What surprised me is the fact that not only did Costco grew at a faster pace internationally, but international stores are also more profitable than stores in North America, as can be seen in the chart below.
EBIT-Margin: International vs. North America (Costco 10-K reports)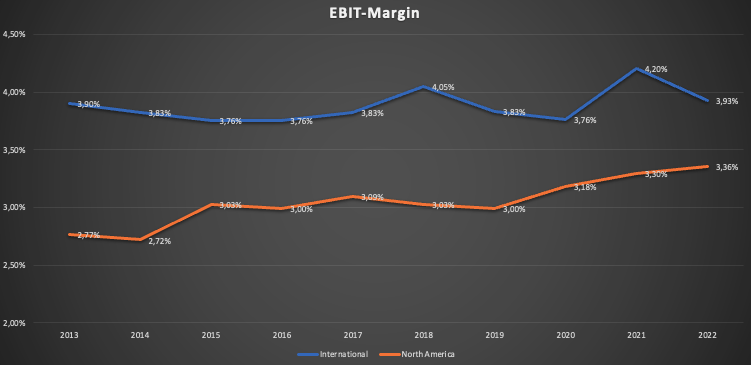
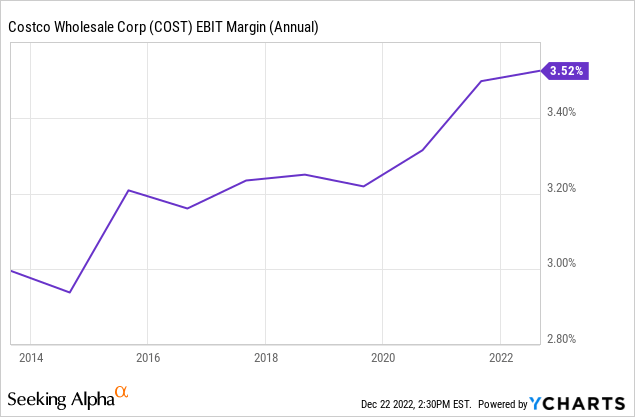
This fits into the picture when we take a look at Costco’s consolidated EBIT margin over the past decade (see chart below). The margins in the North America region (which makes up around 85% of operations) expanded by around 60bps, while the margin in the International region kept steady. On a consolidated basis, Costco’s EBIT margin expanded by around 50bps (85% of 60bps).
After discovering that international stores are more profitable than their counterparts in North America, I wondered how this is possible. So, what are the factors that decide how profitable a Costco store can be?
The store needs to be located in an area that is populated as dense as possible because the profitability of a Costco store is mainly derived from the number of memberships for that store. Here are two pictures showing where Costco’s stores are located in Japan and Korea:
Costco Japan locations (Google Maps) Costco Korea locations (Google Maps)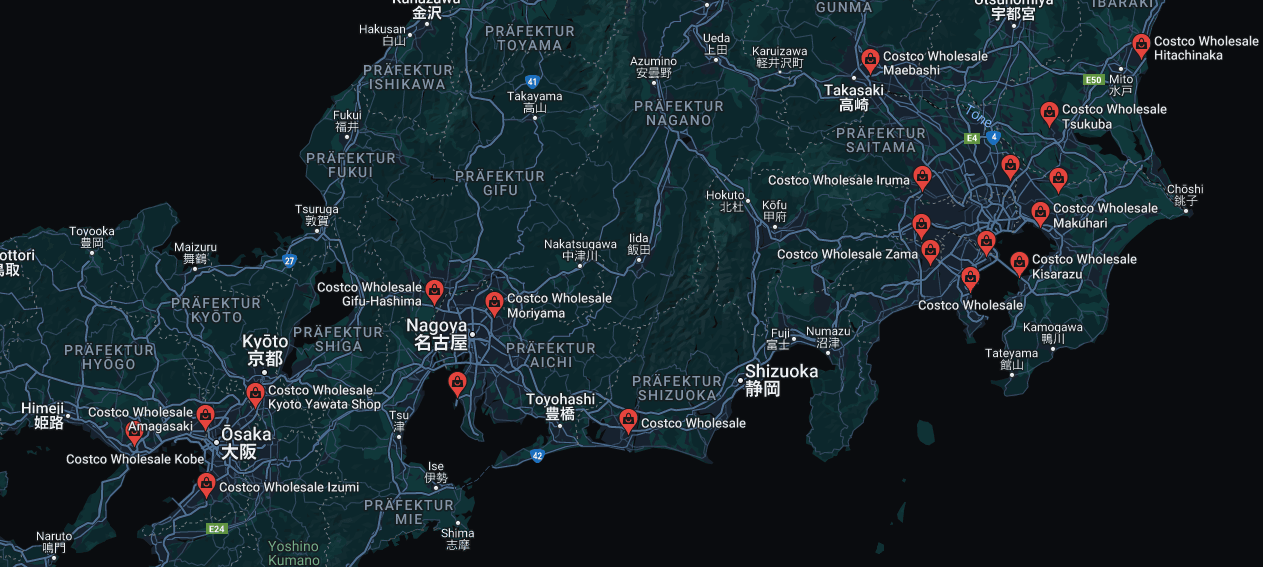
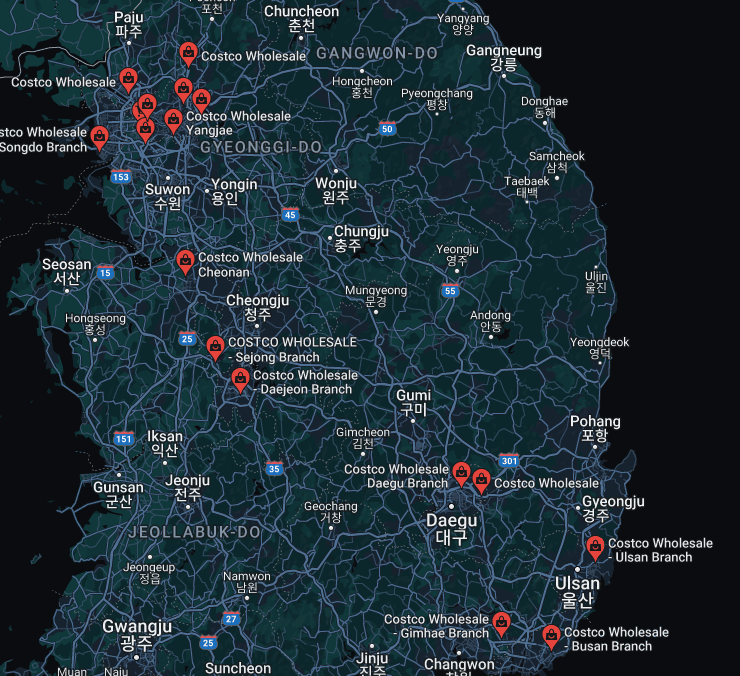
All the stores are located in dense populated areas, most noteworthy around Seoul (9.7 million inhabitants; 9 stores) and the greater Tokyo area (14.3 million inhabitants; 9 stores). For reference, New York City got 8.9 million inhabitants. For the international operations, Costco can just choose the best suited locations with the densest population to assure that each store reaches as many new potential members as possible, becoming more profitably for itself in the process. They can’t do the same in North America, simply because they already cover most areas with dense populations.
Now think about how profitable Costco stores in the major cities in China could be. There are six major cities with populations of more than 12 million inhabitants, and Costco already proved that their model also works in China. While tensions and geopolitical interests might be an argument that could be made regarding risks for the operations in China, I think Costco won’t be greatly impacted by this, simply because they are just a retailer and don’t pose any threat to the Chinese government.
Financials
Balance sheet
Costco has a history of running a net cash position on its balance sheet, as can be seen in the table below:
Costco net debt FY13-FY22 (Seeking Alpha – Financials)
Except for the fiscal years 2016 and 2017, with net debt of $432 million and $880 million respectively, Costco had a net cash position at the end of every fiscal year over the last decade.
Additionally, Costco has only a very little amount of Goodwill on the balance sheet:
Costco Goodwill FY13-FY22 (Seeking Alpha – Financials)
To conclude, Costco’s financial position is very stable.
Income statement
I want to start the overview of the earnings development with a table showing the most important growth metrics over the past few years (in $ million except EPS):
| FY | 2016 | 2017 | 2018 | 2019 | 2020 | 2021 | 2022 | CAGR |
| Revenue | 118,719 | 129,025 | 141,576 | 152,703 | 166,761 | 195,929 | 226,954 | 11.40% |
| EBIT | 3,672 | 4,111 | 4,480 | 4,737 | 5,435 | 6,708 | 7,793 | 13.36% |
| EPS | 5.33 | 6.08 | 7.09 | 8.26 | 9.02 | 11.27 | 13.14 | 16.24% |
Revenue grew at a CAGR of 11.40% since 2016, a bit slower than EBIT growth (13.36% CAGR). As described earlier, EBIT grew a bit faster because the EBIT margins in the North America region expanded a little bit.
EPS grew even faster, despite share count being basically flat. This results from changes in the tax rate effective from 2018 onward, as can be seen in the following chart:
Net income divided by EBIT (Author – numbers from Costco 10-K)
The effect of the tax rate change only partly effected FY2018 because the FY ended in August 2018. FY2019 was the first year to fully show the effects of the change. The revenue CAGR of 11.40% is probably the best measure for describing Costco’s growth rate in the past few years, since EBIT margins can’t expand indefinitely (and they shouldn’t in the case of Costco) and the CAGR in net income was mainly pushed up from tax rate changes, a unique effect. Still, a growth CAGR of 11.40% is impressive, especially for a retail giant such as Costco.
ROCE
To value any company, I need to know at what rates of return it can reinvest profits. I will use the return on capital employed (ROCE) for this purpose. The table shows Costco’s capital employed (by my definition: equity plus long-term liabilities less net cash position if there is any) and the ROCE (EBIT/capital employed):
| FY | 2016 | 2017 | 2018 | 2019 | 2020 | 2021 | 2022 |
|
Capital employed in $ million |
17,335 | 18,551 | 19,918 | 19,622 | 28,072 | 29,059 | 32,025 |
| ROCE | 21.2% | 22.2% | 22.5% | 24.1% | 19.4% | 23.1% | 24.3% |
The average ROCE for Costco over the past few years was around 22%. To achieve a growth CAGR of 11% (EBIT-growth assuming no margin expansion), Costco would have needed to reinvest around 50% of earnings back into the business, leading to growth of capital employed at the same rate as revenue growth. Here are the numbers (in $ million):
| FY | 2016 | 2017 | 2018 | 2019 | 2020 | 2021 | 2022 | CAGR |
| Capital employed | 17,335 | 18,551 | 19,918 | 19,622 | 28,072 | 29,059 | 32,025 | 10.7% |
| Revenue | 118,719 | 129,025 | 141,576 | 152,703 | 166,761 | 195,929 | 226,954 | 11.4% |
Capital employed and revenue nearly grew hand in hand over the past few years. As long as Costco can reinvest profits at a ROCE of around 22%, they will be able to grow at a high rate for many years to come. As I outlined in the growth prospects chapter, I think Costco has more than enough room to expand operations, especially internationally.
Cash-conversion
Lastly, I want to take a look at the cash-conversion to gauge total return potential in the future. For this purpose, I use free cash flow and deduct stock-based compensation, since I treat it as a cash expense. Since changes in working capital make it hard to get a consistent cash-conversion number, I will use the accumulated numbers from FY16 to FY22. The accumulated net income and free cash flow over this period was $26,675 million and $21,832 million respectively, resulting in cash-conversion of a bit above 80%.
Wait, this doesn’t look like Costco reinvests 50% of earnings back into the business. This is where Costco’s own description of their business model, which I highlighted at the beginning of this article, comes back into play again:
We often sell inventory before we are required to pay for it, even while taking advantage of early payment discounts.
Costco 10-K
On average, Costco’s operating cash flow has been around 20% higher than EBIT. So if I deduct CAPEX from operating cash flow, it makes sense that the cash-conversion is higher than my estimated reinvestment rate of 50%.
Valuation
At the time of this writing, Costco is trading at $460.59 per share. As of the 1st quarter report of the current fiscal year, there are 444,531,000 shares outstanding, resulting in a market cap of $204.75 billion. According to Seeking Alpha, the net cash position as of the end of the 1st quarter of FY23 stands at $2.63 billion, resulting in an enterprise value of $202.12 billion. Trailing twelve months net income stands at $5.884 billion, so that Costco currently trades at a PE of around 34.3 with TTM earnings per share of $13.24. Assuming a normalized cash-conversion of 80%, as described above, leads me to assume normalized free cash flow per share of $10.59 for a free cash flow yield of 2.33%.
Assuming Costco can keep reinvesting 50% of earnings at an average ROCE of 22%, as outlined above, would lead to earnings growth of around 11% per year. Adding the 2.33% free cash flow yield should result in potential total long-term returns of around 13% per year, disregarding any changes in valuation.
To gauge the possible effects of valuation changes, I will use a supplemental DCF valuation with the above estimates regarding growth and the FY23 EPS estimates. According to TIKR (S&P Capital IQ), FY23 EPS is expected to be $14.56. Assuming cash-conversion of 80% would result in $11.65 of free cash flow per share. With the estimated 11% growth rate for the next decade and 6% growth thereafter, the DCF calculation results in a value per share of $460.45, as can be seen in the snippet below.
DCF calculation (moneychimp.com)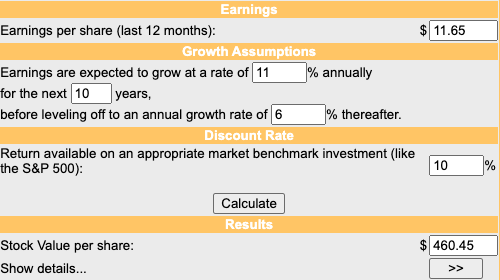
This is nearly identical with how the market prices Costco at the moment. We have to keep in mind that this is based on next fiscal year numbers, so for the TTM numbers, Costco is a bit overvalued at the current price.
Risks
In my opinion, there are basically two risks for Costco:
If Costco management loses their way of acting like a “union” for consumers, the value proposition Costco stands for would be at risk. The scenario I have in mind is that some years down the road, management changes and the new management starts trying to push margins. As I outlined earlier with the quote from Costco CEO Craig Jelinek: “Costco is a top-line company, not a margin company”. So if Costco would start focusing on margins instead of passing their efficiency on to the consumer through lower prices, a Costco membership will lose value and renewal rates would come under pressure. This is, in my opinion, the most dangerous risk for Costco.
The second risk would be that Costco could come into a position where they just don’t have any more places/regions to grow. Over the past decade, Costco grew international store count at nearly twice the CAGR of store count in North America. Now if for whatever reason the expansion in, for example, China would fail, this could pose a big problem to footprint expansion for the next decade. After doubling store count in Korea and Japan (mainly dense populated areas like Seoul and Tokyo) over the last decade, China should become the next country to expand into for the next decade (mainly because the highly populated cities are predestined for the Costco model). As I already outlined in the growth prospects chapter of this article, I doubt that Costco’s expansion into China will face any issues, so I rate this risk lower than the one I described above.
Conclusion
Compared to peers Walmart and Target, Costco was the only big retailer that was able to meaningfully grow store count and retail square feet over the past few years. The Costco model offers the most value for higher income/spending households. This makes Costco more resilient to economic downturns. Costco has the best operating efficiency due to the warehouse model, allowing them to be profitable on far lower gross margins compared to peers.
Costco expanded their international footprint at a faster rate than in North America, and international stores are more profitable because Costco focuses on the densest populated areas (for example Seoul and Tokyo). The expansion in China should be the next step, with two stores planned to open in the near future.
Disregarding multiple expansion or compression, I think Costco can deliver around 13% annual returns (11% growth and 2.3% normalized free cash flow yield). Costco trades at a premium valuation, with a PE of around 34 and a normalized free cash flow yield of a bit above 2.3%. My DCF valuation indicates that Costco is fairly valued based on the FY23 earnings, but a bit overvalued based on the TTM earnings.
Despite the assumed overvaluation, I rate Costco a buy for long-term investors. The quality of the business model, the predictable growth prospects and the assumed long-term total return potential of 13% more than offset paying up for such a quality company.
Be the first to comment