

andykatz
Thesis
Costco Wholesale Corporation (NASDAQ:COST) has had a remarkable year as it defied the broad market decline and outperformed the market considerably. As such, COST posted a YTD total return of -13.8%, well ahead of the S&P 500’s (SP500) (SPX) -19.9% return.
Costco has also executed well despite worsening macro headwinds. Unlike its consumer discretionary retail peers, it has kept a tighter lid on inventory growth. Moreover, its ability to drive value has helped it maintain strong comparable sales growth even against tough comps from 2021.
COST’s valuation has consistently traded above the broad market’s average, and its consumer staples sector peers over the past ten years. Yet, COST’s 10Y total return CAGR of 20.8% outperforms the SPX’s 12.4% over the same period. Therefore, expecting the market to digest its premium significantly could prove challenging, as Costco has proved its execution during economic downturns.
Still, we believe the valuation premium in COST is not justified as we move closer to a recession. While Costco has proved its ability to drive significant operating leverage relative to its sector peers, we postulate COST could continue to be de-rated further.
COST’s price action also indicated that it had lost its medium-term bullish bias, as it failed to regain control of its April and August highs. Therefore, we deduce that the reward/risk remains unattractive at the current levels and urge investors to be patient.
Maintain Sell.
Costco’s Growth Likely Peaked In 2021/22
Costco US comparable sales change % (S&P Cap IQ)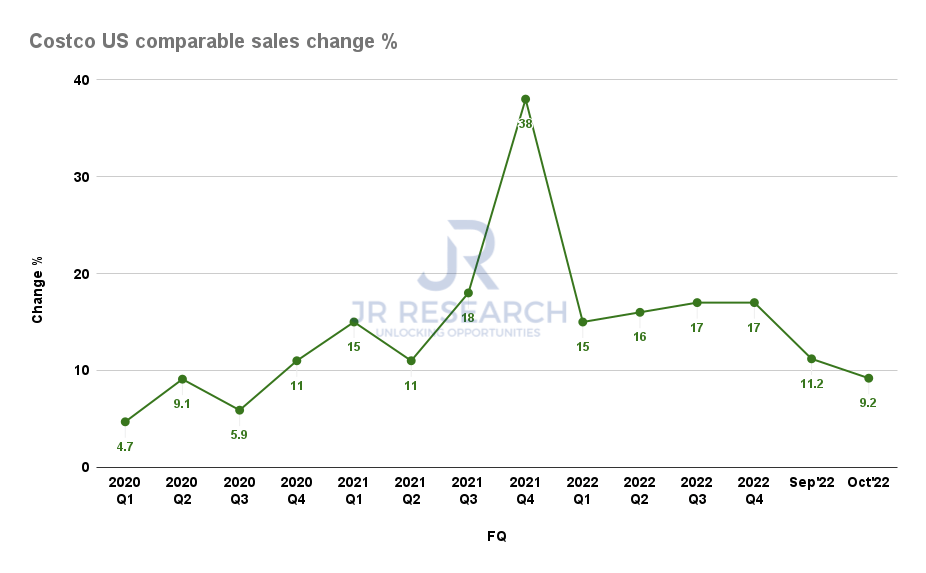
As seen above, Costco delivered a robust FQ4 in its most recent quarter (ended August). However, recent sales data showed that tough comps from FY22 have started to impinge on Costco’s ability to maintain its outperformance.
As a result, investors expecting a repeat of Costco’s FY21/22’s remarkable above-trend growth could be in for a massive disappointment as its growth normalizes in FY23.
Costco Gross margins % and EBIT margins % consensus estimates (S&P Cap IQ)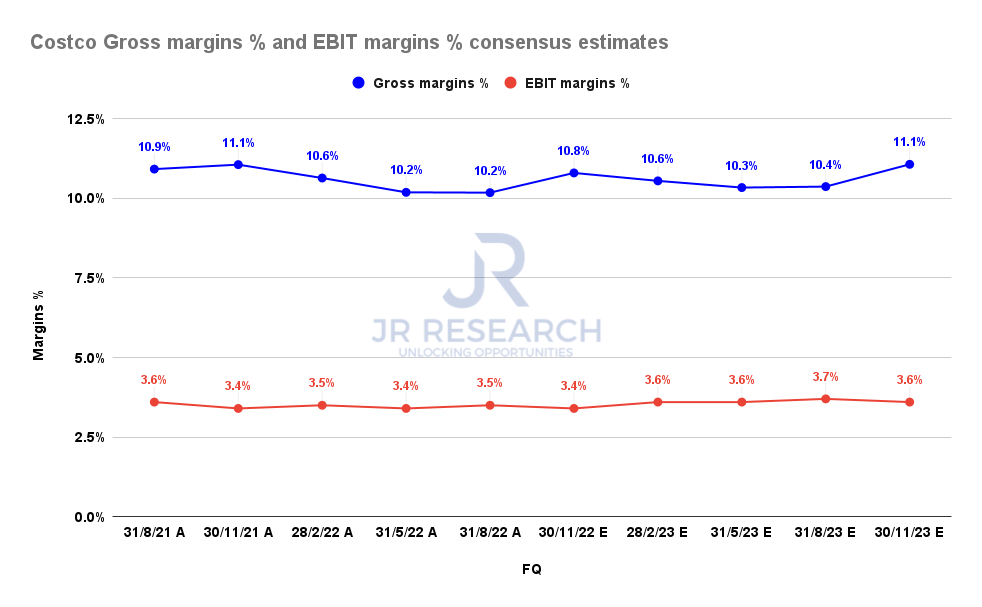
Despite that, the consensus estimates (bullish) suggest that Costco could continue driving incremental operating leverage despite slowing topline growth.
While Costco has proved its price leadership over the years with its members, we believe that assumption could be tested in 2023 as we move closer to a recession. Hence, it puts significant pressure on management to drive higher operational efficiencies through cost optimization or raising prices to deliver what Wall Street has projected.
Wells Fargo (WFC) highlighted the potential issues with the current estimates, as it added:
Comparable sales growth for Costco is seen at risk of arriving lower than anticipated. An eventual pullback in fuel margins and currency exposure could clip earnings momentum. We see more risk to consensus estimates going forward than upside potential, not a good set-up for this name given its valuation. – Seeking Alpha
Costco Revenue change % and EBIT change % consensus estimates (S&P Cap IQ)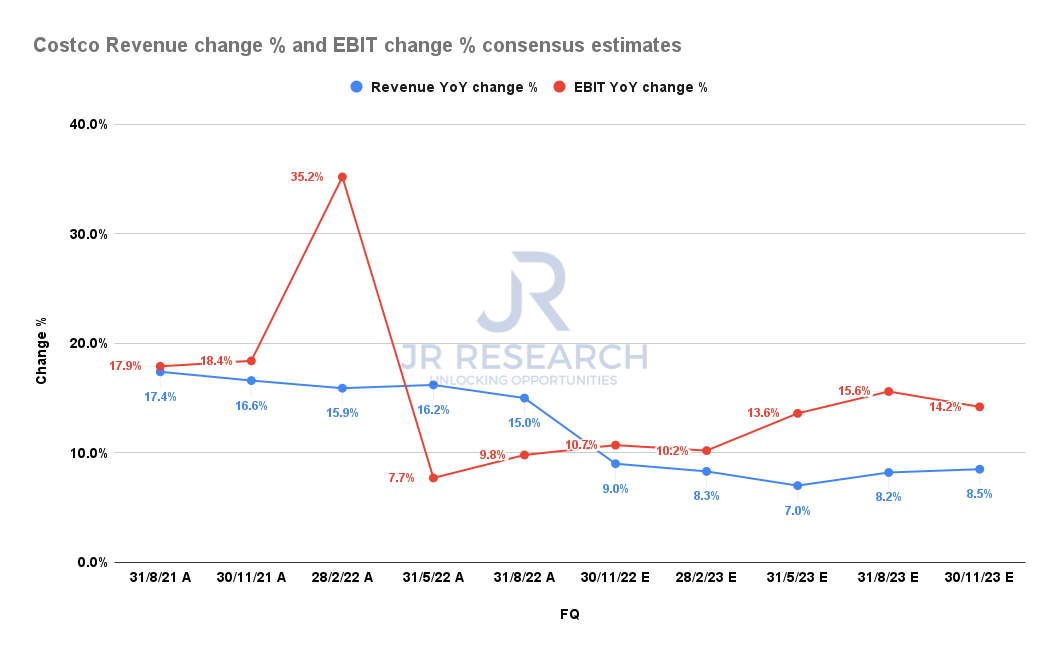
Accordingly, as seen above, we urge investors to be wary about relying on the current consensus estimates in their modeling.
Also, forward earnings estimates for Costco’s sector peers have been revised downward through October for 2023, down to 4.5%. However, we gleaned that Costco’s FY23 adjusted EPS was upgraded from June, as analysts expect Costco to post YoY growth of 10.4% (up from June’s estimates of 10.1%).
As such, Costco’s analysts could be overly optimistic here, even as its sector estimates have been revised downward markedly.
Furthermore, COST’s valuations are so high that it’s difficult to justify a reasonable reward/risk profile at the current levels.
Is COST Stock A Buy, Sell, Or Hold?
COST NTM EBITDA multiples valuation trend (koyfin)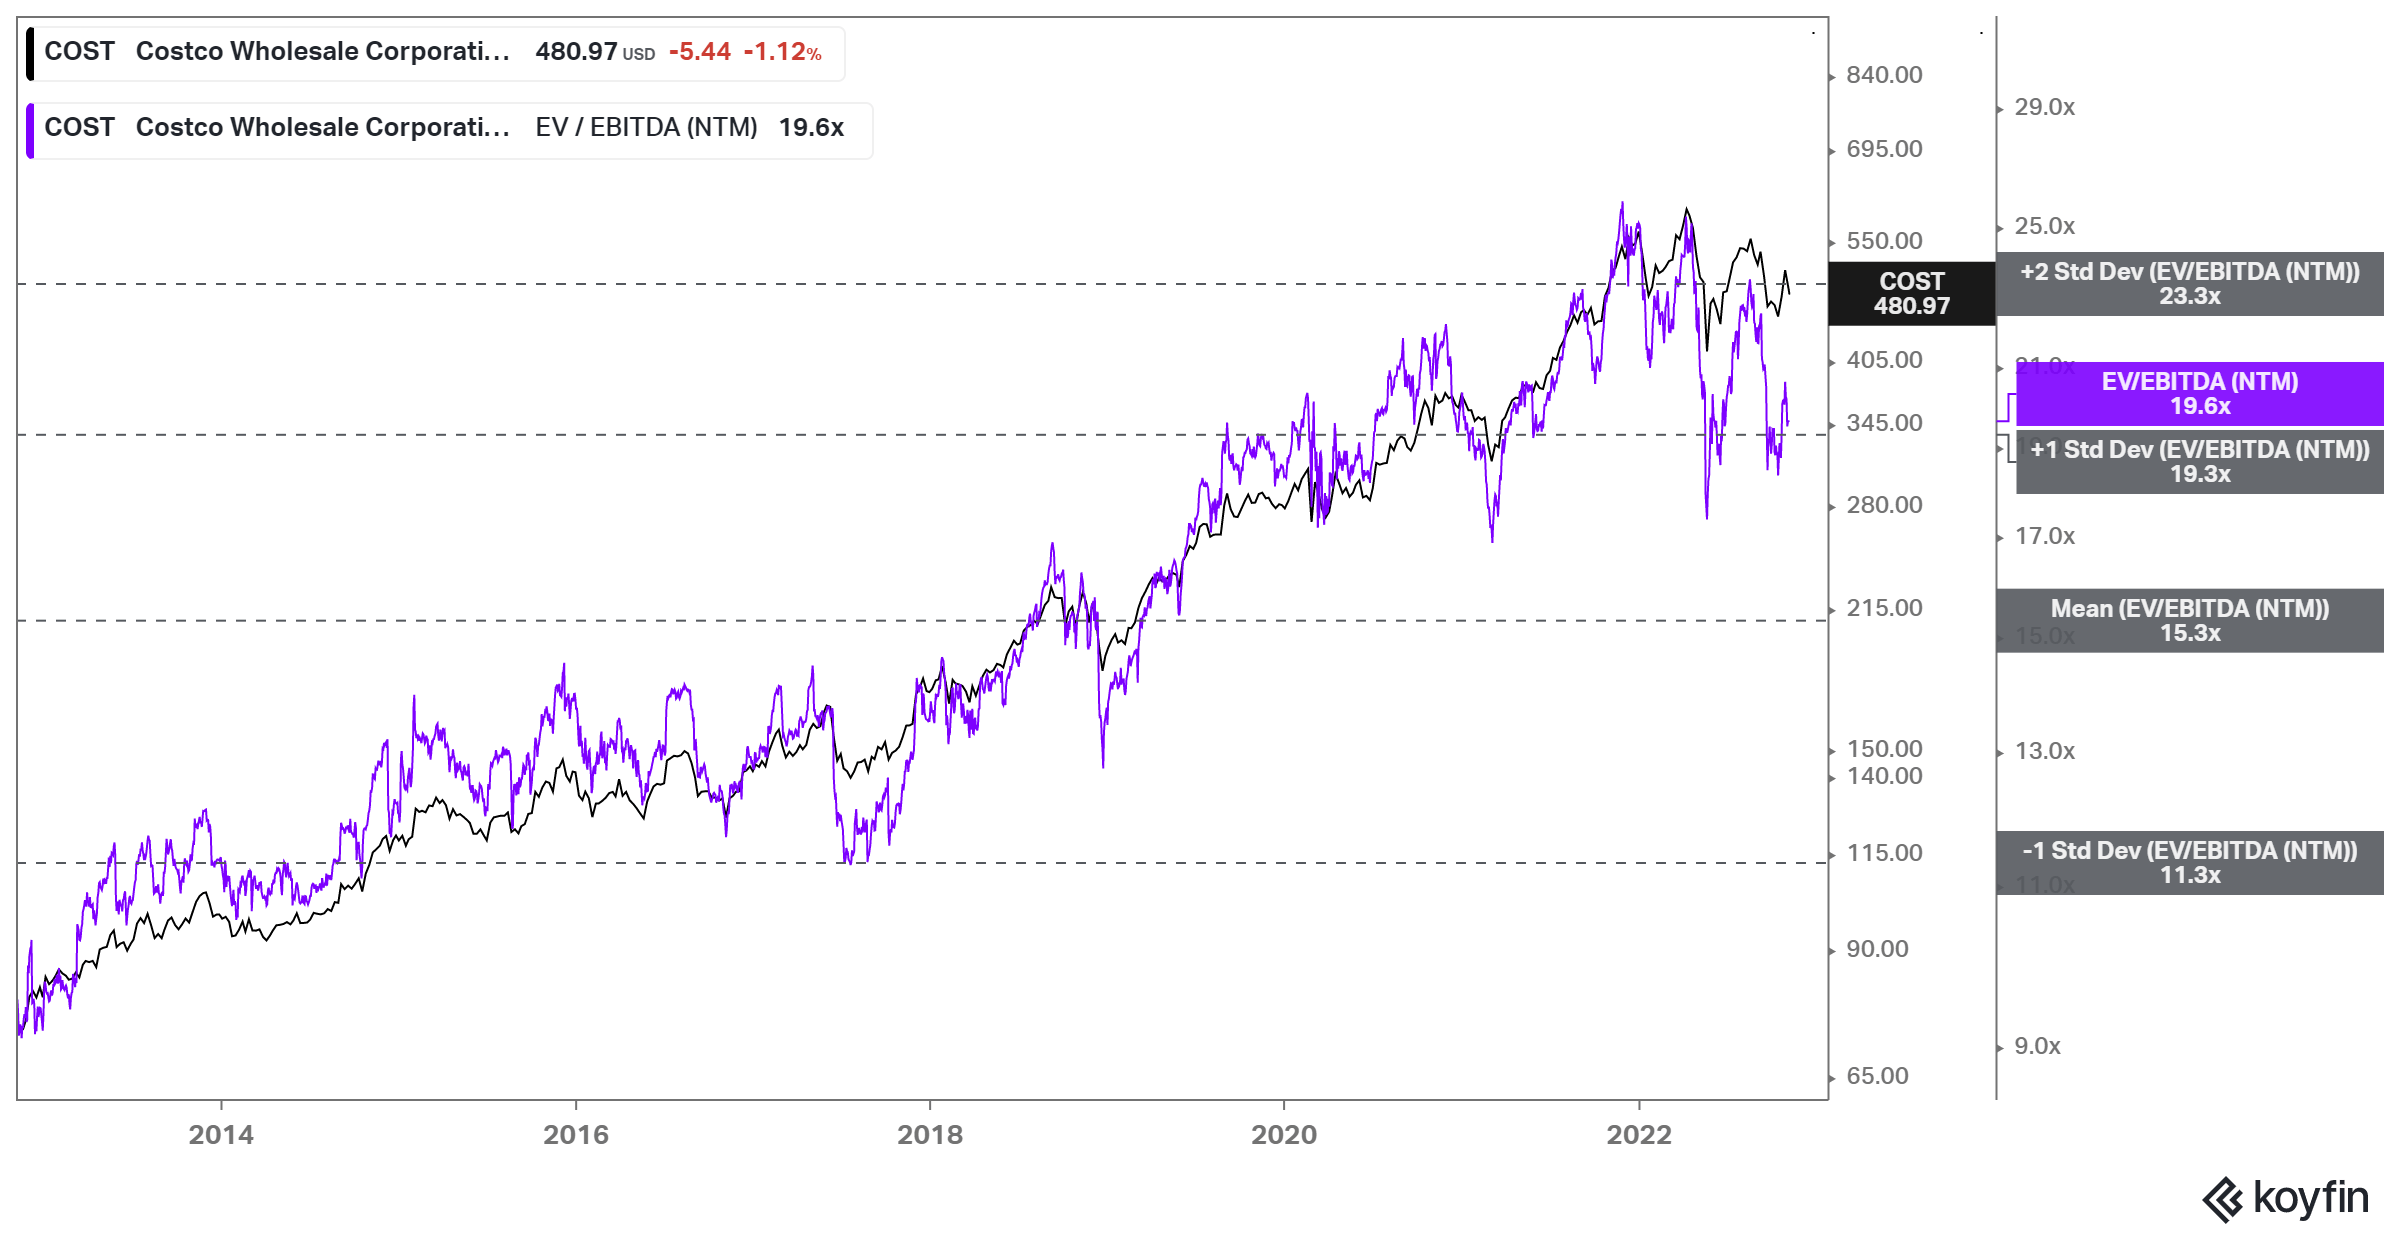
COST last traded at an NTM EBITDA multiple of 19.6x, well above its 10Y mean of 15.3x. It’s also just under the significantly overvalued zones in April. Its NTM normalized P/E of 33.2x is well above its sector forward P/E of 20x.
We acknowledge that COST has consistently traded at a premium (10Y mean: 29.7x NTM earnings). However, we postulate that its near-term upside has already been reflected, with the potential for value compression due to potentially overly optimistic earnings forecasts. At such levels, COST could face a steeper fall.
COST price chart (weekly) (TradingView)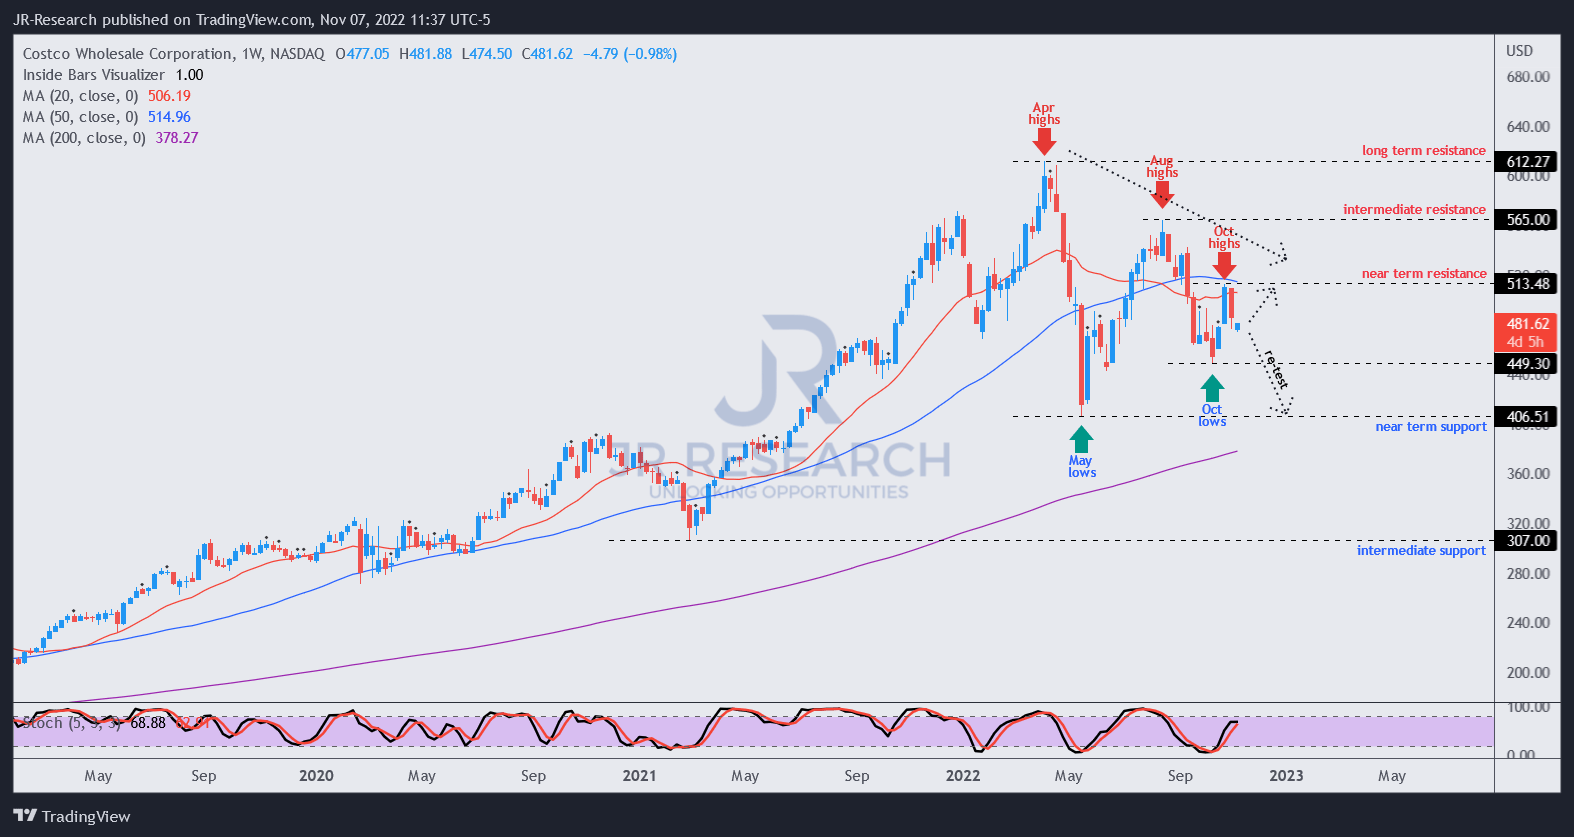
We gleaned that COST has already lost its medium-term bullish bias, with a series of lower highs stanching further buying upside momentum.
Therefore, we view the potential for a re-test of its October lows or May lows as more likely than a decisive upside break of its recent October highs.
The support level at its May lows has proved robust, which could offer investors an opportunity to add, as it’s also close to its 200-week moving average (purple line).
Hence, we urge investors looking to add more positions to be patient.
Maintain Sell.
Be the first to comment