

SimonSkafar/E+ via Getty Images
The Teucrium Corn Fund (NYSEARCA:CORN) offers exposure to the price performance of corn futures through an ETF structure. While corn was a big winner to start the year amid headlines of global supply chain disruptions and the uncertainty surrounding the Russia-Ukraine war, the trading action over the last few months has been defined by a sharp correction lower. The shift reflects a selloff in energy prices and a stronger dollar helping to balance supply and demand.
Our take is that now is the time to get bullish again, ahead of a potential rebound. We like the CORN ETF as a good option to capture tactical price swings and high-level themes playing out over a few months. This article highlights several reasons why we’re bullish on corn and agriculture commodities that may see another big move to the upside.
Seeking Alpha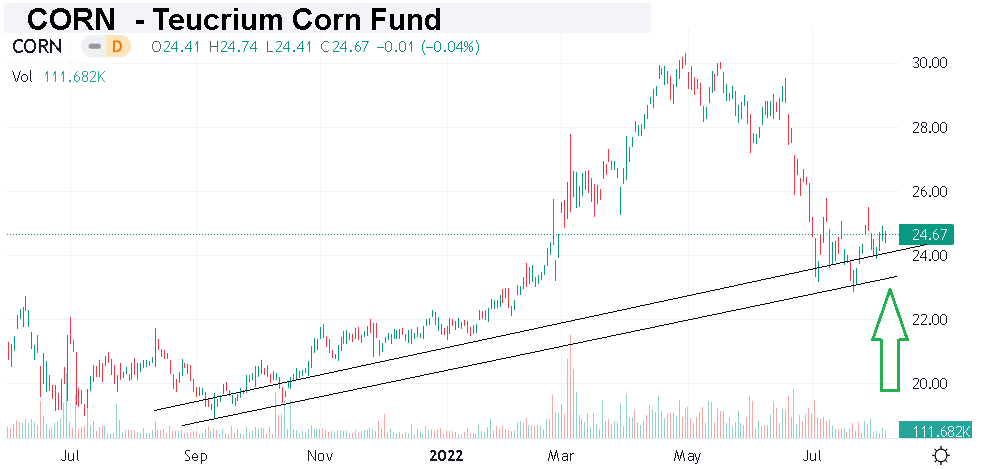
What is the CORN ETF?
The CORN ETF holds a portfolio of corn commodity futures trading on the Chicago Board of Trade exchange. According to the fund manager, the fund maintains a 35% weighting in the second-to-expire futures contract, followed by 30% in the third-to-expire contract, and finally another 35% in the contract expiring in December following the expiration of the third-to-expire contract. This strategy here requires some active management by regularly rebalancing and rolling over positions which, depending on market pricing conditions, may impact the overall performance relative to spot rates.
Corn is one of the most important inputs to the global food supply along with applications for clean fuels like ethanol. The expectation is that a growing global population will drive long-term demand as a tailwind for higher pricing.
The attraction of corn as an agricultural commodity is that it can represent an alternative investment, historically trading with a low correlation to U.S. equities. This means that CORN can work as a portfolio diversifier in the context of broader holdings.
Teucrium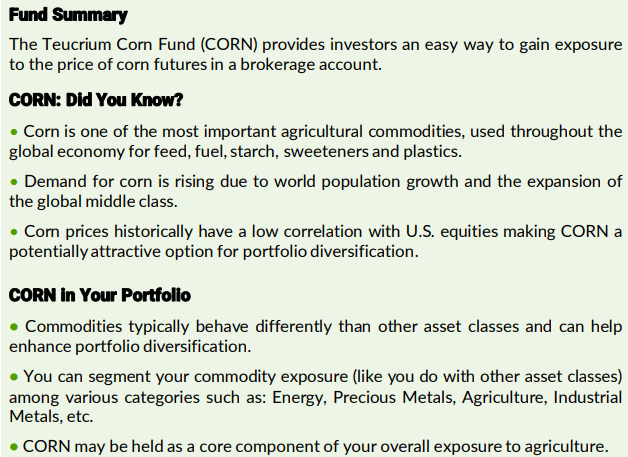
Corn Market Fundamentals
There are several moving parts to the corn market outlook. According to the U.S. Department of Agriculture, July’s Supply and Demand Outlook report, world “coarse grains” output at 1,477 million metric tons for the current 2022/2023 agriculture year is expected about 2% lower compared to last year, but still up about from the 2020/2021 season. Similarly, worldwide ending stocks this year are expected to remain relatively flat, balancing offsetting declines and increases in various regions.
USDA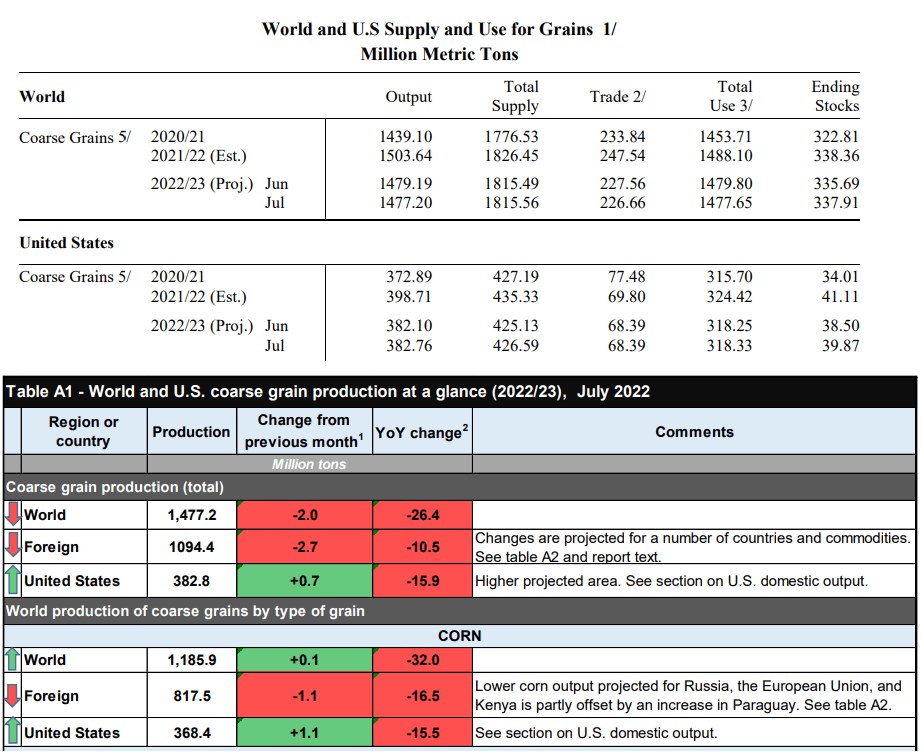
Beyond some granularities, like a higher projected planting area in the U.S. and an ongoing drought in Kenya, the data here suggest overall stability. Ukraine, which represents around 12% of global corn exports, was a big question market back in Q1 with uncertainty about how the ongoing war would impact its supplies. While there were some disruptions to the spring harvest, the data now shows that farmers have expanded export volumes that are running higher than anticipated.
The development over the past month was a Treaty signed with Russia, brokered by Turkey, to allow for a protected shipping channel, which helped ease fears of a shortage. Reports suggest the deal is working with Ukraine taking the opportunity to move inventories as quickly as possible. Again, all these factors help explain why corn has been under pressure since early May. We can also point to the selloff in oil as helping to lower transportation and logistical costs in all commodities.
Corn Price Forecast
The question for corn is how much of the easing supply chain conditions compared to Q1 have already been priced in on the selloff and where do the bulls have room to start getting an upper hand. One insight we offer is that based on corn seasonality, August has historically marked the cycle low in pricing over the past decade into the fall harvest as farmers sell expected output.
By this measure, the trading action this year has played right into this dynamic with the commodity price of corn reaching a bottom, going back nine months, in the final week of July before a more recent bounce higher.
Agriculture.com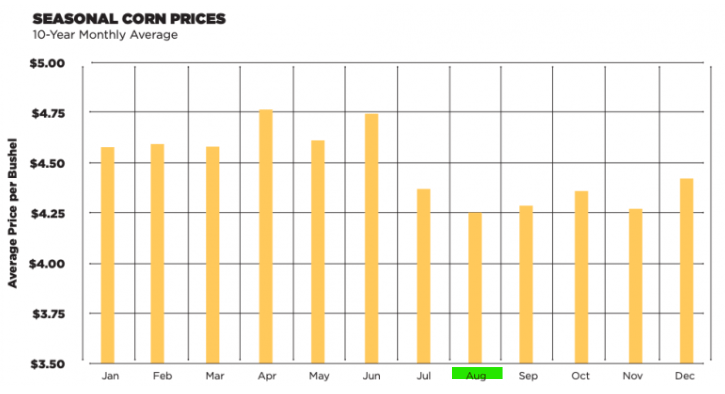
We also know that the challenging macro environment highlighted by the weaker-than-expected Q2 GDP report has driven some declining expectations on the demand side. That being said, there are some reasons that economic conditions could get a boost going forward from the drop in energy prices. A scenario playing out where macro data begins to come in better than expected should provide more positive momentum as commodity buyers step back in.
With agriculture, there is also the scenario where the Russia-Ukraine conflict escalates into Europe, which would lead to a resurgence of supply shortage concerns. A rebound in energy prices would likely signal the start of a new rally for all commodities.
Finally, we can take a look at the price chart, noting an interesting inverse head-and-shoulders pattern playing out. This is trading action defined by a low in the first shoulder, leading to a fake breakdown as the “head”, followed by a bounce higher and another retest of the new shoulder support can sometimes signal a reversal of the longer-running downtrend. With corn currently trading around $6.20 a bushel, a breakout higher here may be able to target ~$7.50 to the upside as the next level of significant resistance.
finviz.com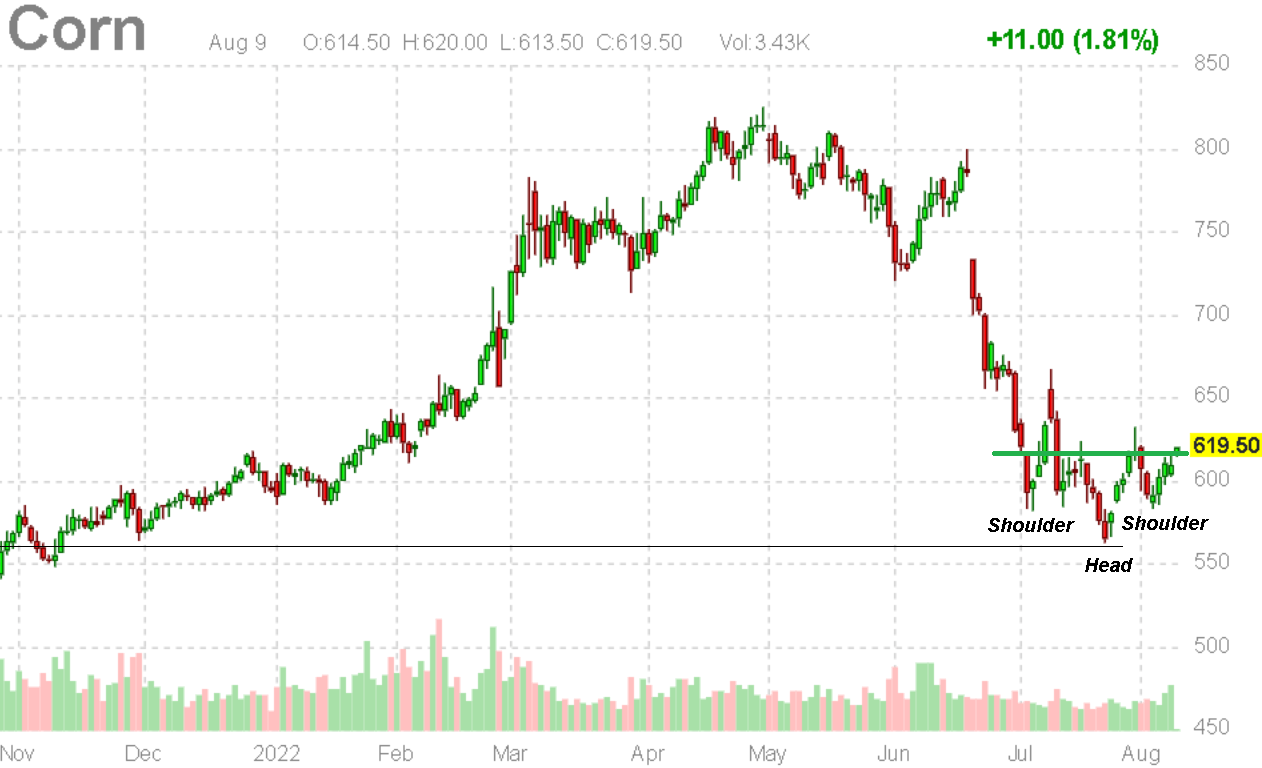
As it relates to the Teucrium Corn Fund, the chart pattern lines up while the breakout here is above the $25.00 share price. To the upside, we’d like to see some follow-through towards $28.50 as our price target.
Seeking Alpha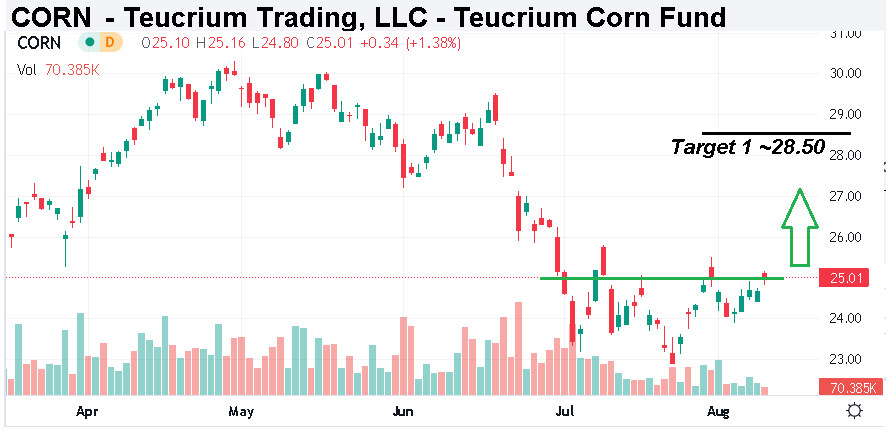
Final Thoughts
A long position in CORN looks like an interesting trade opportunity. With the ETF, we’d suggest a stop limit at the recent “shoulder” low around $24.00 as risking $1.00 while the price target of $28.50 offers a potential gain of $3.50 with a nearly 4-to-1 reward-to-risk ratio.
Investors seeking to gain exposure to broader agriculture prices can also consider the Invesco DB Agriculture ETF (DBA) which includes futures holdings across several grains and softs.
In terms of downside risks, a deeper deterioration to the global macro outlook is defined by a collapse in consumer spending and would open the door for a leg lower. Investors should also monitor the monthly USDA grain projections update and feed outlook as an indicator of market fundamentals.
Be the first to comment