

alvarez
Investment Hypothesis
High leverage followed by an uncertain macroeconomic environment, geopolitical tensions, supply chain risks and the cyclical nature of the automotive industry make Cooper-Standard Holdings (NYSE:CPS) a risky stock to hold at the current price. Further, the company’s low-interest coverage ratio and low asset efficiency could make it challenging to service its future debt obligations. Thus, it serves well for existing shareholders to exit at this price, and for new investors, it is better to avoid this stock.
About Cooper-Standard Holdings
Cooper-Standard Holdings is a global supplier of systems and components for the automotive industry. It operates on a business model that serves automotive original equipment manufacturers (OEMs) by providing them with various products, including seals, fluid handling systems, and anti-vibration systems. The company was founded in 1960 and is headquartered in Northville, Michigan. The company operates in various regions worldwide, including North America, Europe, and Asia. It generates revenue through selling its products to OEMs and aftermarket sales to the repair and replacement market. The company’s business model focuses on delivering value to its customers through product innovation, operational excellence, and global scale.
In the last month, the company’s stock price has increased by 43% due to the completion of refinancing transactions.
Seeking Alpha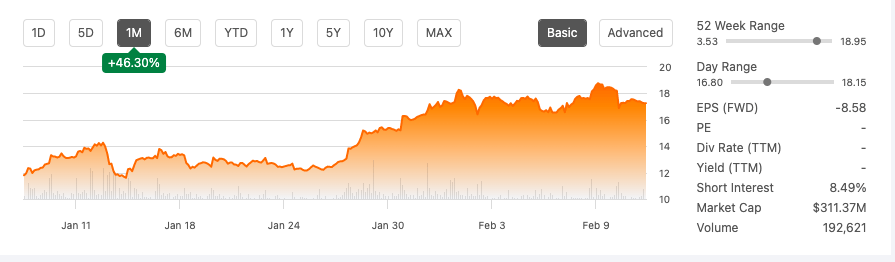
However, in the last five years, the company yielded a negative return of 84.96% to their shareholders against a return of 54.1% from the S&P 500.
Seeking Alpha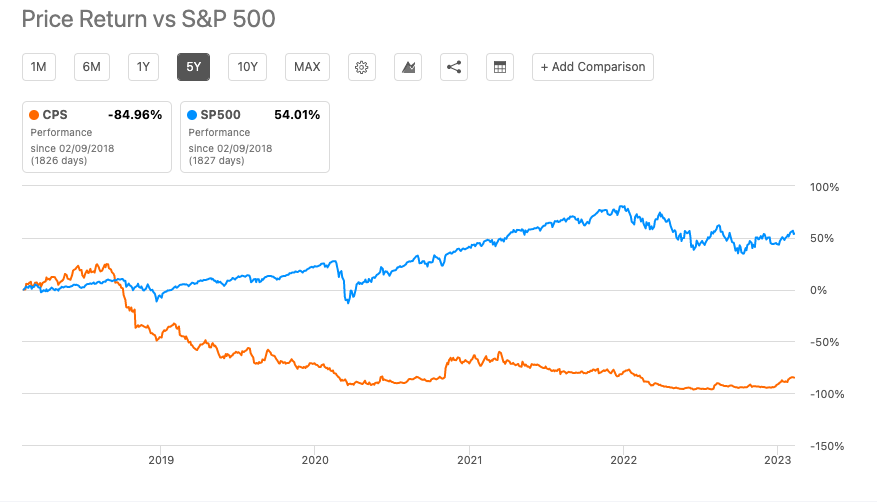
Further, the company’s actual EPS consistently trailed the EPS estimate in the last five years, indicating that the company was unable to meet street expectations.
Seeking Alpha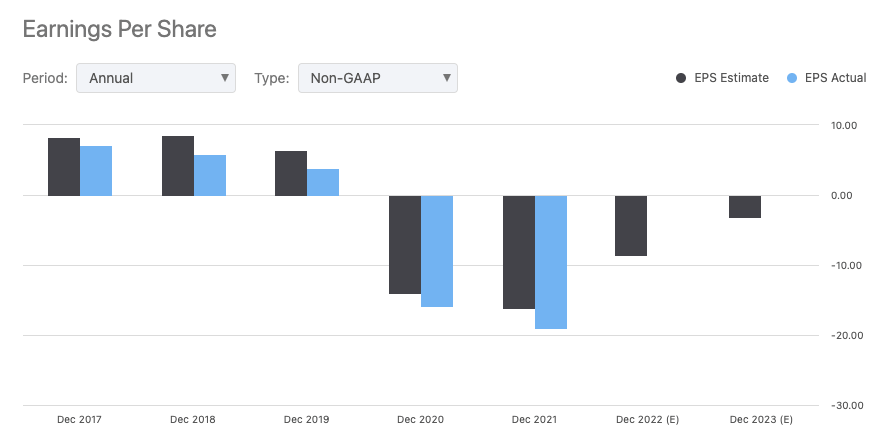
The company operates in a cyclical automotive sector susceptible to uncertain economic conditions that could adversely impact new vehicle demand and production. Its four markets – North America, Europe, APAC and South America have witnessed turbulence, with North American markets adversely impacted due to high inflation, the war in Ukraine impacting its European business, the COVID crisis affecting its business in China and the political crisis in Brazil impacting its business in South America.
Further, the company’s operating income is impacted by high raw material costs. According to the Management’s Discussion and Analysis of Financial Condition and Results of Operations in 10-Q for the period ended September 30, 2022:
Our business is susceptible to inflationary pressures concerning raw materials, which may place operational and profitability burdens on the entire supply chain. Costs related to raw materials, such as steel, aluminium, and oil-derived commodities, continue to be volatile, which led to significant increases in these costs in 2021. Current global events continue to add further price pressure and uncertainty to raw material costs for 2022. In addition, we continue to see significant inflationary pressure on wages, energy, transportation and other general costs.
Author Calculations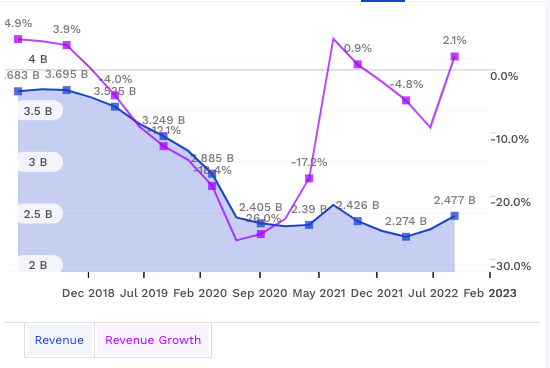
The last five years were challenging for Cooper-Standard Holdings, with sales declining at -7.7% CAGR, though the company is showing signs of recovery by showing a growth of 2.1% in September 2022.
Author Calculations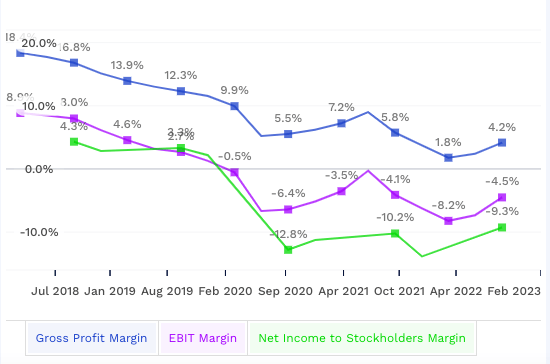
The company’s gross margin has also steadily declined from 18.4% in 2018 to 4.2% in 2023, primarily due to increased raw materials costs and supply chain risks. In addition, the net margins have declined due to high-interest expenses as the company has taken additional debt to fund its working capital and capital expenditures.
Author Calculations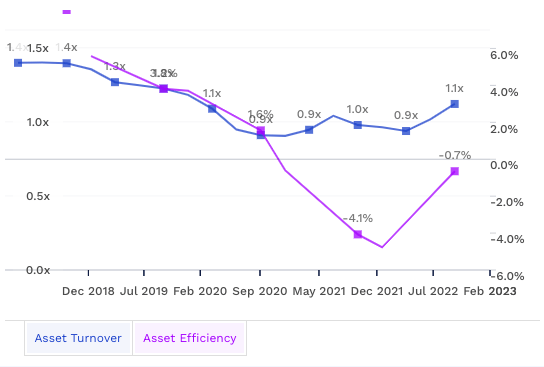
The company’s asset turnover and efficiency have gradually declined, reflecting its poor productivity in utilizing assets for revenue generation. However, due to recent divestitures and asset sales, the company has divested non-performing assets that do not contribute to higher revenues and earnings. Thus, there is a gradual improvement in asset turnover and asset efficiency.
Author Calculations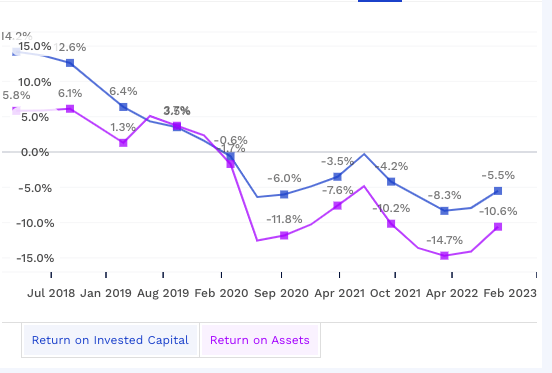
The company’s ROIC and return on assets have steadily declined due to lower operating income. The company is not generating enough profits compared to its invested capital and assets due to higher competition, lower demand for its products or adverse macroeconomic conditions. However, the company’s cost of capital has increased due to higher business risk and financial leverage.
Author Calculations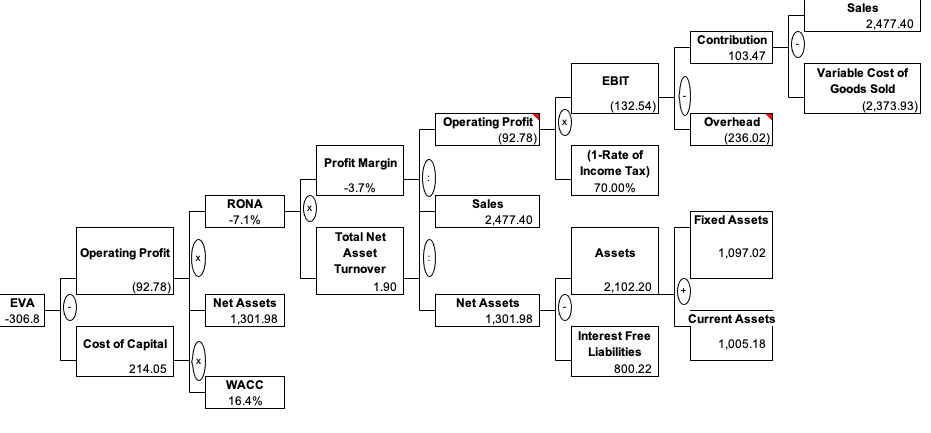
When I calculated the EVA for the company, I arrived at a negative EVA of 306.8 million, indicating that Cooper Standard Holdings is not generating enough profit to cover its cost of capital due to low operating income and inefficient use of capital.
Author Calculations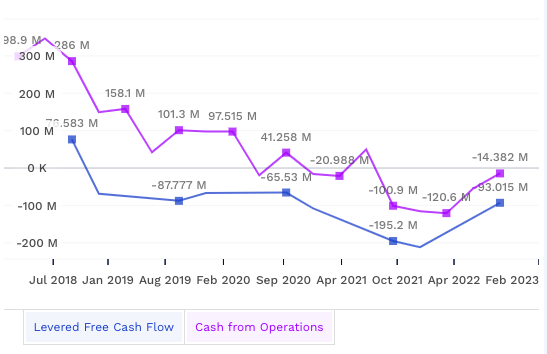
The company’s levered cash flow has been negative for the last four years due to high-interest expenses, a higher debt burden to fund its capex and working capital, and low operating income. Thus, the company is not generating enough cash flow from operations to cover its ongoing expenses and investments, which can limit its ability to pay dividends, repay debt, or invest in future growth opportunities.
In Q3 2022, the company reported sales of $657.2 million, an increase of 24.8% against Q3 2021 on the back of winning new business on electric vehicles, with the firm winning $27 million business in Q3 2022 and $72 million in 2022 YTD. According to Jeffrey Edwards, chairman and CEO of Cooper Standard:
We were able to leverage our improving cost structure, enhanced commercial agreements and higher year-over-year industry production levels to drive positive results in the quarter; OEM production schedules remain erratic, however, with actual volumes still falling well short of industry forecasts and our customers’ releases. Despite this continuing challenge, we expect to deliver further operational improvements and margin expansion throughout the year.
The increase in sales was driven by volume and mix (higher net vehicle production volume due to the impact of lessening semiconductor supply issues in the current year) and net customer price adjustments, including recovery of cost increases.
CPS 10-Q Report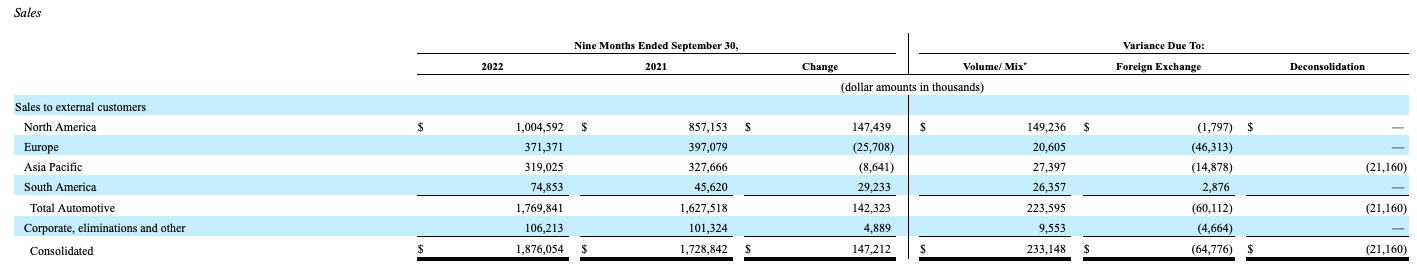
For the company, North America is the biggest market contributing to 57% of its revenues, followed by Europe (21%), APAC (18%) and South America (4%). However, the war on Ukraine affected its growth in Europe, with sales declining by 6.5 from September 2022 to 2021. The company also reported a decline of 2.6% in sales in APAC, primarily due to China’s zero covid policy. However, South America was a shining light, with sales increasing by 64% from September 2022 to 2021. Other foreign exchange impacts related to Euro, Chinese Renminbi and Korean Won contributed to the decline in Europe and APAC business.
CPS 10-Q Report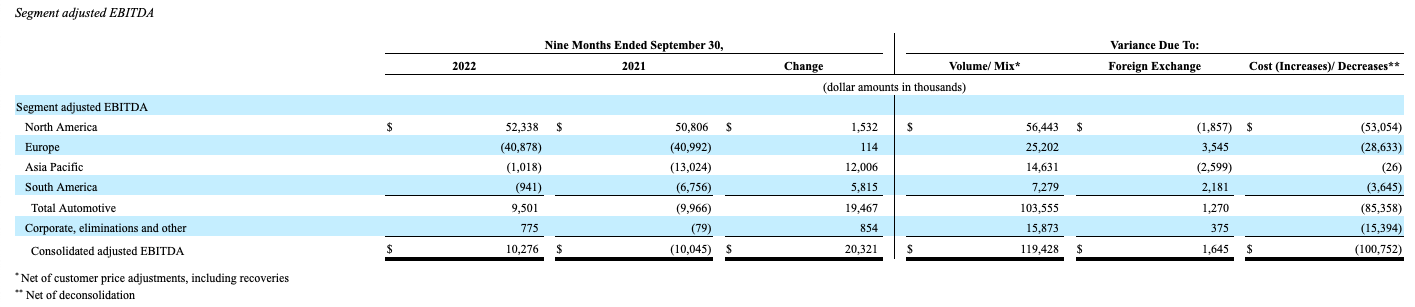
The company’s poor EBITDA in 2022 was due to high commodity costs, rising inflation and compensation expenses.
The company funds its capital expenditures, working capital requirements and debt servicing through operating cash flows, cash on hand, borrowings through revolving credit and receivables factoring.
Author Calculations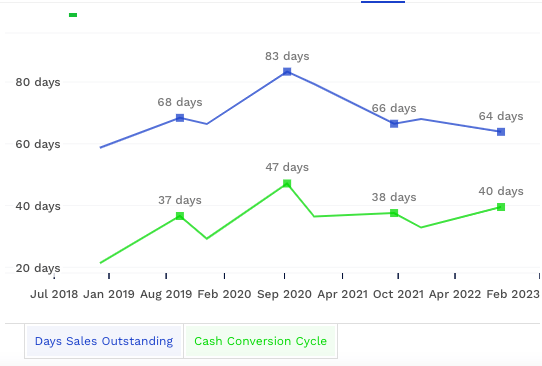
The company has improved its cash conversion cycle from 47 days in 2020 to 40 days in 2022 primarily due to better collection of its receivables resulting in days sales outstanding from 83 days in 2020 to 64 days in 2022.
In addition, the company divested its European rubber fluid transfer and speciality sealing business and its Indian operations to reduce its debt burden. The divestiture resulted in a net gain of $696 million that the company recorded in its 2021 financials.
Accordingly, the Company has implemented several restructuring initiatives, including closing or consolidating facilities worldwide and reorganising its operating structure.
CPS 10-Q Report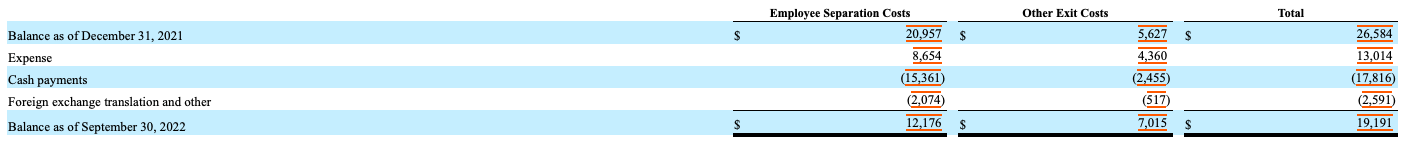
As of September 2022, the company recognized $12.1 million in employee separation costs and $7 million in other exit costs, which included a gain on the sales of its fixed assets related to a closed facility in the APAC region.
Author calculations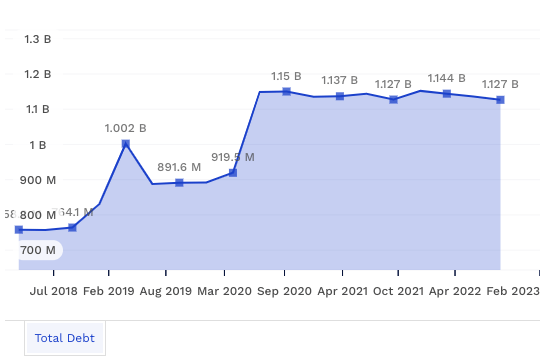
The company’s total debt has increased from $758 million to $1.12 billion in the last five years at a compounded annual growth rate of 8.5%. However, the operating income has steadily declined during this period resulting in high distress for the company. As of September 2022, the company has total long-term debt of $978 million in the form of Senior notes, Senior secured notes, Term loans and Finance leases.
Author Calculations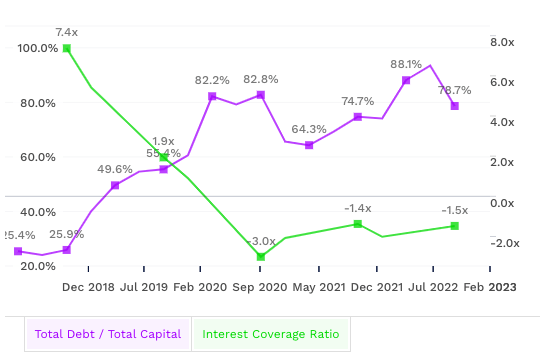
When I plot the company’s total debt to capital against the Interest coverage ratio for the last five years, though the company is trying to reduce its total debt as a percentage of its capital, its interest coverage ratio is less than zero, indicating that the company is having challenges servicing its debt with its operating income. Moreover, if the global macroeconomic situations worsen, the company’s operating income will suffer, affecting its ability to service the debt.
Risks
The company operates in a cyclical automotive industry that is highly competitive. Thus, any further slowdown in economic growth due to geopolitical issues, supply chain risks, or a recession could reduce demand for its products and negatively impact its financial results.
The company has high financial leverage. Any deterioration in financial performance, like loss of critical customers, can increase the risk of default and bankruptcy. The company may not have enough income to repay its debts or be forced to pay higher interest rates to compensate lenders for the increased risk of default.
Valuation
Before I perform an intrinsic valuation of the company using a Discounted Cash Flow approach, I compared the company with its competitors to understand how it has performed in the last five years relative to the competition.
I identify the following companies for my analysis:
- Holley Inc (HLLY)
- Superior Industries (SUP)
- Motorcar Parts Of America (MPAA)
- Eaton Corporation (ETN)
- Gates Corporation (GTES)
| Name | Price / Book | Total Debt / Total Capital | Return on Equity | Return on Invested Capital | Revenue CAGR (5y) | Asset Turnover | EBIT Margin | WACC |
| Cooper-Standard Holdings Inc. | 1.72 | 78.7% | -80.4% | -5.5% | -7.7% | 1.12 | -4.5% | 16.0% |
| Eaton Corporation plc | 4.14 | 12.4% | 14.3% | 9.3% | -0.1% | 0.59 | 14.0% | 11.8% |
| Gates Industrial Corporation plc | 1.34 | 38.4% | 6.7% | 5.3% | 4.8% | 0.48 | 10.7% | 13.5% |
| Holley Inc. | 0.60 | 62.5% | 19.2% | 8.0% | NM- | 0.60 | 13.3% | 16.3% |
| Motorcar Parts of America, Inc. | 0.86 | 50.1% | -1.2% | 3.4% | 9.0% | 0.68 | 4.4% | 13.0% |
| Superior Industries International, Inc. | -1.90 | 60.9% | 11.8% | 7.6% | 13.6% | 1.48 | 4.4% | 19.8% |
Cooper-Standard Holdings has the highest debt to capital at 78.7%, the lowest ROIC of -5.5%, the lowest revenue growth of -7.7% CAGR in the last five years and the lowest EBIT margin of -4.5%.
Author Calculations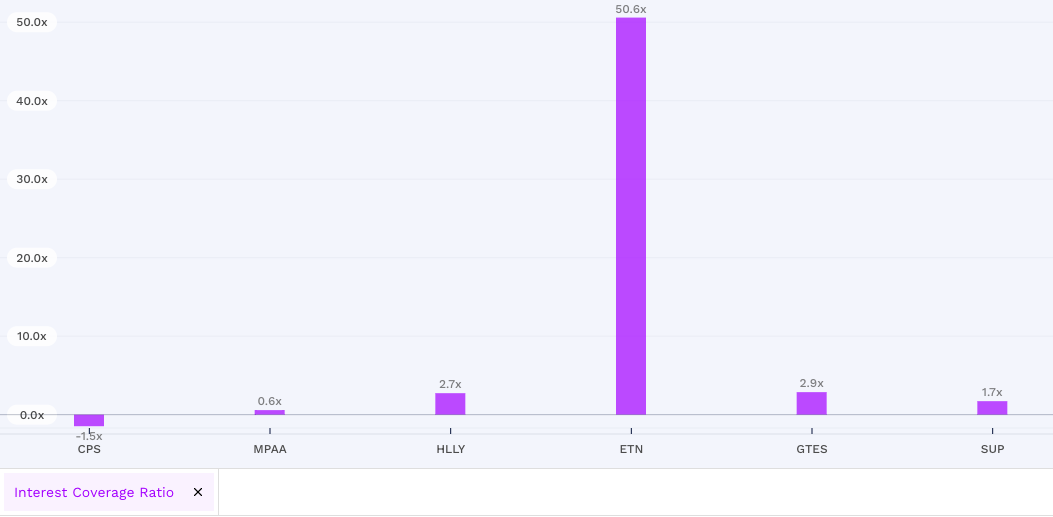
Further, the company has a negative interest coverage ratio of -1.5, indicating that it is not generating enough income to cover its interest expenses. To improve its interest coverage ratio, the company must find a way to increase its earnings, reduce its interest expenses, or find alternative sources of financing. Recently, the company has restructured its debt to improve its financial performance.
Author Calculations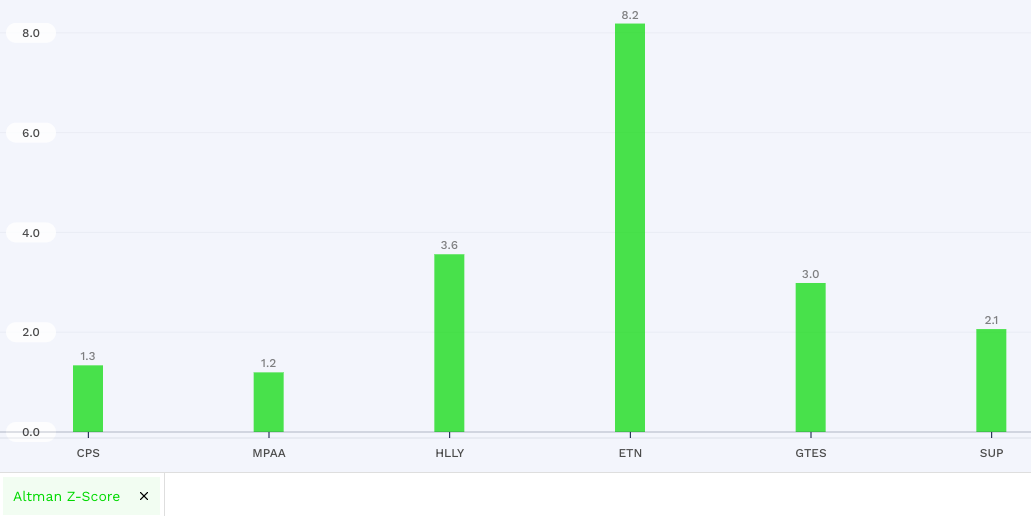
Due to the low-interest coverage ratio and significant debt burden, the company faces a higher risk of bankruptcy. When I compare the company’s Altman-Z score with its competitors, Cooper-Standard Holdings’ score of 1.3, below the score of 1.8, implies that it’s likely the company is headed for bankruptcy.
Author Calculations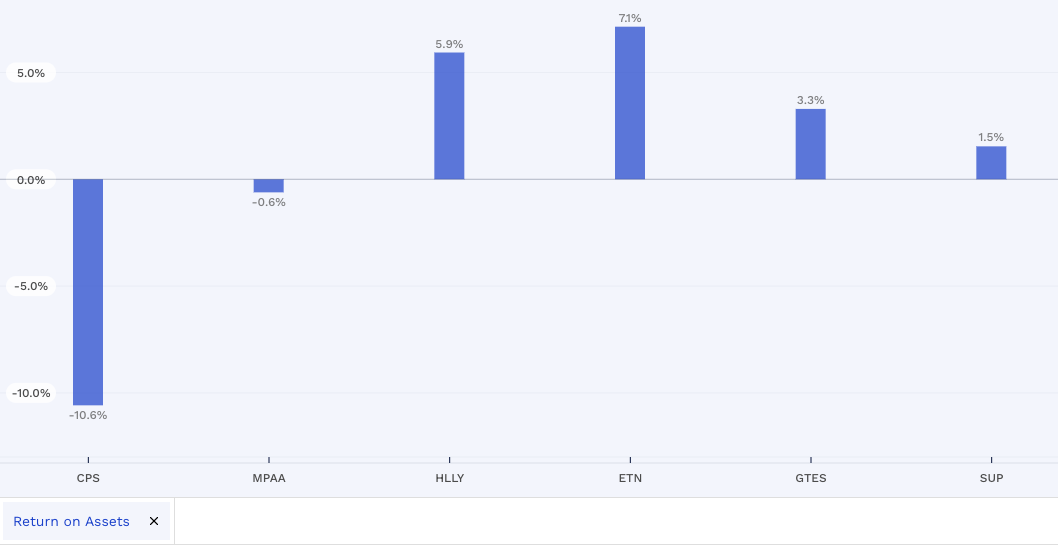
The company has the lowest return on its assets, indicating it is not effectively using its assets to generate profit. To improve its ROA, a company may need to reassess its business strategy, improve its operations, or invest in new assets that have the potential to generate higher returns. However, the company has divested non-performing assets and has undertaken restructuring initiatives to improve its ROA.
Further, when we look at the company’s profitability against the sector, Cooper-Standard Holdings has always lagged behind the sector in profit, return metrics and cash generation.
Seeking Alpha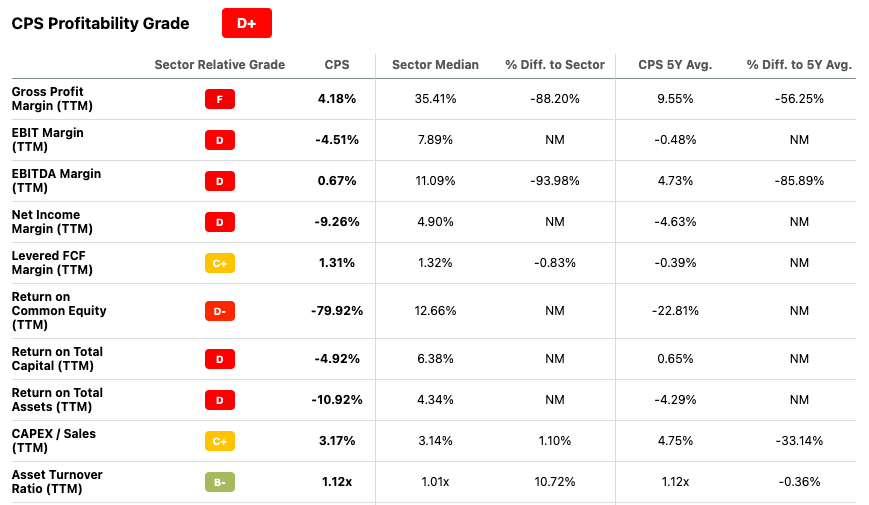
I did a comparable valuation benchmarking for the following companies using EV/EBITDA as an operating metric.
| Historical Valuation | Benchmark Companies | |||||
| EV/EBITDA multiples | MPAA | ETN | HLLY | GTES | CPS | |
| 2018 | 7.0x | 9.7x | NA | NA | 6.1x | |
| 2019 | 8.3x | 12.1x | NA | 9.7x | 3.7x | |
| 2020 | 20.2x | 21.1x | NA | 10.9x | 4.8x | |
| 2021 | 11.0x | 23.4x | NA | 14.1x | 539.5x | |
| 2022 | 11.4x | 19.0x | 13.9x | 9.8x | 29.5x | |
| Median | 11.0x | 19.0x | 13.9x | 10.4x | 6.1x | |
| Stock Price | 13.72 | 167.27 | 2.11 | 13.94 | 17.06 | |
| Shares Outstanding | 19.4 | 397.7 | 118.2 | 282.6 | 17.1 | |
| Share Exchange Ratio | 1.0 | 1.0 | 1.0 | 1.0 | 1.0 | |
| Liquid Long-term Investments | 0.0 | 1.0 | 1.0 | 0.0 | 1.0 | |
The financials of the companies are as follows:
Author Calculations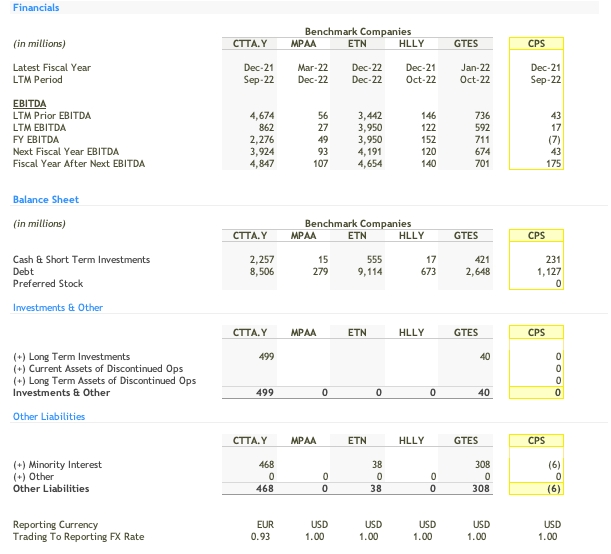
At LTM EBITDA multiple, Cooper-Standard holdings trade at 72.6x EV/EBITDA which is much higher than its peers.
At LTM EBITDA of $17 million, the company’s implied value is $8.46 per share, overpriced by 50%.
Author Calculations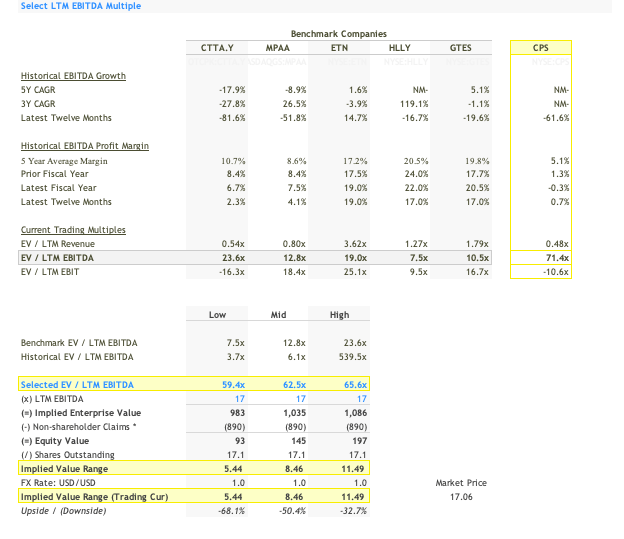
At the forward EBITDA of $175 million and 6.8x EV/Fwd.EBITDA, I get the company’s implied value at $17.96 per share. Then, i take the average of the implied value calculated using LTM EBITDA and forward EBITDA to arrive at the value of $13.21 per share.
Author Calculations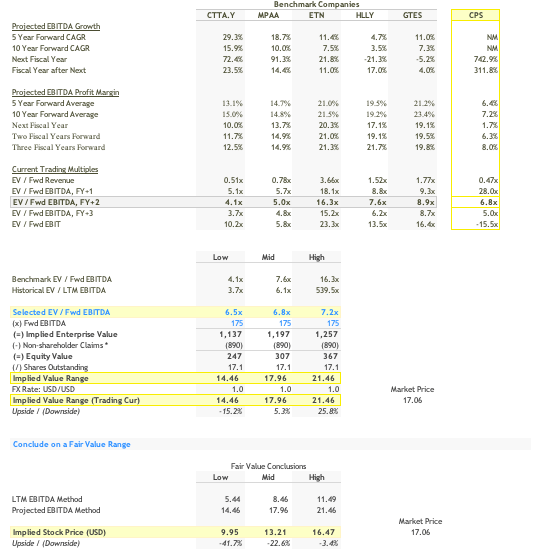
In my DCF calculation, I identify the following drivers that will have an impact on the equity value of the company:
- Revenue Growth
- Operating Margin
- Sales to Invested Capital
- Debt to Capital Ratio
First, I identify the cost of capital for the company by assuming the following:
The risk-free rate is the current ten-year US treasury bond rate of 3.65%.
The Equity risk premium (ERP) is 5.49%
At 67.75% debt-to-capital ratio and unlevered beta of 1.2, the levered beta for the company is 2.97.
At 21% pre-tax cost of debt and 30% marginal tax, the after tax-cost of debt is 14.76%.
I arrive at 19.96% as cost of equity, and 14.76% as cost of debt, giving 16.44% weighted average cost of capital.
Before starting my DCF valuation, i normalize the company’s EBIT from $-111 million to $88 million by averaging the last five years operating income. Further, I assume the company will grow at 14% in the next five years and 9.3% in the next ten years due to the company’s success in bagging projects in the Electric vehicles business.
The company has $89.9 million in R&D expenses. As R&D expenses give future economic benefits, i amortize the R&D expenses resulting in a decline in EBIT.
| Year | R& D Expenses | |||
| -1 | 89.96 | |||
| -2 | 101.61 | |||
| -3 | 114.85 | |||
| Output | ||||
| Year | R&D Expense | Unamortized portion | Amortization this year | |
| Current | 89.96 | 1.00 | 89.96 | |
| -1 | 89.96 | 0.67 | 59.97 | 29.99 |
| -2 | 101.61 | 0.33 | 33.87 | 33.87 |
| -3 | 114.85 | – | – | 38.28 |
| Value of Research Asset = | 183.80 | 102.14 | ||
| Amortization of asset for the current year = | 102.14 | |||
| Adjustment to Operating Income = | (12.18) | |||
| Tax Effect of R&D Expensing | (3.65) | |||
I assume the company’s EBIT margin will improve due to the recent restructuring initiatives and will converge to 12% in the next ten years.
I assume that the company’s asset efficiency will improve after divesting non-performing assets, and thus its Sales/Invested capital will improve to 2.5 in the next ten years.
At the current debt-to-capital ratio of 67.75%, I assume the company can reduce its leverage to the industry’s debt-to-capital ratio by the end of ten years. As the company reduces its leverage, its credit rating will improve from the current rating of D2 to BBB, resulting in a lower cost of debt, and lower beta, reducing the cost of equity. Thus, at the end of ten years, i assume that the company’s WACC will gradually decline from 16.44% to 9.7%.
Author Calculations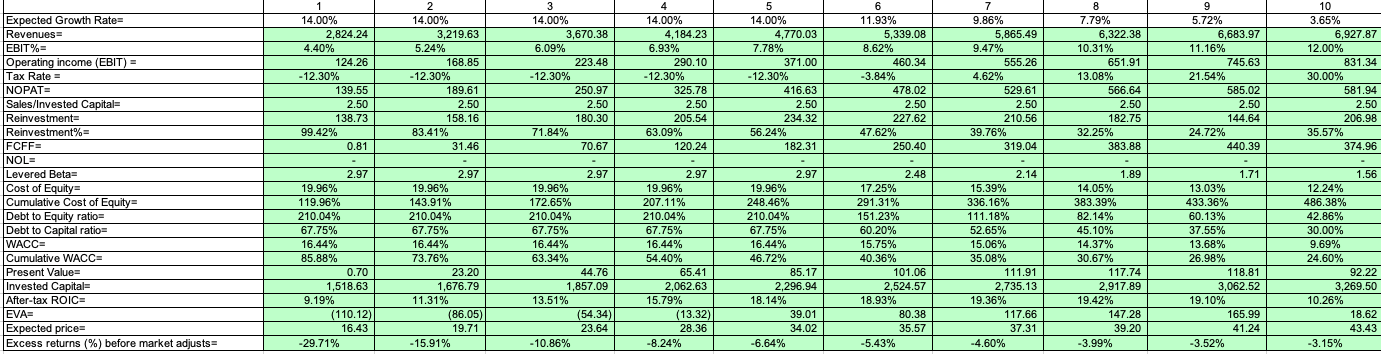
| Estimating the value of growth | Value/Share | ||
| Value of assets in place = | 375.04 | 21.92 | |
| Value of stable growth = | 284.48 | 16.63 | |
| Value of extraordinary growth = | 481.79 | 28.16 | |
| Value of the stock = | 1,141.31 | 66.71 |
At the end of ten years, i arrive at Enterprise Value of $1.14 billion at $66.7 per share.
By adding cash and subtracting debt and minority interests, the equity value is $234.2 million at $13.69 per share. The company is trading at $17.11 per share and, thus, in my view, is overvalued by 25%.
Thus, based on the Discounted Cash Flow analysis and valuing comparable companies benchmarking EV/EBITDA, I get the value per share of Cooper Standard holdings between $13.21 per share to $13.69 per share.
At the current price of $17.11, the company looks overvalued. Further, the company’s high debt burden and high-interest rate mean that most of the company’s earnings will go into paying the interest expenses, leaving little for shareholders as dividend payments or reinvesting into the company for future growth prospects.
Be the first to comment