

peterschreiber.media/iStock via Getty Images
We’re starting to get initial data on the war’s effect on economic data. Unsurprisingly, it’s negative:
Factories from Australia to Europe are seeing already surging costs jump further as Russia’s war in Ukraine and the barrage of sanctions rolled out in response roil commodity markets and trade.
While the relaxation of pandemic restrictions helped overall business activity weather the initial shock from the invasion, dwindling confidence is threatening economic growth in the coming months, according to March surveys of purchasing managers by S&P Global that offer a first glimpse at the conflict’s spillover effects.
Remember that confidence leads to economic activity; if management becomes more downbeat, it will spend less on items like expansions, new hires, and the like. At the macro level, this slows activity.
Let’s take a look at market breadth:
Nasdaq cumulative advance/decline (Stockcharts)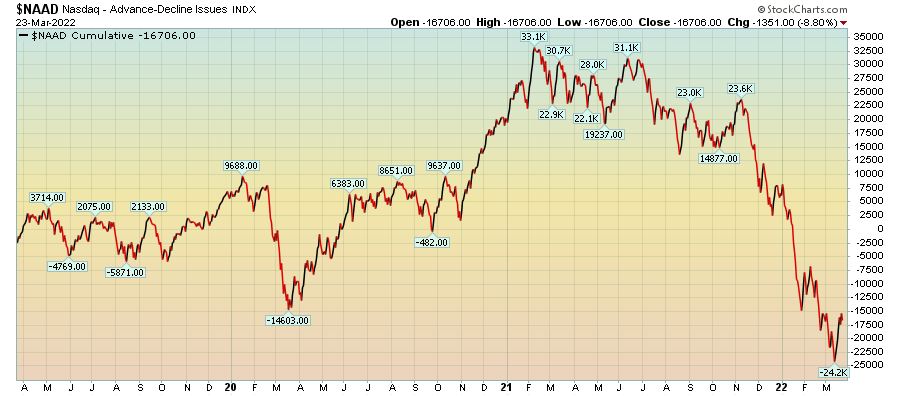
Nasdaq’s cumulative advance/decline line is now below its level from the lockdowns. The rate of decline started to accelerate in 4Q21.
NYSE advance/decline line (Stockcharts)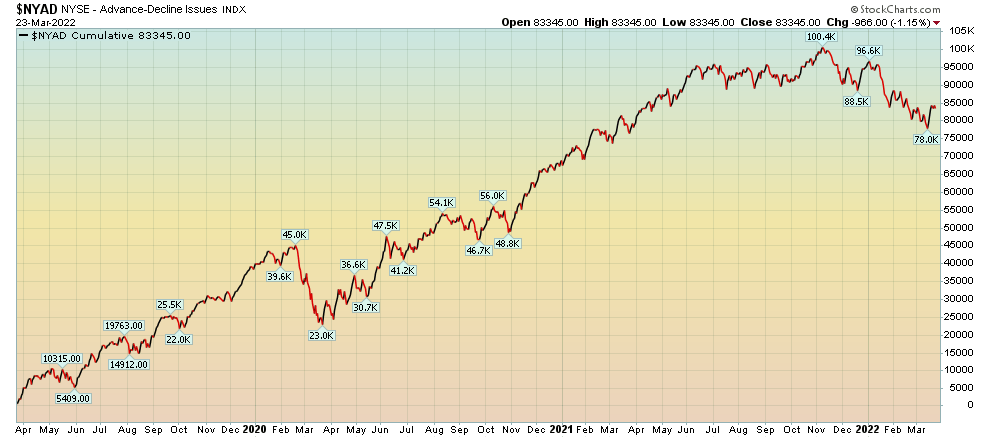
In contrast, is the drop in the NYSE advance/decline line. The drop started in 1Q22 and is far less severe.
Is the US economy at an “inflection point?”
It is possible that “the massive fiscal and monetary intervention in response to Covid-19 has moved the economy to a higher-pressure, higher-inflation equilibrium, with people earning more and spending more than before,” Neel Kashkari, president of the Minneapolis Fed, wrote in a recent essay.
…
Some of the changes are noticeable in everyday life: Work from home is more popular, burrito bowls and road trips cost more, and buying a car or a couch made overseas is harder.
But those are all symptoms of broader changes sweeping the economy — ones that could be a big deal for consumers, businesses and policymakers alike if they linger. Consumer demand has been hot for months now, workers are desperately wanted, wages are climbing at a rapid clip, and prices are rising at the fastest pace in four decades as vigorous buying clashes with roiled supply chains. Interest rates are expected to rise higher than they ever did in the 2010s as the Federal Reserve tries to rein in inflation.
…
Forecasters predicted that rapid inflation would fade in 2021, only to have those expectations foiled as it accelerated instead. They thought workers would jump back into the labor market as schools reopened from pandemic shutdowns, but many remain on its sidelines. And they thought consumer spending would taper off as government pandemic relief checks faded into the rearview mirror. Shoppers have kept at it.
Food for thought.
Today, let’s look at two sets of charts.
3-month charts for the SPY, QQQ, DIA, and IWM. (Stockcharts)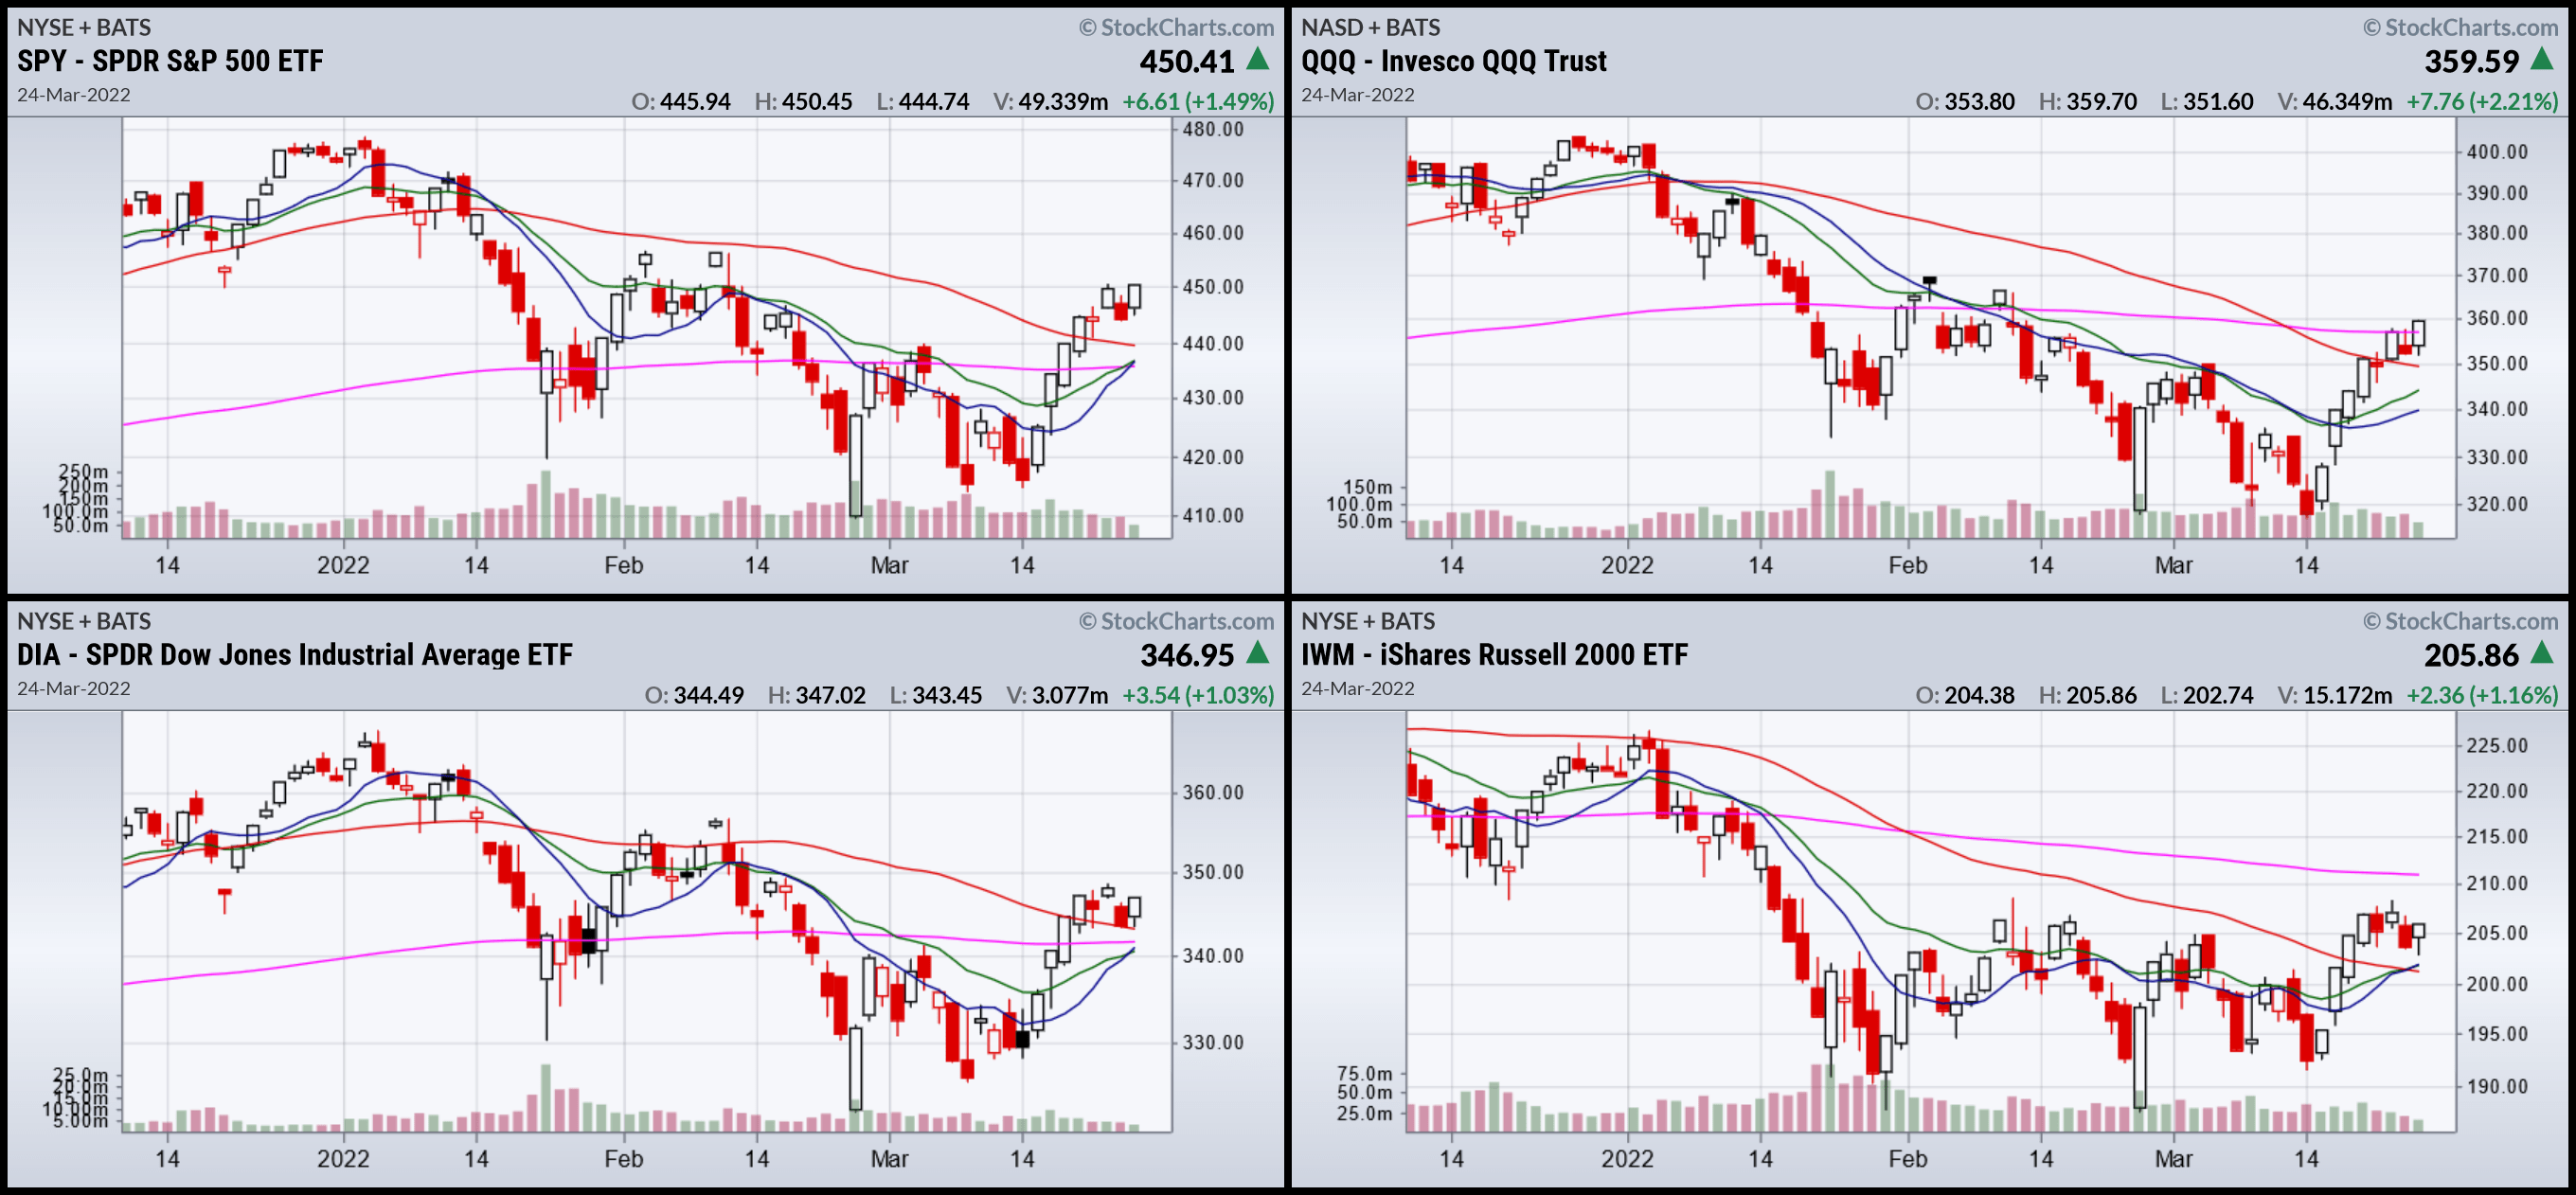
The markets continue to make progress. During the last 3-5 trading sessions, prices have trended sideways, consolidating gains. The QQQ has made a tentative advance through the 200-day EMA, although it’s a small move still.
2-week SPY, QQQ, DIA, and IWM charts (Stockcharts)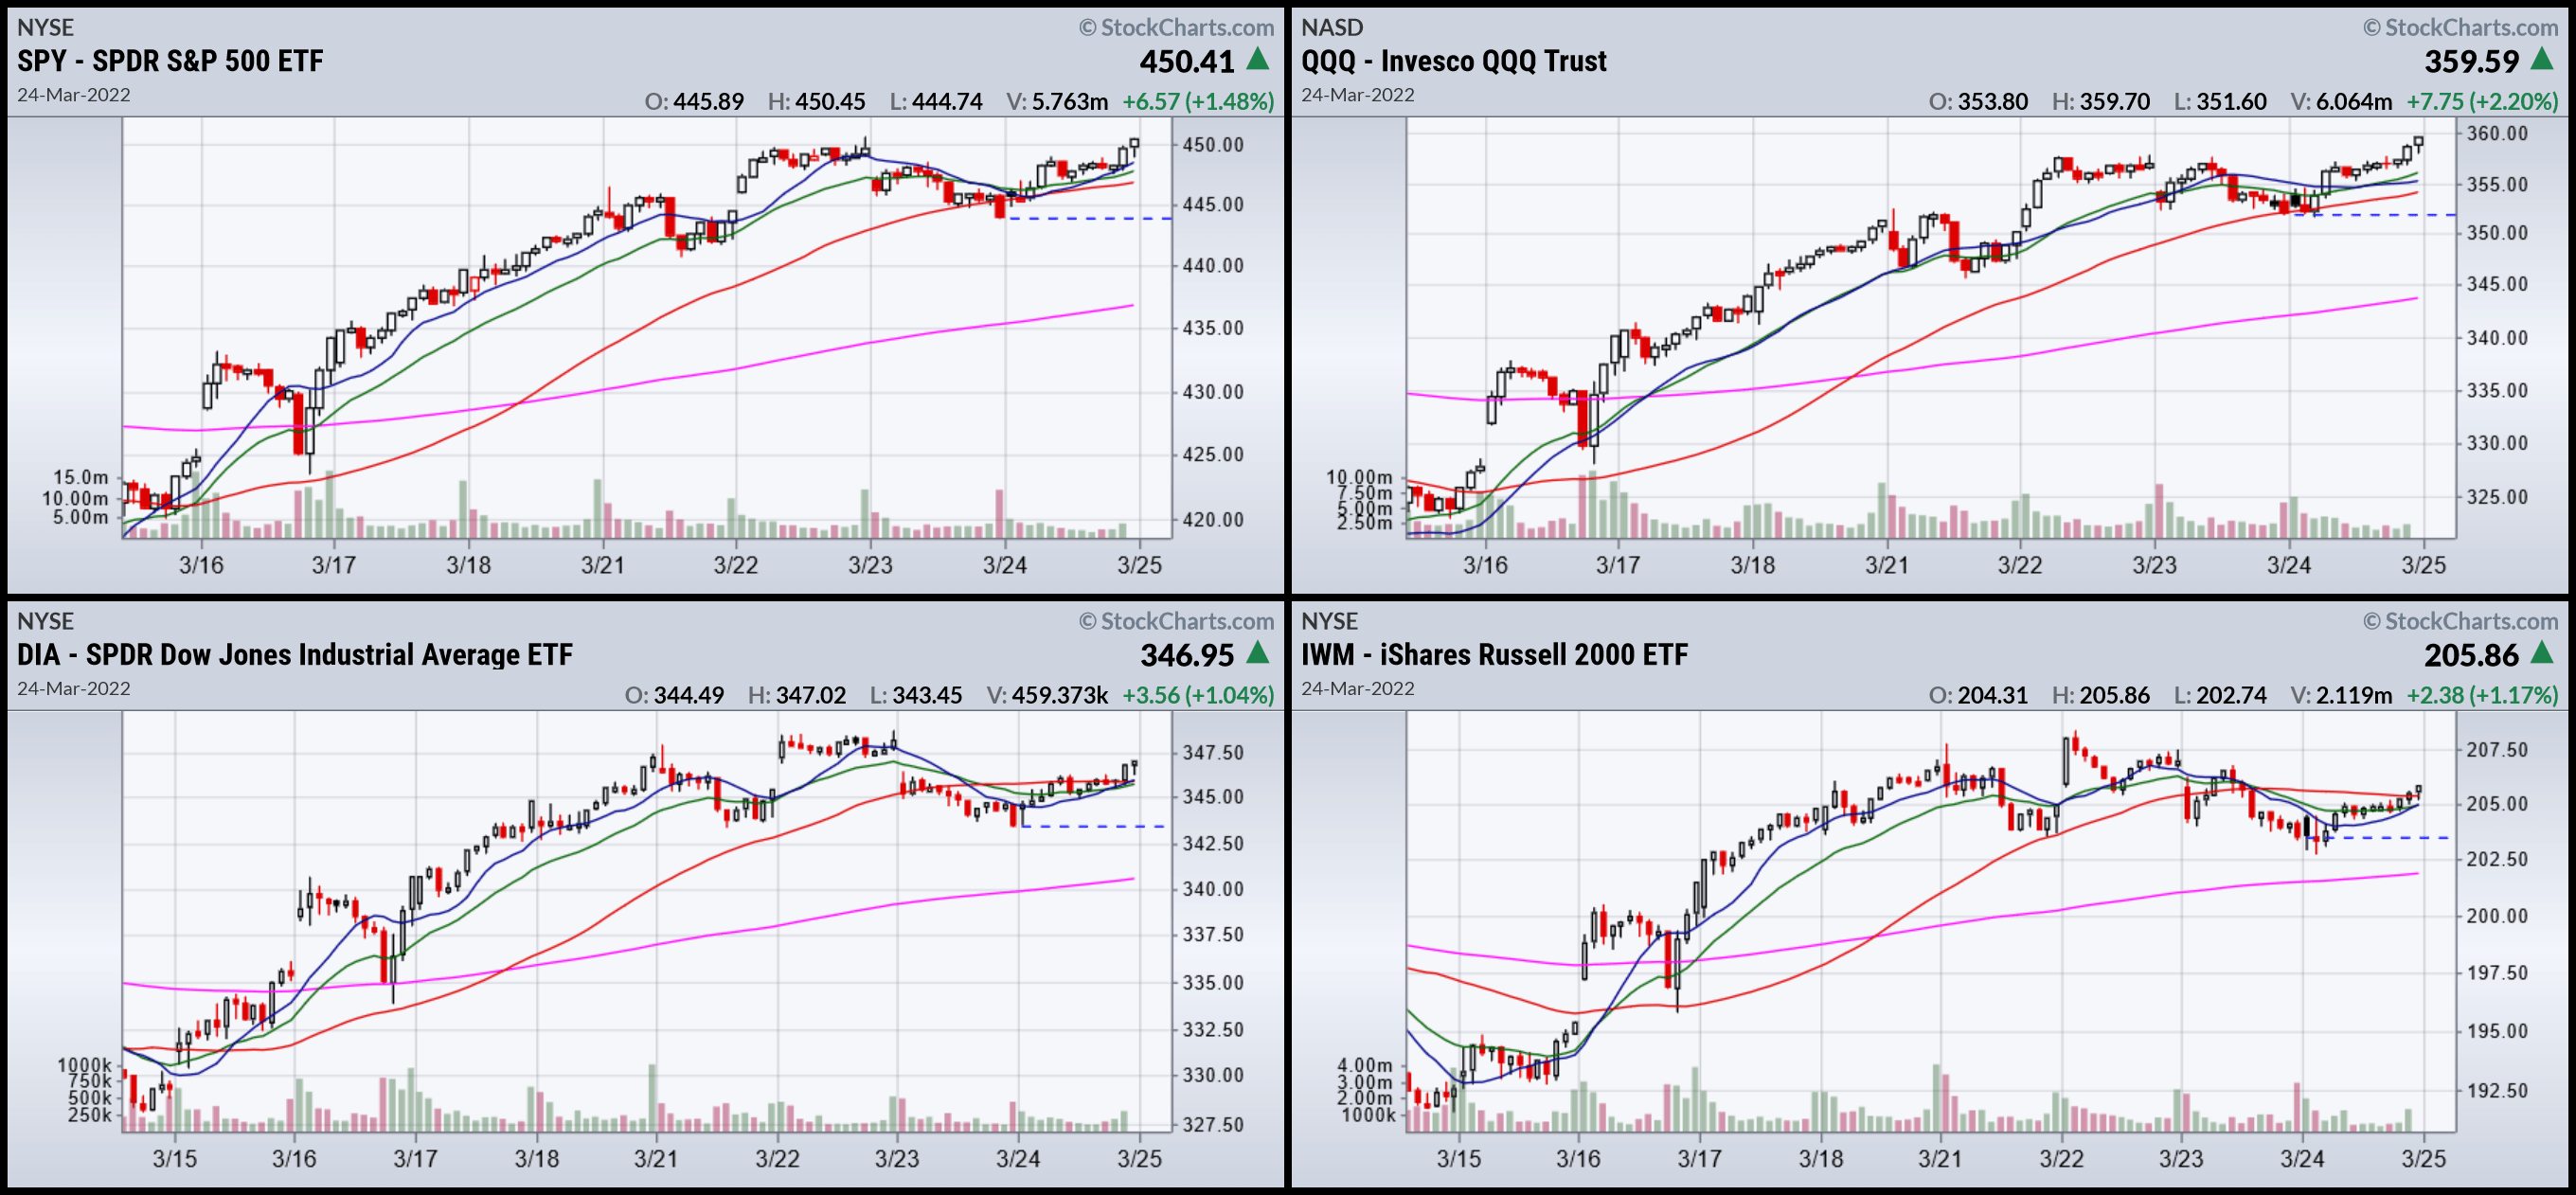
The 2-week charts add additional detail, showing that the consolidation is very steady. The QQQ chart is especially positive as it closed at a 5-day high.
Overall, the short-term trends are positive. The big issue is will this continue in a rate-hiking environment.
I’ll be back over the weekend with my weekly market wrap.
Be the first to comment