

Commodities and Inflation Ibrahim Akcengiz
Introduction
2022 has been a good year for commodities. I have analyzed broad commodity ETFs like Invesco DB Commodity Index Tracking ETF (DBC) here, industrial base metals via Invesco DB Base Metals ETF (DBB) here, as well as midstream O&G players InfraCap MLP ETF (AMZA), O&G services VanEck Vectors Oil Services ETF (OIH) and a drilling company NOV Inc. (NOV). In this article, I look at another broad commodity ETF: iShares Commodities Select Strategy ETF (NASDAQ:COMT).
What’s the Move for COMT?
The iShares Commodities Select Strategy ETF tracks a wide range of assets with a major focus on the energy, metals, and agriculture industries. How is this different from DBC, which I’ve also analyzed? COMT’s mix gives you a bit more exposure to crude oil and a bit less exposure to agricultural commodities. Here’s what the detail in the exposures looks like:
COMT ETF Composition
COMT ETF Futures Exposure (COMT ETF Website, Author’s Analysis)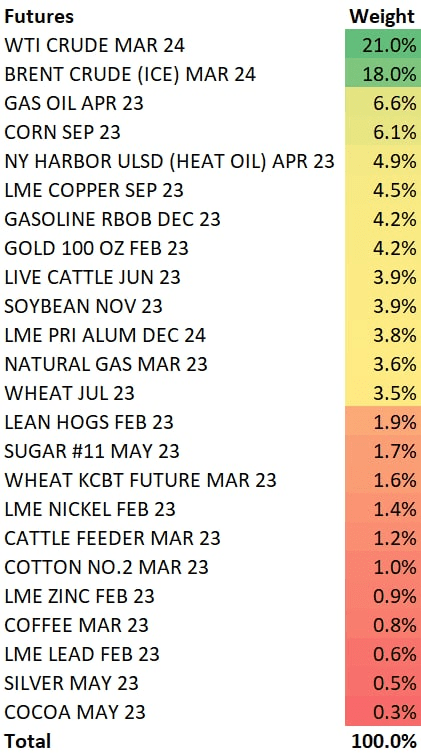
The COMT ETF (exchange-traded fund) consists of energy, metals, and agricultural commodities. The exposure to crude oil is noteworthily high, as that makes up more than 45% of the overall weight.
Winter is Not Yet Over in the EU
Like Neo in the Matrix, the EU barely dodged the recession bullet after getting away with posting 0.2% economic growth in the third quarter of 2022, beating economists’ expectations. However, the EU still faces global uncertainty, high inflation, and the war going on in its backyard. These will pinch hard this winter and potentially cause stagflation.
The stagflation risk is real. Due to the ongoing energy crisis led by geopolitical disruptions, Europe is finding it harder and more expensive to pay to keep homes heated. Although Europeans have survived the first cold spell, more challenges lie ahead. Speaking of energy crisis, here’s what my outlook on energy looks like:
The Energy Problem Is Bigger Than Anticipated
The International Energy Agency (“IEA”) released its outlook on energy in late October 2022, saying that the Russia-Ukraine war will leave a mark on the energy sector, especially the supply side, for years to come. Taking an excerpt from its International Energy Outlook (IEO) report:
…the world is facing its first “truly global energy crisis.”
For context, the commentary suggests a much larger impact on energy markets this time around than was seen in the oil price hikes in the early 2000s, when there was strong demand from emerging markets (particularly China) and slowdowns in supply with U.S.-Middle East tensions.
Fundamental Outlook
Overall, I believe the fundamentals suggest potential for a continued rally in O&G and, by extension (since O&G derived energy is a key input cost for other industries), other commodities too.
But is this the right time to place in buys on COMT? That’s what technical analysis helps me decide:
If this is your first time reading a Hunting Alpha article using technical analysis, you may want to read this post, which explains how and why I read the charts the way I do, utilizing the principles of Flow, Location, and Trap.
Read of Relative Money Flow
COMT vs. SPX500 Technical Analysis (TradingView, Author’s Analysis)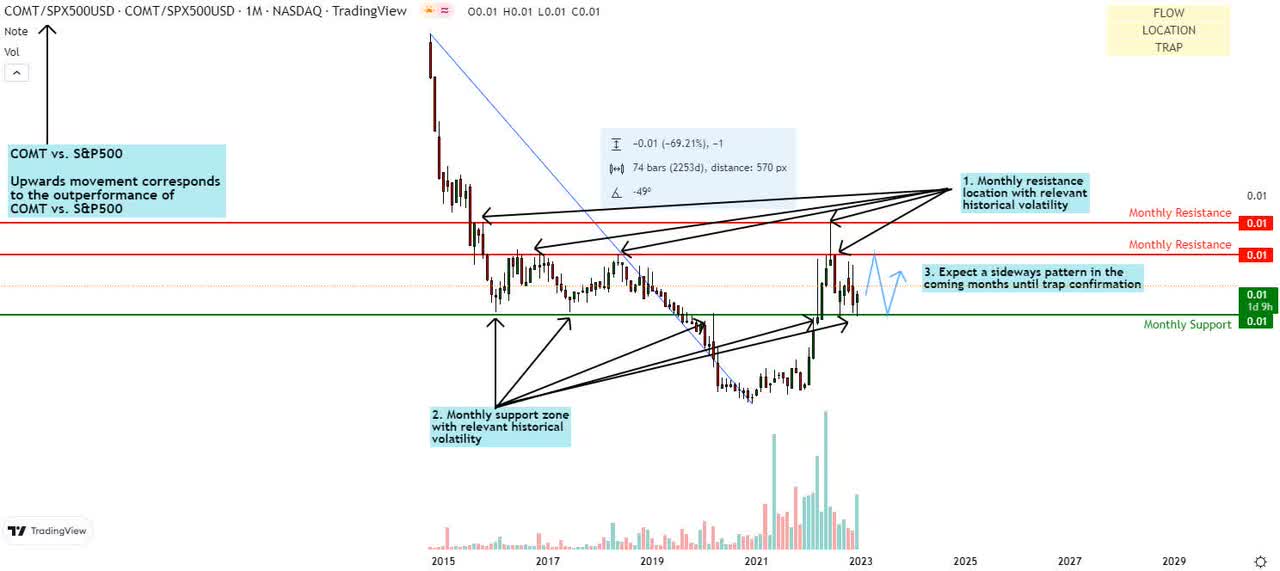
The COMT vs SPX500 (SPX) chart shows that the ETF is showing signs of falling into a sideways pattern after facing strong rejections from the monthly support and the lower resistance level. This comes after the pair recorded a surge of bullish movement to 7-year highs between February 2022 and June 2022.
Historically, the current range between the lower monthly resistance and the monthly support has been known to foment price restrictions since the inception of the COMT/S&P500 trading pair. As such, there’s a good chance that prices could range for a little longer.
Read of Absolute Money Flow
COMT Technical Analysis (TradingView, Author’s Analysis)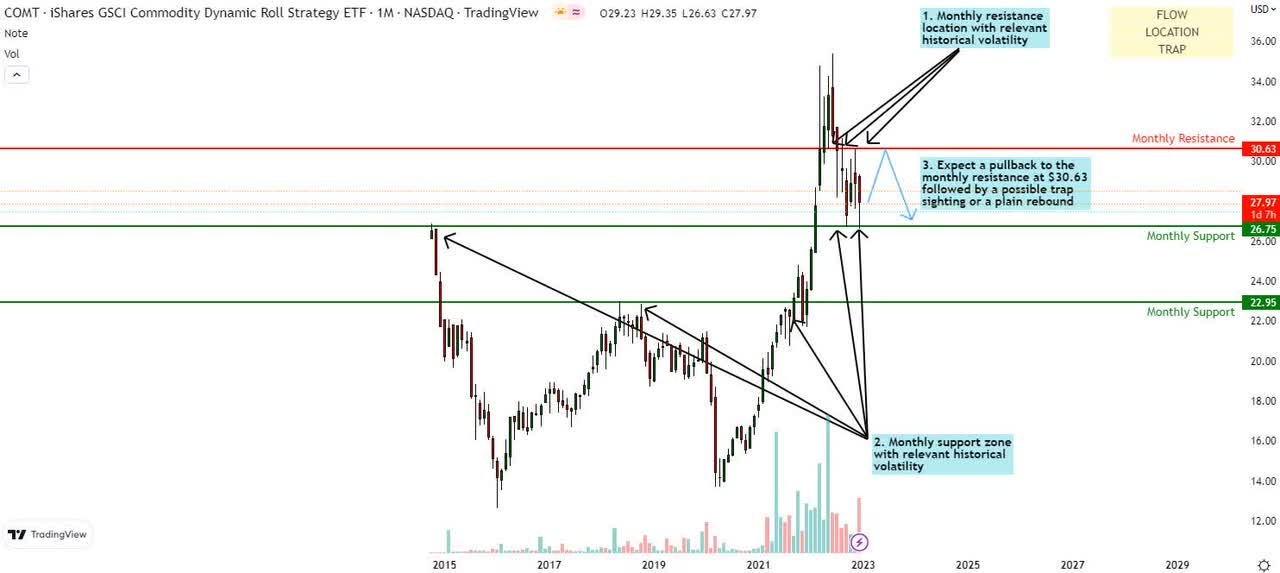
On the standalone COMT ETF monthly chart, the price also appears to be in a range-bound zone. After peaking at the $35.37 mark in June 2022, the COMT ETF rapidly descended to the $26.75 monthly support and has fallen into a pass-and-play mode between the $30.63 resistance and $26.75 support.
The persistent rejection from the $26.75 support level is understandable considering that level marks the ETF’s inception point and thus holds important significance to the price dynamics of COMT.
Technical Outlook
Overall, technical analysis suggest some rangebound action is likely to occur over the next few months. This leads me to have a ‘hold’ stance on COMT.
Summary
If the IEA’s assessment of the situation is accurate, then we could witness a steady surge in the prices of energy and other commodities over the coming months, giving the iShares Commodities Select Strategy ETF a nice tailwind. The chart read is not quite suggesting a buy yet, though. Therefore, I am on the sidelines for iShares Commodities Select Strategy ETF, and watching for the right triggers to enter.
Be the first to comment