

hallojulie
This analysis focuses on gold and silver within the Comex/CME futures exchange. See the article What is the Comex? for more detail. The charts and tables below specifically analyze the physical stock/inventory data at the Comex to show the physical movement of metal into and out of Comex vaults.
Registered = Warrant assigned and can be used for Comex delivery, Eligible = No warrant attached – owner has not made it available for delivery.
Current Trends
Gold
Gold saw a very modest increase of Registered metal in December of 45K but all that metal has since left and then some with January seeing Registered fall by 265K. Gold now has 9 consecutive months of metal leaving the vaults on a net basis.
Figure: 1 Recent Monthly Stock Change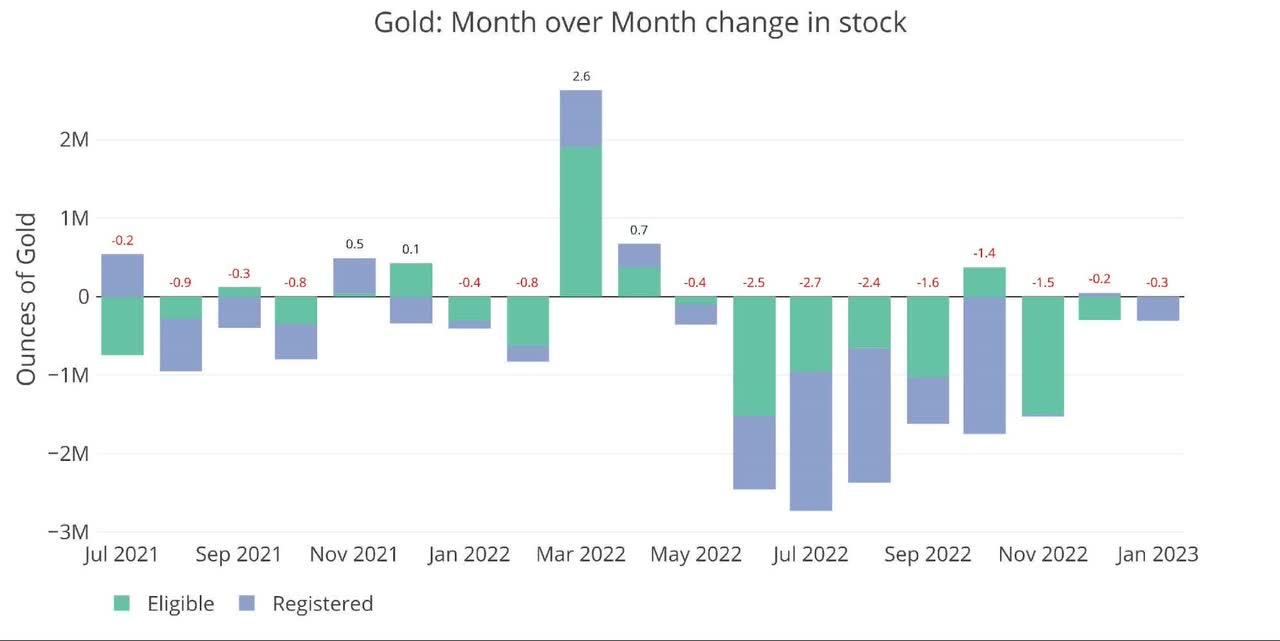
Despite the somewhat slower pace of outflows, there is no question metal is still moving out. The chart below shows the daily activity which has grown quiet, especially in the last week as the market prepares for the February delivery to begin. More on that next week.
Figure: 2 Recent Monthly Stock Change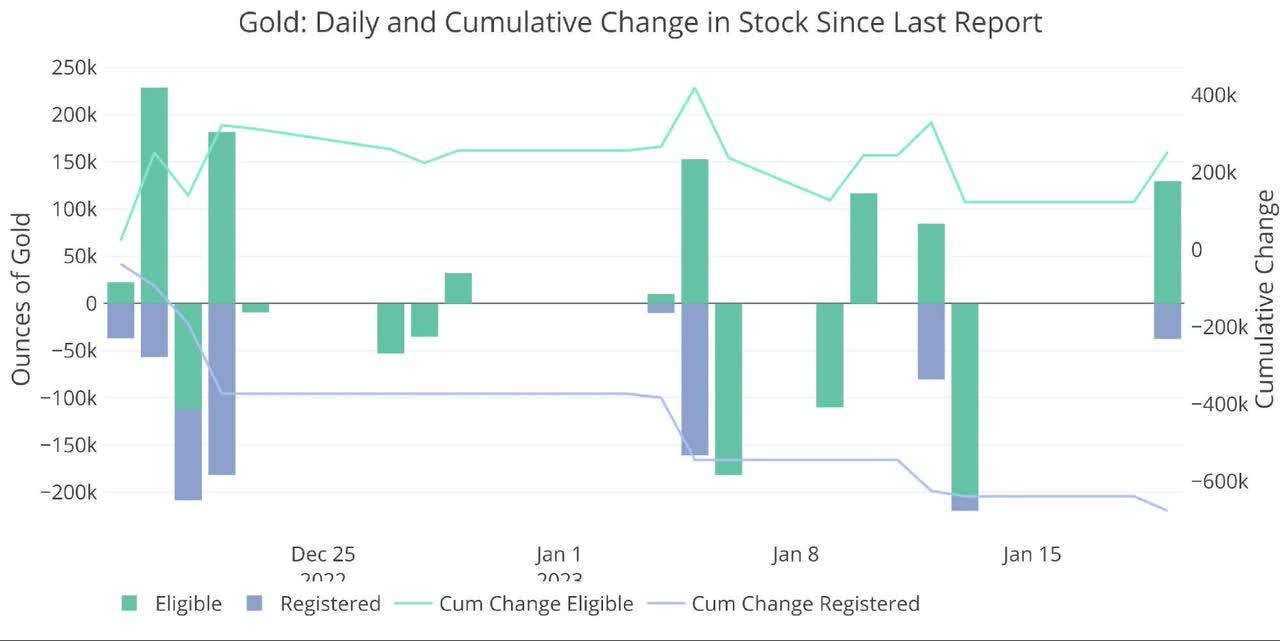
Pledged gold has also started falling again after a recent uptick in December.
Figure: 3 Gold Pledged Holdings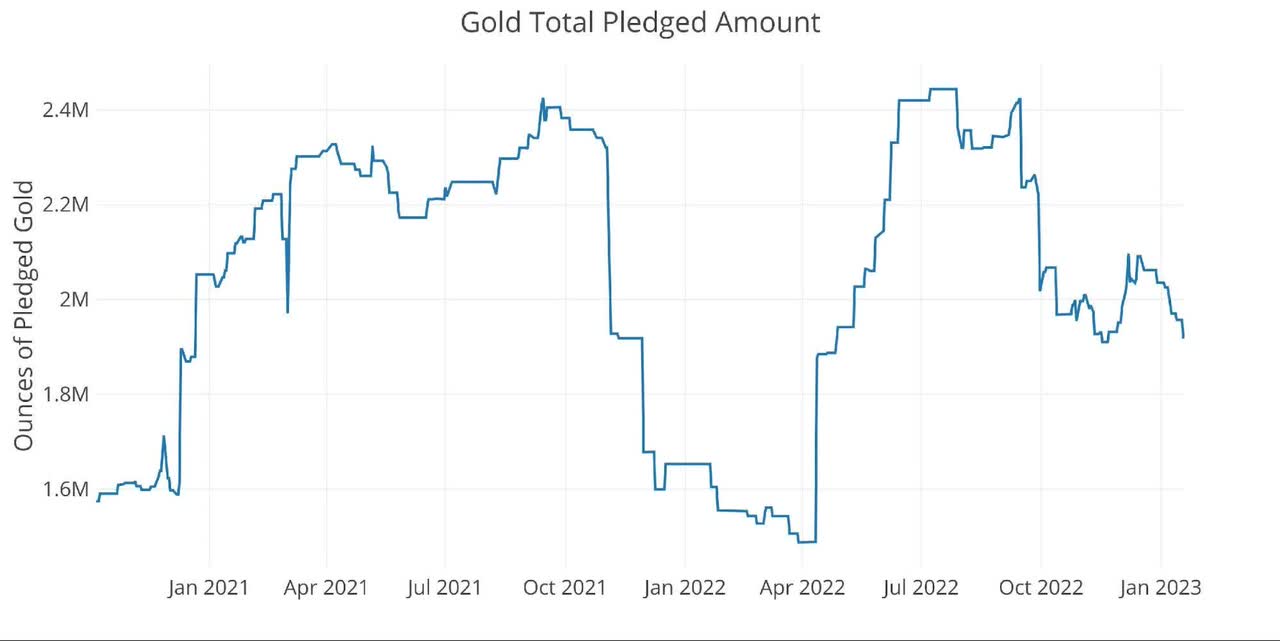
Silver
Silver did complete the month of December with a slight net gain in both Registered and Eligible. Similar to gold, those gains have since reversed by more than double (1.5M in for December vs 3.7M out for January so far).
Figure: 4 Recent Monthly Stock Change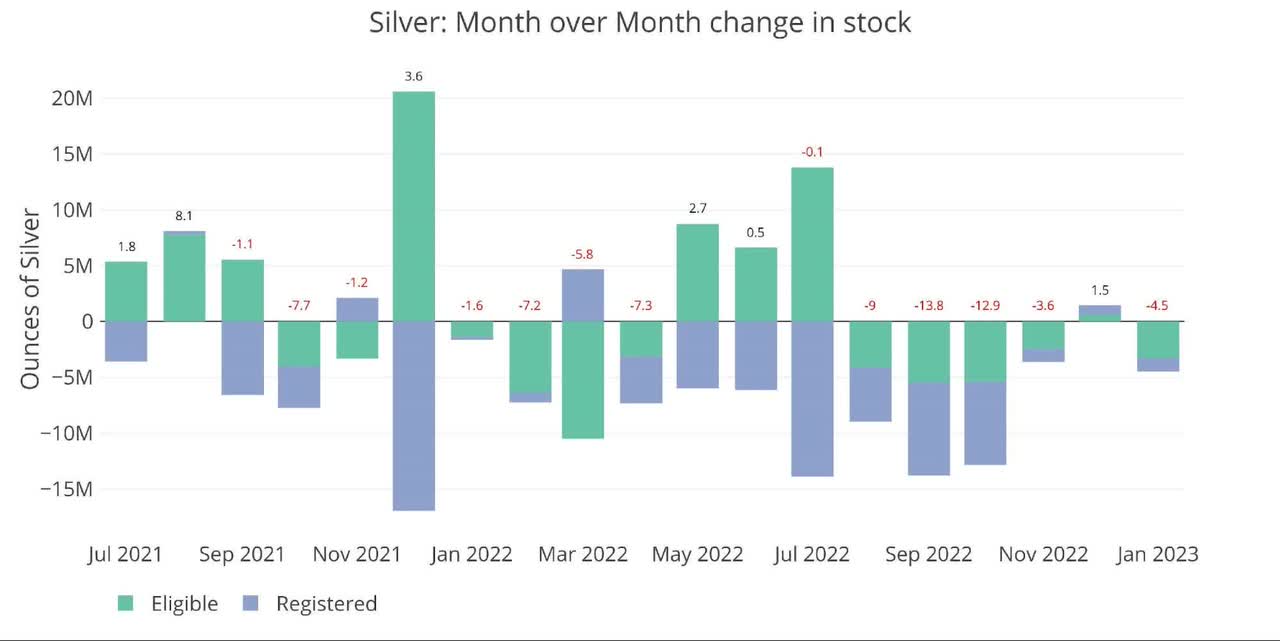
The daily activity in silver has been far busier than it has been in gold. While we are not seeing the massive outflows seen in last fall, January is still seeing metal moving out of the vault.
Figure: 5 Recent Monthly Stock Change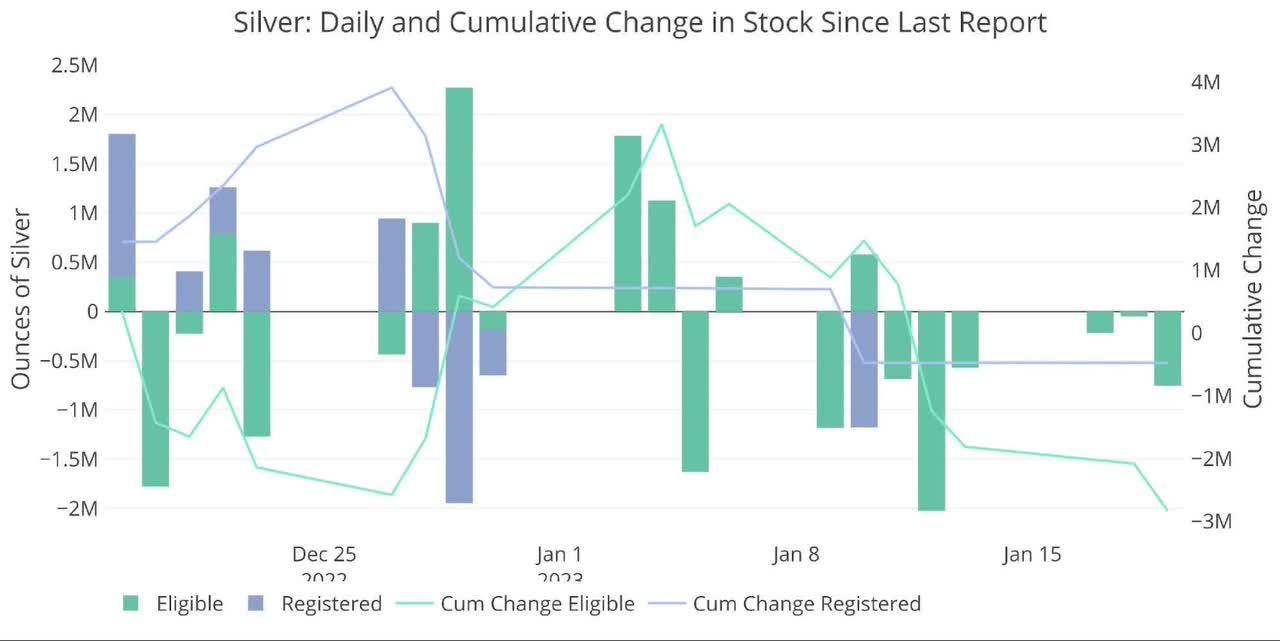
The table below summarizes the movement activity over several time periods to better demonstrate the magnitude of the current move.
Gold
- Over the last month, gold has seen a net inventory decrease of 1.8%
- This was driven by 675K ounces leaving Registered
- Since last year, total gold holdings have fallen by 32% or 10.7M ounces
Silver
- Silver saw a modest decline in Registered of 476K ounces over the last 30 days
- Eligible took a beating, dropping 3.3M ounces
- Almost half of that came in the last week alone (1.6M ounces)
Palladium/Platinum
Palladium and platinum are much smaller markets but it’s possible that is where the market breaks first.
- Palladium saw a slight fall of 5k ounces
- Platinum saw a massive surge in inventory after the contracts standing for delivery exceeded total available supply
- While Platinum supplies are still down 48% over the last year, the major restocking this month held up the Platinum market (for now)
Without the restocking in platinum, the Comex could have defaulted on its obligations to deliver all the physical metal being demanded. Unfortunately for the Comex, they have merely bought themselves time until the April contract rolls around.
Figure: 6 Stock Change Summary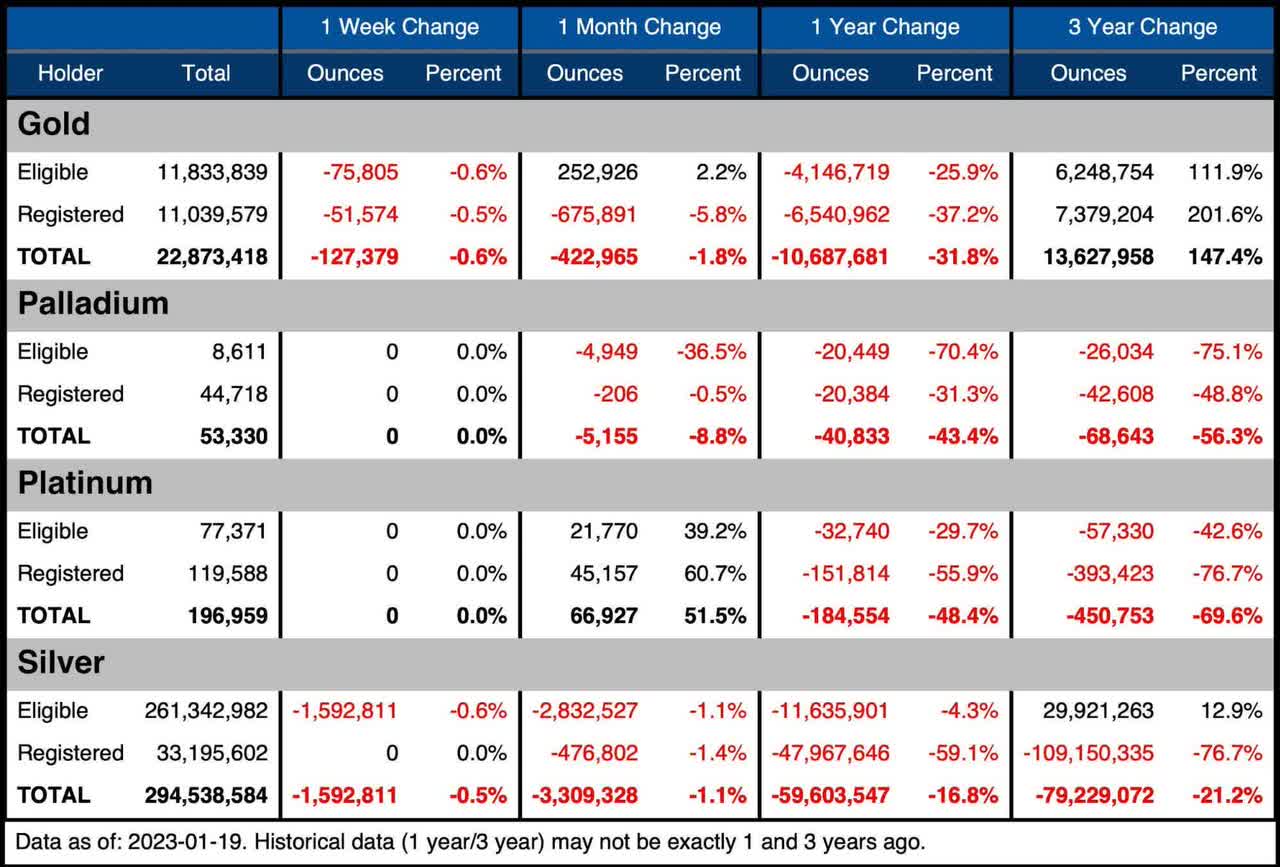
The next table shows the activity by bank/Holder. It details the numbers above to see the movement specific to vaults.
Gold
-
- The vault movements were a bit quieter this past month, but the outflows were spread
- Manfra had added last month but gave it up this month with a net fall of 7.2%
- JPMorgan continues to bleed ounces, down 350k (3.8%) for the month and 4M ounces (31%) over the last year
- Every vault has lost inventory over the last year
Silver
-
- Silver saw a lot of shuffling between vaults
- CNT and Manfra were the big losers seeing 5.3M and 1.6M in outflows respectively (-18% and -11%)
- JPMorgan and Loomis each added over 1.7M ounces
Figure: 7 Stock Change Detail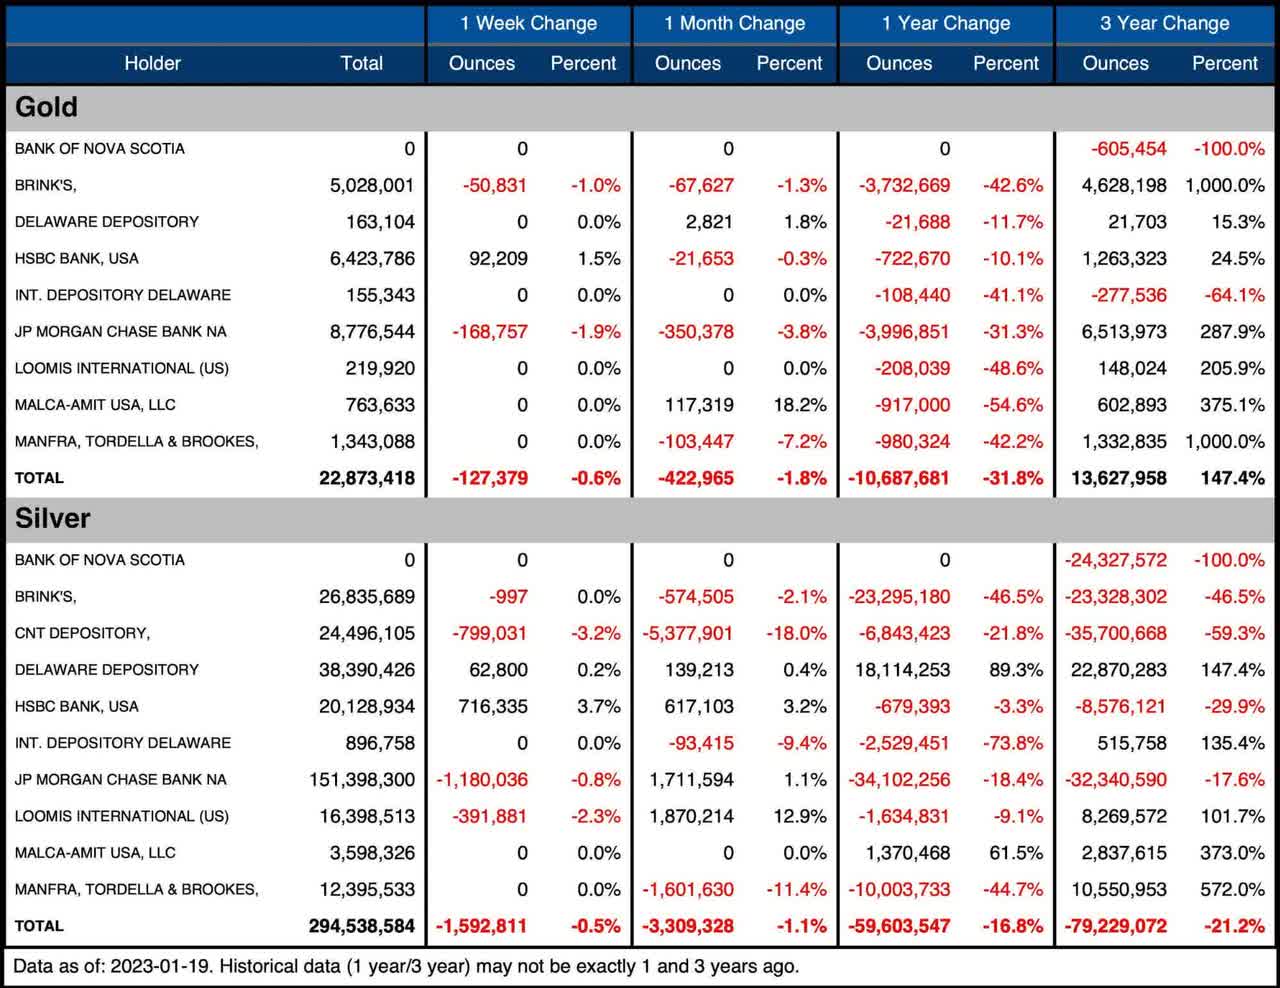
Historical Perspective
Zooming out and looking at the inventory for gold and silver shows just how massive the current move has been. The black line shows Registered as a percent of total. Inventories have been falling evenly in both categories which is why the black line has stayed relatively stable even while supplies have been crashing.
Registered had really taken a hit into October, falling to 45% of the total before rebounding back to 50% in preparation for the December delivery. With the February contract on deck, Registered has fallen back below 49%.
Figure: 8 Historical Eligible and Registered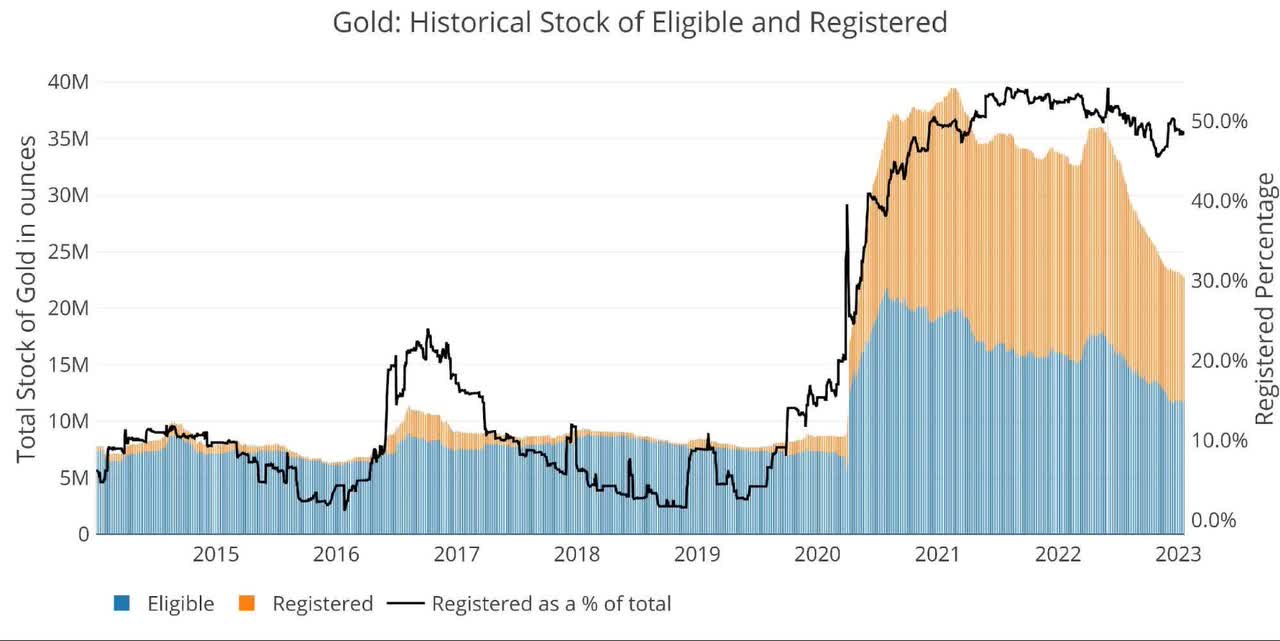
Registered silver continues to sit at multi-decade lows. There simply is not enough metal available in the vaults. Registered now makes up 11.2% of total available metal. This is down from 28% in December 2021 and 40% in September 2020. Registered is the metal available to satisfy delivery demand. As the run on Comex vaults intensified in 2022, there was little that could be done to replenish depleted inventories.
Figure: 9 Historical Eligible and Registered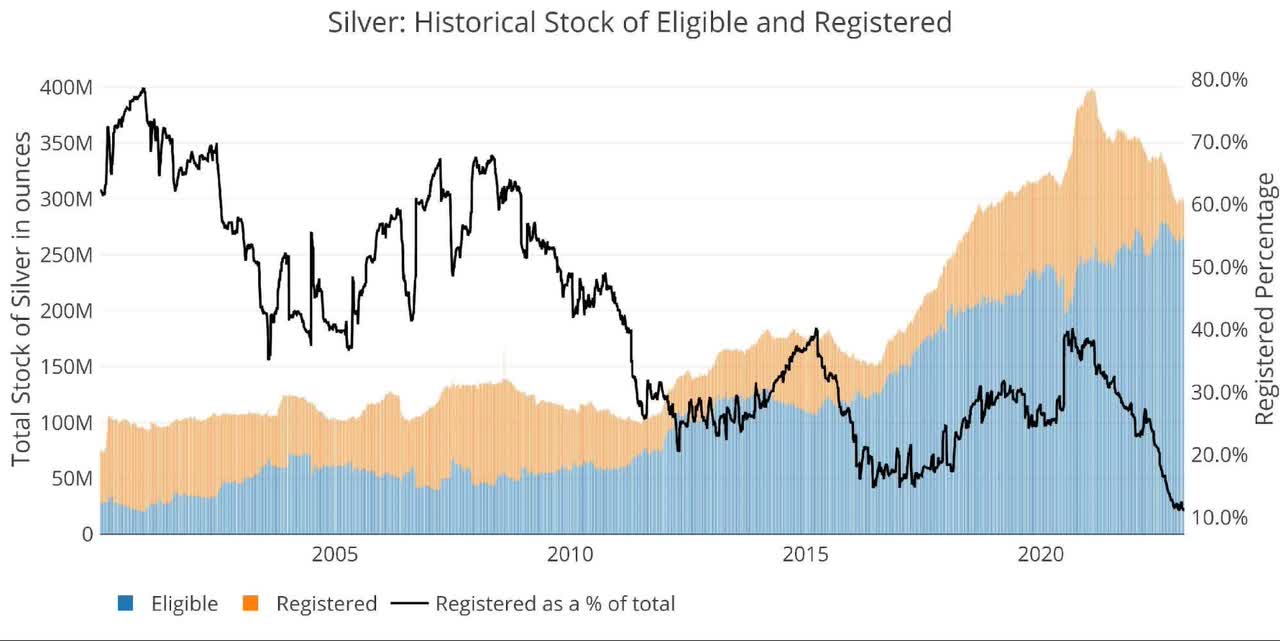
The chart below focuses just on Registered to show the steepness of the current fall. In Feb 2021, Registered surged to as high as 152M ounces. That number now sits around 33.2M. Over the past few months, Registered supplies have been bumping against 33M ounces pretty hard. A bit of metal will come into Registered and then immediately depart. It’s possible that 30M ounces is really the floor instead of 0.
Figure: 10 Historical Registered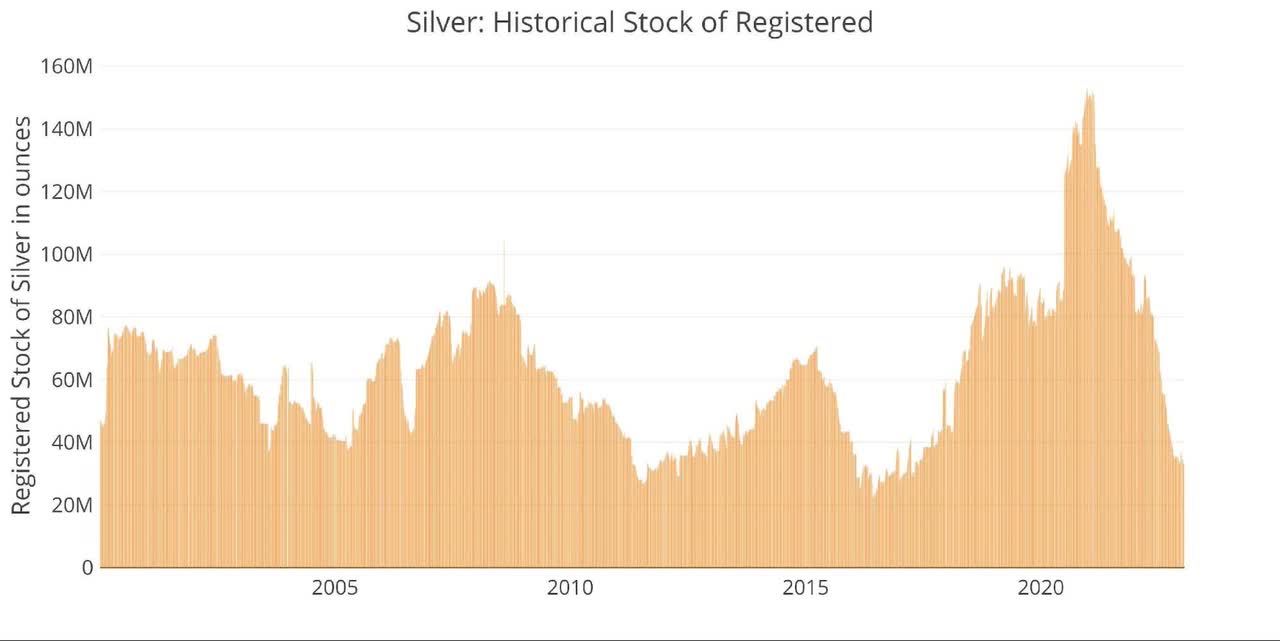
Comex is not the only vault seeing big moves out of silver. Below shows the LBMA holdings of silver. It should be noted that much of the holdings shown below are allocated to ETFs. Regardless, total inventories have fallen quite significantly. December was the first increase in over a year and it was very modest at about 550K ounces.
Figure: 11 LBMA Holdings of Silver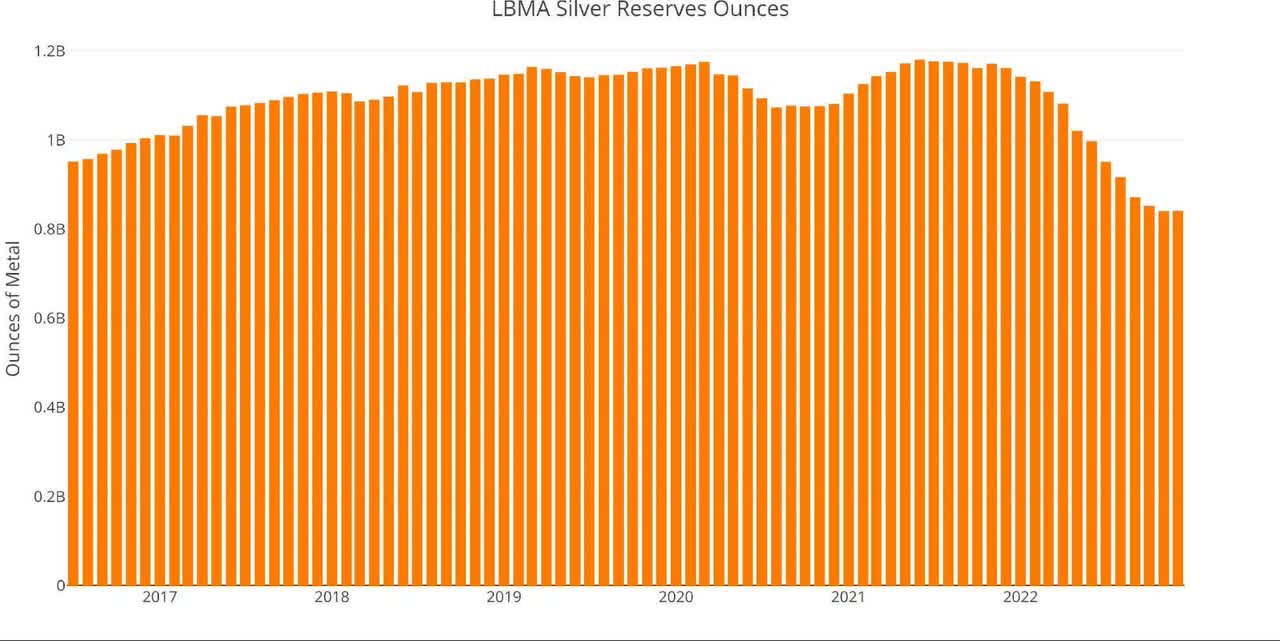
Available supply for potential demand
These falls in inventory have had a major impact on the coverage of Comex against the paper contracts held. There are now 4.4 paper contracts for each ounce of Registered gold within the Comex vaults. This is up from the low of 3.6 paper contracts in December. This has been driven by both a surge in open interest from 424K to 491K along with the drop in supplies noted above.
Figure: 12 Open Interest/Stock Ratio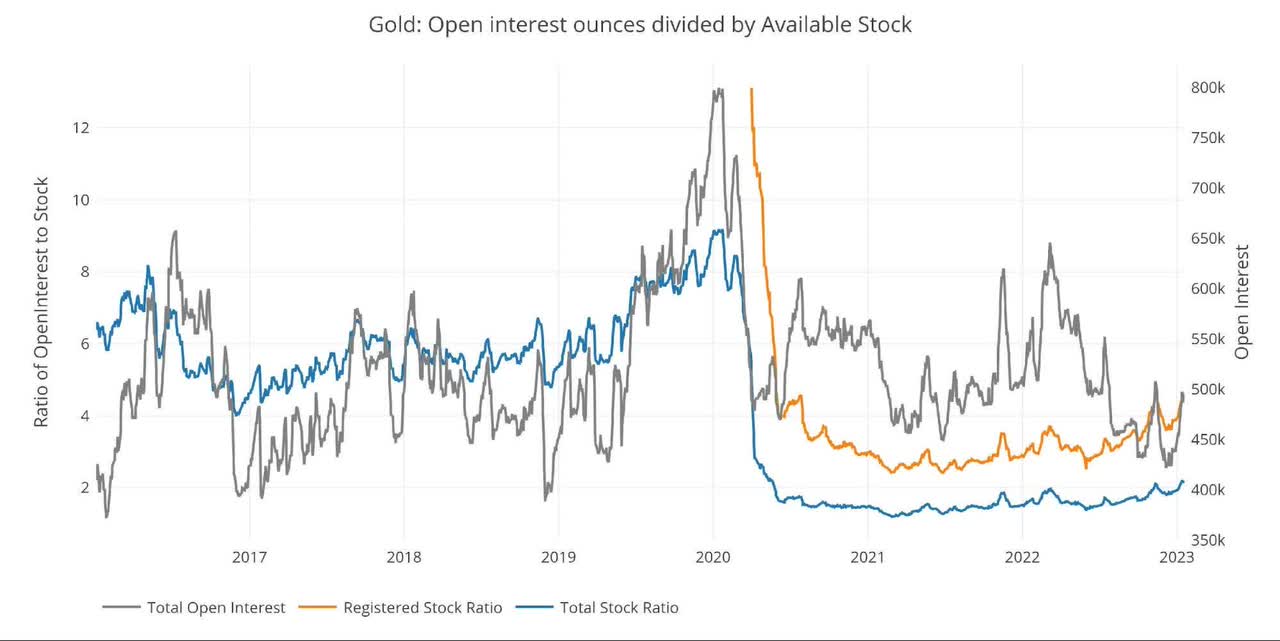
Coverage in silver is far worse than gold with 20 paper contracts for each ounce of Registered silver. This is up big from the 17 paper to physical ratio seen back in December. Essentially, if less than 5% of silver open interest stood for delivery, it would wipe out silver Registered. This is a dangerous game of chicken being played!
Figure: 13 Open Interest/Stock Ratio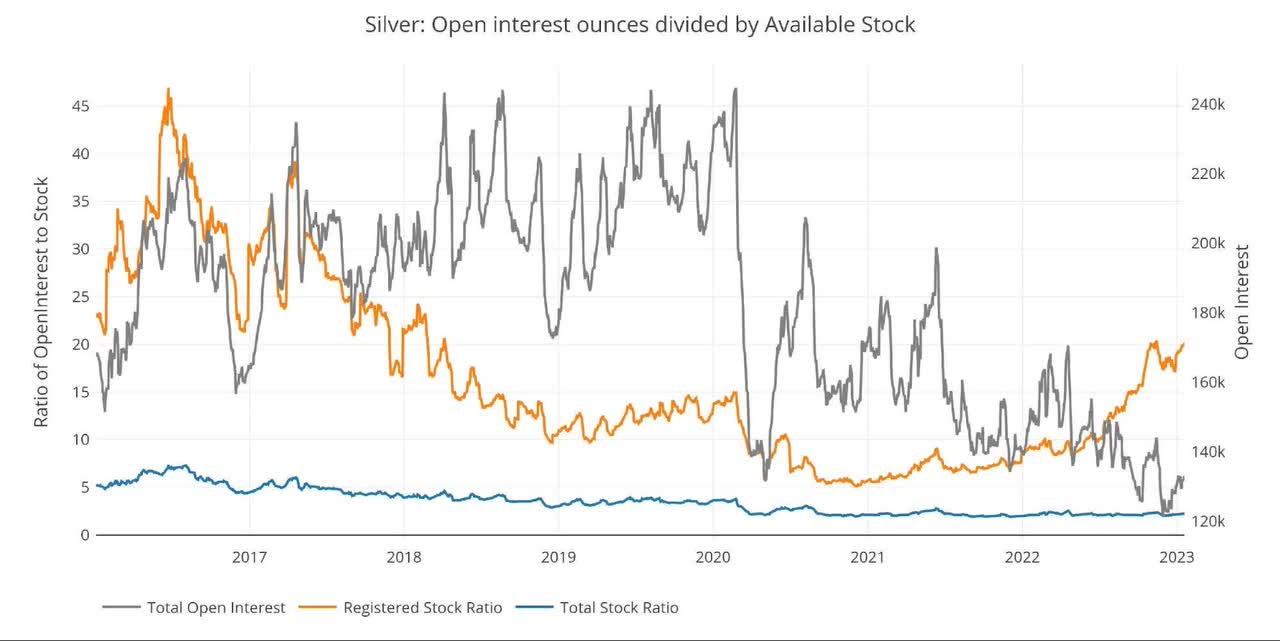
Wrapping Up
The run on Comex vaults continues even if supplies are not being depleted at the same pace they were in the middle of 2022. What happened in the platinum market is an early indication of what is to come in silver and then gold. Platinum saw more contracts stand for delivery than was available in Registered. The Comex responded by cash-settling a record amount of contracts and scrambling to restock supplies as quickly as they could.
The same activity is playing out in silver as supplies continue to fall. If silver sees even one big month of delivery volume, it could set things in motion. The last domino to fall will be gold. This progression makes sense as the smaller markets always break first. If the Comex market breaks, then the price of gold could become unhinged.
Paper supply has helped suppress the price for decades. If the confidence in paper gold evaporates, then the premium on physical could reach record levels quickly. Better to get physical metal before this happens.
Data Source: Futures & Options Trading for Risk Management – CME Group
Data Updated: Daily around 3 PM Eastern
Last Updated: Jan 19, 2023
Gold and Silver interactive charts and graphs can always be found on the Exploring Finance dashboard: Gold and Silver Analysis
Editor’s Note: The summary bullets for this article were chosen by Seeking Alpha editors.
Be the first to comment