

omersukrugoksu/iStock via Getty Images
Both the margin expansion and loan growth of Coastal Financial Corporation (NASDAQ:CCB) will likely slow down in 2023 compared to last year. Nevertheless, the topline growth will remain positive and lead to a surge in the bottom line. Overall, I’m expecting Coastal Financial Corporation to report earnings of $4.21 per share for 2023, up 40% year-over-year. The year-end target price suggests a moderately-high upside from the current market price. Therefore, I’m adopting a buy rating on Coastal Financial Corporation.
Remarkable Margin Expansion To Lose Steam
Coastal Financial’s net interest margin surged by 38 basis points in the last quarter of 2022 after an even more impressive growth of 92 basis points in the third quarter and 121 basis points in the second quarter of the year. The margin cannot be expected to continue to expand at the same pace in the future because of shifts in the balance sheet positioning.
Coastal Financial Corporation’s deposit mix has significantly deteriorated over the last 12 months. Non-interest-bearing deposits plunged to 27.5% of total deposits by the end of December 2022 from 57.4% at the end of December 2021, as mentioned in the earnings release. At the same time, balances in NOW and money market accounts have surged. As the rates for these accounts fluctuate regularly, they make the average deposit cost quite sensitive to market interest rate changes.
Further, Coastal Financial issued subordinated notes totaling $20 million in November 2022, which will carry a fixed rate of 7% for the first five years before turning into floating-rate loans, as mentioned in a press release. According to my calculations, this issuance can increase the average funding cost by 5 basis points. The full-quarter impact of this issuance will be felt in the first quarter of 2023.
On the plus side, the loan mix has significantly improved. As of the end of December 2022, around 56% of the assets repriced within three months, up from 36% of assets at the end of December 2021, as mentioned in the earnings presentation.
As of September 2022, the topline was quite rate-sensitive. The results of the management’s rate-sensitivity analysis given in the 10-Q filing for the third quarter show that a 200-basis points hike in interest rates could boost the net interest income by 10.3% over twelve months (the fourth quarter’s 10-Q filing has not been released as yet).
Considering these factors, I’m expecting the margin to grow by 20 basis points in 2023.
Loan Growth To Slow Down But Remain In Double Digits
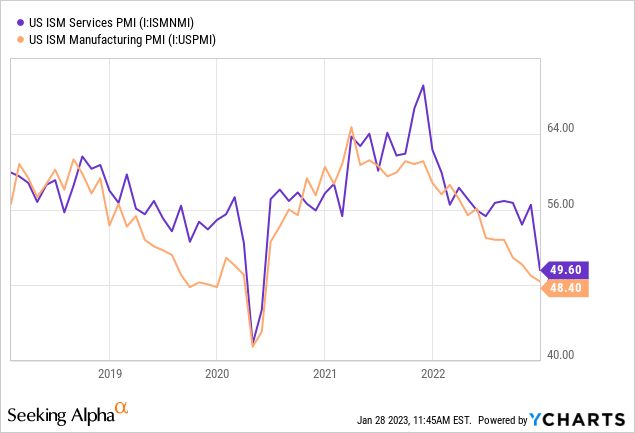
Coastal Financial Corporation’s loan growth slowed in the fourth quarter after a remarkable performance in the first nine months of the year. The portfolio grew by 4% during the quarter, taking the full-year growth to 49%. Loan growth will most probably further slow down in upcoming quarters due to economic factors that will hurt growth in almost all loan segments. Coastal Financial mostly operates in the state of Washington, whose unemployment rate is currently higher than most other states, according to official sources. Further, the company mostly lends to small and medium-sized businesses. Therefore, the PMI index is another appropriate indicator of product demand. As shown below, both the services and manufacturing PMI indices are currently below 50 which indicates economic contraction.
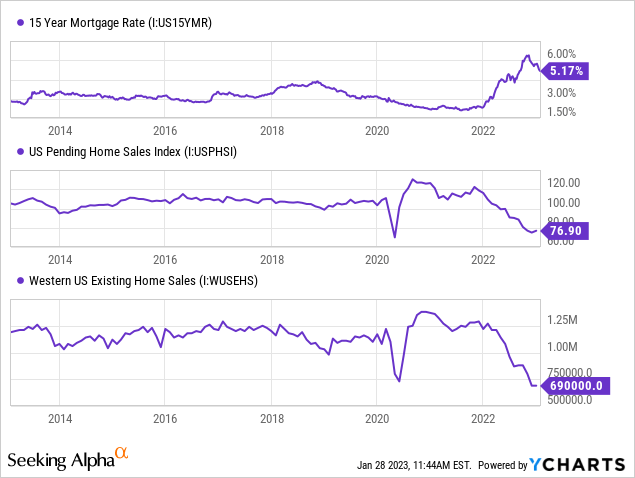
The company also has some exposure to the residential mortgage market. Residential loans made up 17% of total loans at the end of December 2022. The outlook for this segment remains bleak because of the decade-high level of mortgage rates. Further, U.S. home sales have been on a downtrend since last year, as shown below.
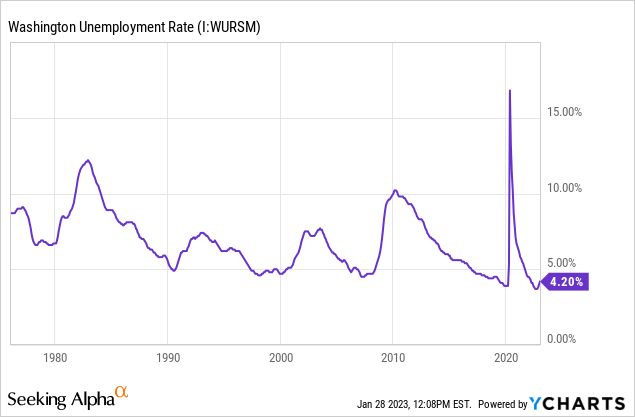
Considering these factors, I’m expecting the loan growth to be below the historical average in 2023. Nevertheless, due to the growth momentum and strong regional job markets in a historical context (see below), I’m expecting the growth to remain in double digits. Overall, I’m expecting the loan portfolio to grow by 10% in 2023.
Meanwhile, the outlook for deposits appears positive partly because of the banking-as-a-service (“BaaS”) segment. Coastal Financial had six partners in the pipeline at the end of December 2022, as mentioned in the earnings presentation, in addition to 19 active partners. BaaS deposits made up just 3.6% of total deposits at the end of December 2022. The new partnerships can significantly increase the proportion of the segment in the deposit book.
The following table shows my balance sheet estimates.
| Financial Position | FY18 | FY19 | FY20 | FY21 | FY22 | FY23E |
| Net Loans | 758 | 928 | 1,528 | 1,714 | 2,553 | 2,818 |
| Growth of Net Loans | 16.9% | 22.3% | 64.7% | 12.2% | 49.0% | 10.4% |
| Other Earning Assets | 151 | 148 | 173 | 844 | 418 | 431 |
| Deposits | 804 | 968 | 1,421 | 2,364 | 2,818 | 3,110 |
| Borrowings and Sub-Debt | 34 | 32 | 200 | 59 | 53 | 54 |
| Common equity | 109 | 124 | 140 | 201 | 243 | 300 |
| Book Value Per Share ($) | 10.3 | 10.2 | 11.5 | 16.1 | 18.0 | 22.2 |
| Tangible BVPS ($) | 10.3 | 10.2 | 11.5 | 16.1 | 18.0 | 22.2 |
| Source: SEC Filings, Author’s Estimates(In USD million unless otherwise specified) | ||||||
Expecting Earnings To Surge By 40%
The subdued loan growth and margin expansion will lift earnings this year. Further, non-interest income will most probably trend upward throughout this year because of the upcoming six new BaaS partnerships. On the other hand, provisioning for expected loan losses will likely remain elevated, which will restrict earnings growth. Just like in 2022, the provisioning for 2023 will likely be above the historical average because of the growth in the BaaS segment, which generally carries greater risk. I’m expecting the provisioning expense to make up 2.8% of total loans in 2023, as opposed to an average of 0.35% for 2017-2021.
Overall, I’m expecting Coastal Financial to report earnings of $4.21 per share for 2023, up 40% year-over-year. The following table shows my income statement estimates.
| Income Statement | FY18 | FY19 | FY20 | FY21 | FY22 | FY23E |
| Net interest income | 35 | 42 | 57 | 79 | 172 | 227 |
| Provision for loan losses | 2 | 3 | 8 | 10 | 79 | 80 |
| Non-interest income | 5 | 8 | 8 | 28 | 125 | 173 |
| Non-interest expense | 26 | 31 | 38 | 63 | 167 | 248 |
| Net income – Common Sh. | 10 | 13 | 15 | 27 | 41 | 57 |
| EPS – Diluted ($) | 0.91 | 1.08 | 1.24 | 2.16 | 3.01 | 4.21 |
| Source: SEC Filings, Earnings Releases, Author’s Estimates(In USD million unless otherwise specified) | ||||||
My estimates are based on certain macroeconomic assumptions that may not come to fruition. Therefore, actual earnings can differ materially from my estimates.
Adopting A Buy Rating
I’m using the historical price-to-tangible book (“P/TB”) and price-to-earnings (“P/E”) multiples to value Coastal Financial Corporation. The stock has traded at an average P/TB ratio of 1.76 in the past, as shown below.
| FY18 | FY19 | FY20 | FY21 | FY22 | Average | |
| T. Book Value per Share ($) | 10.3 | 10.2 | 11.5 | 16.1 | 18.0 | |
| Average Market Price ($) | 15.9 | 15.9 | 15.1 | 31.3 | 43.9 | |
| Historical P/TB | 1.55x | 1.56x | 1.31x | 1.95x | 2.43x | 1.76x |
| Source: Company Financials, Yahoo Finance, Author’s Estimates | ||||||
Multiplying the average P/TB multiple with the forecast tangible book value per share of $22.2 gives a target price of $39.1 for the end of 2023. This price target implies an 11.7% downside from the January 27 closing price. The following table shows the sensitivity of the target price to the P/TB ratio.
| P/TB Multiple | 1.56x | 1.66x | 1.76x | 1.86x | 1.96x |
| TBVPS – Dec 2023 ($) | 22.2 | 22.2 | 22.2 | 22.2 | 22.2 |
| Target Price ($) | 34.7 | 36.9 | 39.1 | 41.3 | 43.6 |
| Market Price ($) | 44.3 | 44.3 | 44.3 | 44.3 | 44.3 |
| Upside/(Downside) | (21.7)% | (16.7)% | (11.7)% | (6.7)% | (1.6)% |
| Source: Author’s Estimates |
The stock has traded at an average P/E ratio of around 14.7x in the past, as shown below.
| FY18 | FY19 | FY20 | FY21 | FY22 | Average | |
| Earnings per Share ($) | 0.91 | 1.08 | 1.24 | 2.16 | 3.01 | |
| Average Market Price ($) | 15.9 | 15.9 | 15.1 | 31.3 | 43.9 | |
| Historical P/E | 17.4x | 14.6x | 12.2x | 14.5x | 14.6x | 14.7x |
| Source: Company Financials, Yahoo Finance, Author’s Estimates | ||||||
Multiplying the average P/E multiple with the forecast earnings per share of $4.21 gives a target price of $61.7 for the end of 2023. This price target implies a 39.3% upside from the January 27 closing price. The following table shows the sensitivity of the target price to the P/E ratio.
| P/E Multiple | 12.7x | 13.7x | 14.7x | 15.7x | 16.7x |
| EPS 2023 ($) | 4.21 | 4.21 | 4.21 | 4.21 | 4.21 |
| Target Price ($) | 53.3 | 57.5 | 61.7 | 65.9 | 70.1 |
| Market Price ($) | 44.3 | 44.3 | 44.3 | 44.3 | 44.3 |
| Upside/(Downside) | 20.3% | 29.8% | 39.3% | 48.8% | 58.3% |
| Source: Author’s Estimates |
Equally weighting the target prices from the two valuation methods gives a combined target price of $50.4, which implies a 13.8% upside from the current market price. Hence, I’m adopting a buy rating on Coastal Financial Corporation.
Be the first to comment