

Blue Planet Studio/iStock via Getty Images
Written by Nick Ackerman, co-produced by Stanford Chemist. This article was originally published to members of the CEF/ETF Income Laboratory on August 9th, 2022.
A topic we covered earlier this year remains particularly relevant for a volatile market. That is the overall valuation picture for closed-end funds. As most CEF investors know, discounts and premiums play a huge role in the outcome of a given position. CEFs can feel this impact even more in a down market if the discounts also widen further.
Today, I wanted to revisit to see where we were regarding discounts and premiums as we navigate a challenging 2022. This is a year that, so far, has frustrated not only CEF investors but all investors. Unless you are a 100% energy-focused investor, you’re likely seeing quite a few red areas in your portfolio.
Another important note on CEFs is to mention the leverage that adds to even more volatility. The majority of CEFs are leveraged vehicles. That amplifies downside as well as upside when things are going better. According to Nuveen, at the end of 2021, 70% of the outstanding funds were leveraged. Due to this leverage being primarily floating in nature, that creates more uncertainty in a rising rate environment.
So, we do have a lot of layers to consider in the CEF space. That can make them feel like more complex instruments. At the end of the day, though, they are just a basket of other stocks, bonds and other assets. They aren’t an asset class themselves.
Why Do Premiums And Discounts Happen?
Here’s some background on the basics of discounts and premiums for those who might be new to closed-end funds.
As a refresher, or for those just new to the CEF space. Here is what we are talking about when we discuss premiums and discounts.
A premium or discount happens when the market price differs from the NAV per share price. The market price is simply what buyers and sellers are trading a fund at. The NAV per share is the net asset of the fund divided by outstanding shares.
So, think of it this way for discounts – let’s say fund XYZ has 1 share outstanding. Let’s put the 1 share’s NAV at $100. Though the market price of XYZ is trading at $90. That gives us a 10% discount.
Now let’s say fund XYZ has 1 position in its portfolio. Company ABC trades on the NYSE. ABC’s share price would equal $100 because that is the NAV of fund XYZ.
Now, let’s say company ABC goes to $110 per share. That means fund XYZ’s NAV per share rises to $110. However, that DOES NOT mean that the share price of XYZ also increases to $110.
We can take it a step further, too. Let’s say XYZ’s share price doesn’t move at all. The fund is now trading at an even wider discount of 18.18%! (This is usually where and why we say valuations start creating opportunities.)
The reverse is true for premiums as well. Take XYZ fund again. This time, let’s say the NAV per share is $100, except the share price is trading at $110. XYZ would be said to be trading at a premium of 10% now. The underlying asset/s didn’t move, so NAV per share didn’t change. The market price that an investor can buy the fund for did change, though. Exactly just like any other stock traded on an exchange.
Looking At The Broader Picture
Overall volatility has come down from higher levels earlier this year. In our previous article on valuations, the VIX was just over 30.
Ycharts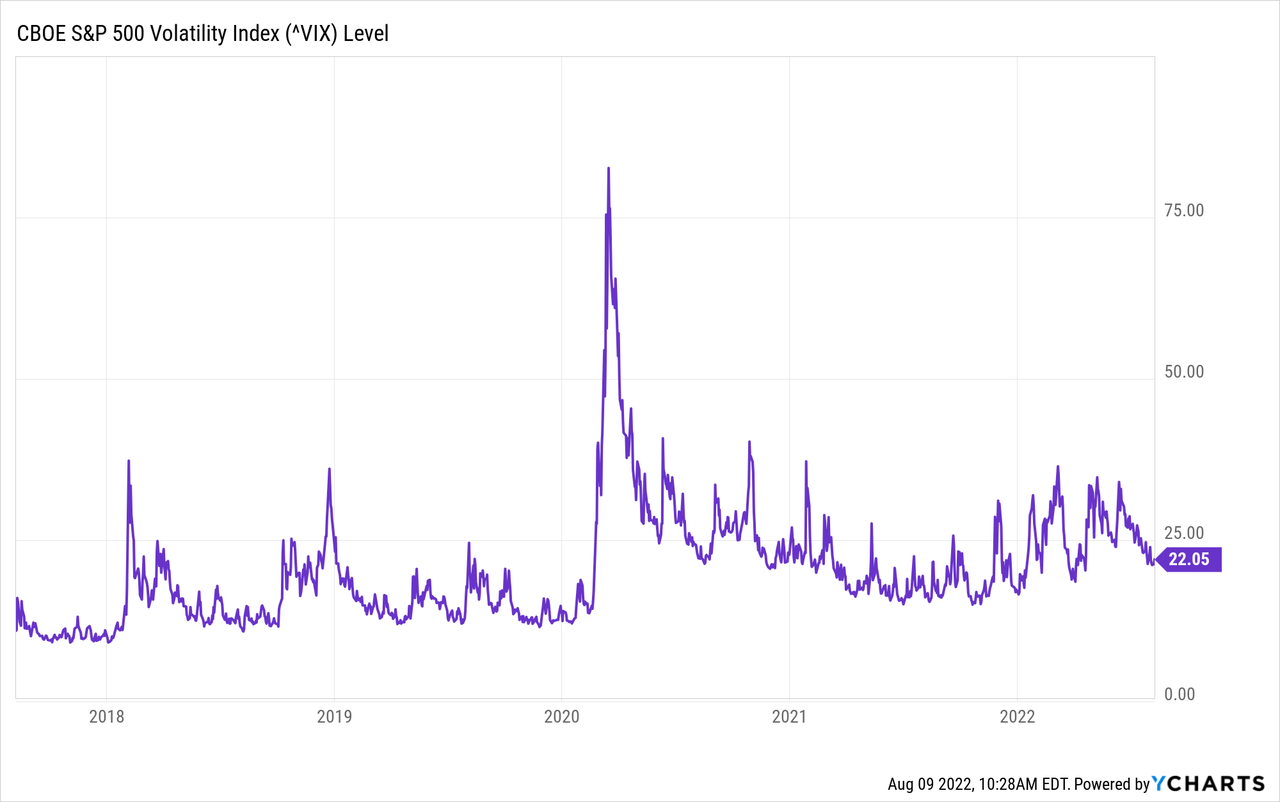
On April 22nd, 2022, the average discount of all CEFs came to -5.74%. That’s when we did our previous update. That was a move wider from the -2.51% average discount that funds showed on December 31st, 2021. June 16th, 2022, which has thus far been the low for the year, had the average CEF discount widen out to 7.46%.
That’s a far cry from the 15.11% average discount achieved on March 23rd, 2020. However, these sort of sharp across-the-board discounts in CEFs has shown to indicate some capitulation. I would say it was a fairly sharp decline too. On June 15th, 2022, the average discount was 6.18%.
Looking at the August 5th, 2022, closing data, we can see that the average discount now comes in at -3.98%. Despite remaining quite a volatile year, the overall market recovery seems to have helped strengthen the discounts we see in CEFs. A narrowing of this discount means that investors in the CEF space more broadly are experiencing a stronger rebound.
I certainly noticed it in some of the valuations on the funds I hold. Eaton Vance Tax-Advantaged Global Dividend Income Fund (ETG) is just one example that I discussed more in-depth recently. The fund hasn’t traded at a premium for almost its entire life, and now it has been lately. That’s the sort of action we saw in 2021 when the overall CEF space became historically pricey. With the overall discount at nearly 4% across the board, I wouldn’t say we are historically elevated. We are just seeing some more specific names climb to unusual premiums.
To me, that is all a bit surprising, considering how much skepticism I continue to see from commenters on Seeking Alpha. I would have thought most retail investors were more afraid to chase this market higher as it continues to rebound from the June lows. That’s just my personal thought from what I’ve observed more broadly.
I’m always making purchases every month to grow my cash flow. So to me, today is always the best day to be investing. Valuation just dictates where I might put that capital to work. With that being said, I don’t have a strong opinion on which way the market goes from here. I suspect that it still relies on the Fed. If they slow or pause rates, we know that they have truly pivoted, and we could continue to rally.
Screens For Some Ideas
In our previous piece, we shared some screens of those funds that were at the deepest discounts and had the most negative z-scores. I’ll share those again for some takeaways on some potential trading ideas.
However, I’d first like to look at which funds are trading at the highest premiums and z-scores. These are names that could suggest one could sell and replace with a better-valued fund.
Highest Premium
| Name | Ticker | Share Price | NAV | Premium/Discount | Distribution Rate |
| Gabelli Utility Trust | (GUT) | 7.6915 | 4.05 | 89.91% | 7.80% |
| The Central and Eastern Europe Fund | (XCEEX) | 9.65 | 6.63 | 46.30% | 9.88% |
| Gabelli Multi-Media | (GGT) | 7.24 | 5.37 | 34.82% | 12.15% |
| PIMCO CA Municipal Income | (PCQ) | 15.25 | 11.58 | 31.69% | 5.11% |
| PCM Fund | (PCM) | 10.12 | 7.9 | 28.10% | 9.49% |
| Eagle Point Income Co Inc | (EIC) | 17.29 | 13.66 | 27.74% | 8.68% |
| Cornerstone Strategic Value | (CLM) | 10.33 | 8.15 | 26.75% | 21.00% |
| Cornerstone Total Return Fund | (CRF) | 9.84 | 7.78 | 26.48% | 21.15% |
| Guggenheim Strategic Opp Fund | (GOF) | 17.47 | 13.94 | 25.32% | 12.51% |
| Virtus Stone Harbor Emerging Markets Inc | (EDF) | 4.93 | 4.1 | 20.24% | 14.60% |
It comes as little surprise to me that we see GUT as the fund with the highest premium. That one continues to defy gravity. I’d even suggest potentially that it is only a more mediocre fund that shouldn’t even hold the crown as the highest premium CEF year after year. However, I don’t decide what valuation gets applied to what fund. That’s for all CEF investors to decide, and they have decided that is the one.
On a more interesting note, seeing CEE at this incredible premium is even more unusual. The fund’s NAV and price both collapsed after Russia invaded Ukraine. However, the fund’s price has stayed relatively strong compared to its NAV which has pushed it into this extreme territory of a premium.
Ycharts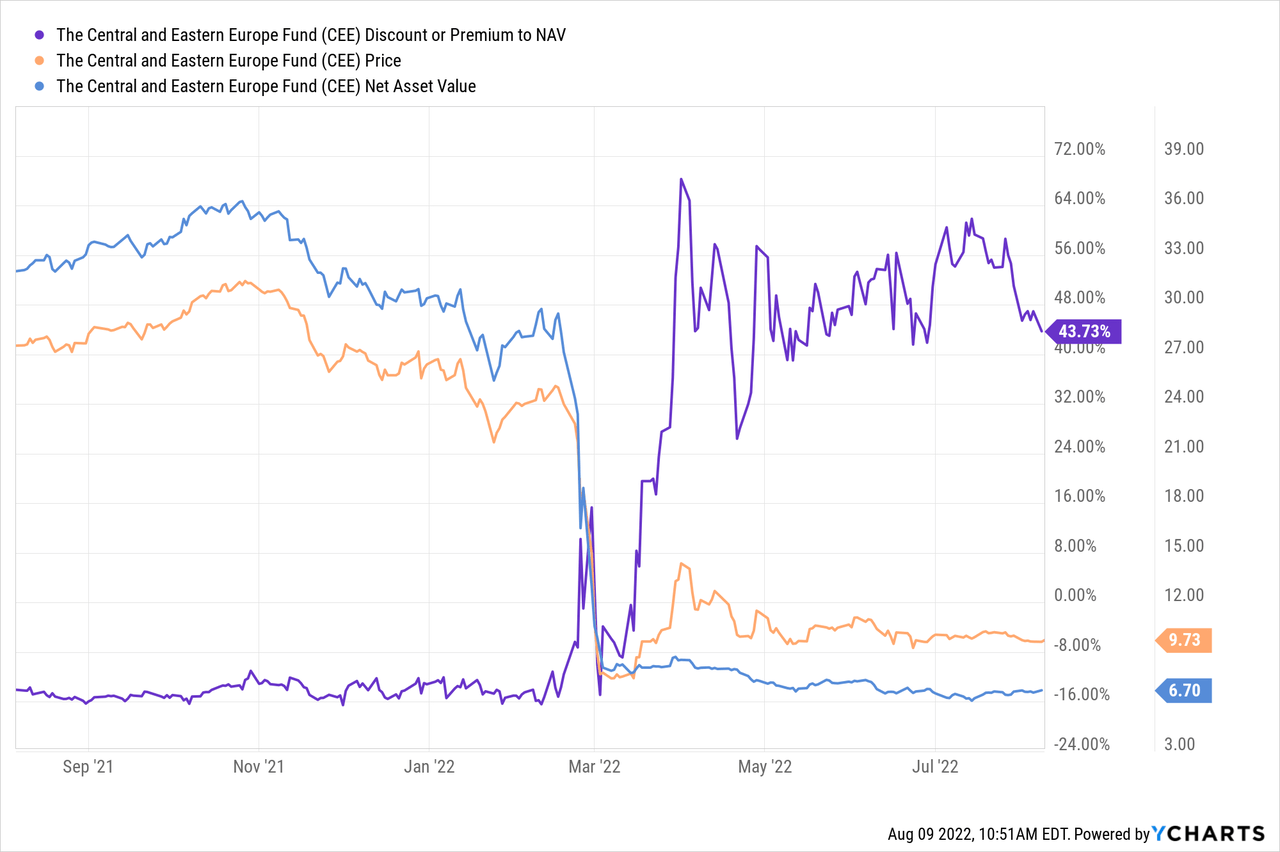
Highest Z-score
Despite the funds that show the highest premiums, that doesn’t always equate to the highest 1-year z-score. That’s because the z-score is a discount/premium measurement that is relative to its average discount/premium. In this case, we are looking at the 1-year z-score. This helps reinforce why we see GUT on the top of the previous list, but it actually isn’t on the highest z-score list at all.
| Name | Ticker | Share Price | NAV | Premium/Discount | Distribution Rate | 1-Year |
| Eagle Point Income Co Inc | (EIC) | 17.29 | 13.66 | 27.74% | 8.68% | 4.36 |
| Eaton Vance Tax-Managed Buy-Write Opp | (ETV) | 15.41 | 13.56 | 13.64% | 8.63% | 3.85 |
| Delaware Inv National Muni Income | (VFL) | 12.69 | 13.07 | -2.91% | 4.26% | 3.65 |
| Tortoise Pipeline & Energy | (TTP) | 28.98 | 32.77 | -11.57% | 8.14% | 3.59 |
| Eaton Vance Tax-Managed Divrs Equity Inc | (ETY) | 13 | 12.14 | 7.08% | 8.58% | 3.49 |
| Eaton Vance Tax Adv Global Dividend Inc | (ETG) | 19.12 | 18.21 | 5.00% | 8.16% | 3.36 |
| Eaton Vance Tax-Advantaged Glbl Div Opp | (ETO) | 28.2 | 25.07 | 12.49% | 7.63% | 3.33 |
| Columbia Seligman Premium Technology Gr | (STK) | 31.86 | 28.51 | 11.75% | 5.81% | 3.13 |
| Calamos Convertible & High Income Fund | (CHY) | 13.13 | 12.03 | 9.14% | 9.14% | 3.02 |
| Virtus Total Return Fund Inc | (ZTR) | 9.15 | 8.45 | 8.28% | 10.49% | 2.79 |
The first name we see is EIC. Now, this is where we have to be a bit more careful. The reason being is that the fund doesn’t provide a regular NAV report. CEFConnect is only looking at a NAV as of June 30th, 2022. A lot could have happened in that period.
Additionally, we see ETG and ETO on this list. That mirrors my hesitation in adding to those names as I wrote about recently. The Calamos funds were some I thought were getting a bit stretched lately. As we can see, CHY shows up on this list.
Deepest Discount
| Name | Ticker | Share Price | NAV | Premium/Discount | Distribution Rate |
| Destra Multi-Alternative | (DMA) | 7.04 | 11.41 | -38.30% | 9.55% |
| FOXBY CORP | (OTCPK:FXBY) | 12.5 | 19.9 | -37.19% | 16.00% |
| Dividend and Income Fund | (OTCPK:DNIF) | 12.21 | 17.41 | -29.87% | 8.19% |
| Highland Floating Rate Opportunities Fd | (HFRO) | 11.5 | 15.47 | -25.66% | 8.03% |
| Cushing® MLP & Infras Total Return | (SRV) | 30.01 | 39.34 | -23.72% | 6.00% |
| Cushing® NextGen Infrastructure Income | (SZC) | 41.95 | 54.96 | -23.67% | 6.10% |
| Mexico Equity & Income | (MXE) | 7.91 | 10.21 | -22.53% | 1.52% |
| Highland Global Allocation Fund | (HGLB) | 10.04 | 12.53 | -19.87% | 9.68% |
| OFS Credit Company Inc | (OCCI) | 9.67 | 12.44 | -18.67% | 22.75% |
This list provides us with some funds that could be worth looking into based on their deep discounts. However, not all names on this list are worth picking up. Several of these names had actually shown up on our previous screen on funds with the deepest discounts. Sometimes, there is a reason that the names are on the list.
One such name here, DMA, is one I’ve specifically covered just recently. I saw the reason why one might be tempted or consider an investment for a specific type of investor. Ultimately, it is probably more of an avoid than a bargain.
It was also a name that showed up in the prior piece but was the second to last in the deepest discount. It was beaten out by FXBY at that time, so FXBY has climbed up one position from the bottom now. FXBY and DNIF are traded OTC on the pink sheets. That being said, DNIF has started to get my attention as their portfolio doesn’t look terrible.
Fortunately (or unfortunately, depending on your situation), there seems to be no rush to cover or invest in DNIF. This discount has remained quite persistent and has only gotten deeper lately. Thus, why my interest in the name grows as it pushes closer to its COVID discount low relative to its longer-term average.
Ycharts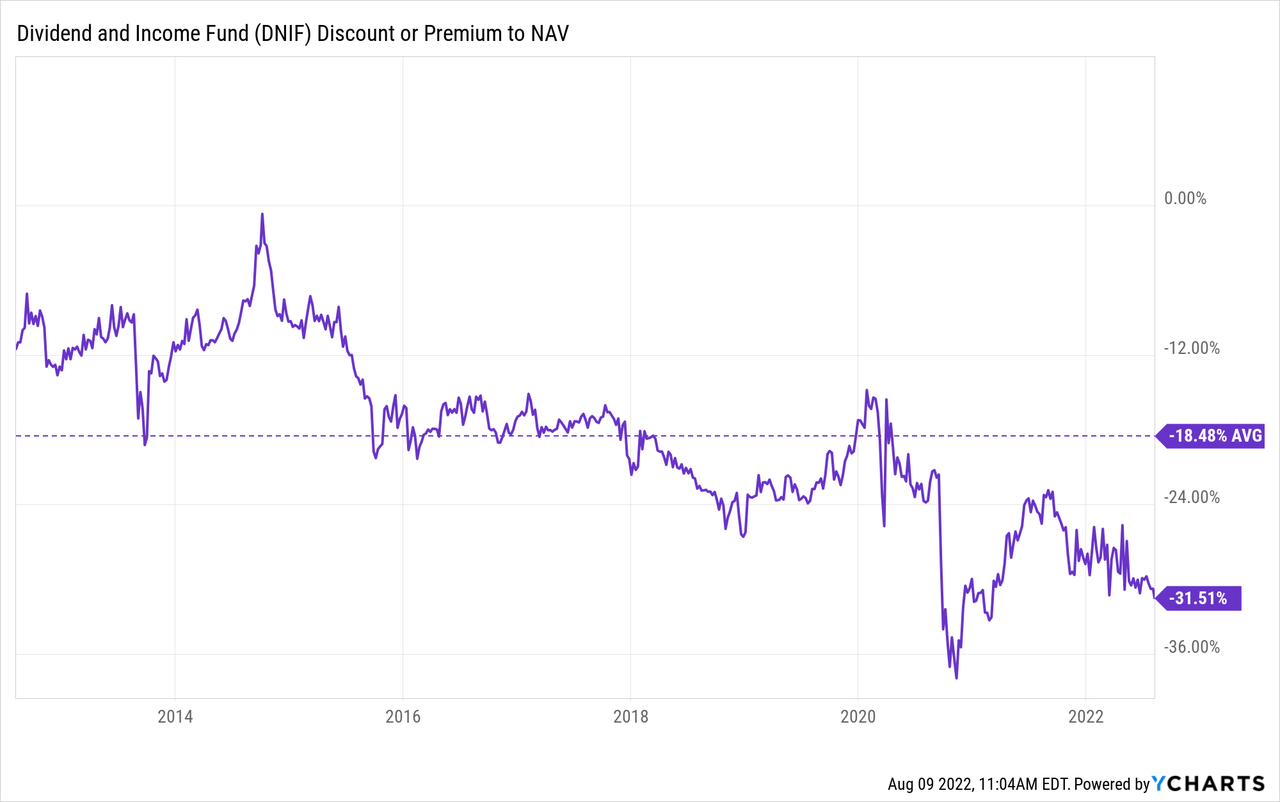
Deepest Z-score
This stat is arguably the most beneficial screen primarily because it gives us what names could be of real value. These are names that are at lower valuations relative to their own history.
In this case, too, we don’t see the same names that we saw for the deepest discounts. It’s similar to the premium and z-score list we saw there, just reversed. The funds we saw with the deepest discounts tend to be plagued by those deep discounts continually. Therefore, we won’t see them having a large negative z-score.
| Name | Ticker | Share Price | NAV | Premium/Discount | 1-Year |
| MFS Special Value | (MFV) | 4.74 | 4.77 | -0.63% | -2.52 |
| New Germany | (GF) | 8.75 | 10.01 | -14.19% | -2.29 |
| ArrowMark Financial Corp | (BANX) | 18.18 | 21.75 | -13.30% | -1.93 |
| Delaware Enhanced Global Div and Inc | (DEX) | 7.69 | 9.06 | -15.12% | -1.78 |
| Cushing® NextGen Infrastructure Income | (SZC) | 41.95 | 54.96 | -23.67% | -1.71 |
| Templeton Dragon | (TDF) | 12.36 | 14.17 | -12.77% | -1.71 |
| OFS Credit Company Inc | (OCCI) | 9.67 | 12.44 | -18.67% | -1.66 |
| China Fund | (CHN) | 13.34 | 15.51 | -13.99% | -1.58 |
| First Trust/abrdn Emerging Opp | (FEO) | 8.52 | 10.15 | -16.06% | -1.57 |
| First Trust Energy Infrastructure | (FIF) | 14.63 | 17.16 | -14.74% | -1.57 |
One thing that jumps out to me here is that despite energy being such a strong performer YTD, we have several funds that have sizeable exposure to that area of the market at some deep discounts. SZC shows up on this list and on the deepest discount list. That’s along with its sister fund SRV in the prior list.
SZC has significant energy exposure, but YTD is still being pushed aside despite the relatively attractive performance. And by that, I simply mean it has positive returns where so many investments have negative in 2022. This also includes FIF, which has utility and energy exposure. The utility sector has done reasonably well this year too.
I might be biased here as I’m a holder of SZC, but I don’t believe it deserves to trade at such a deep discount relative to the CEF space. That being said, at a z-score of less than 2, we aren’t at very unusually wide discounts either. Here’s a look at the last year for SZC, SRV and FIF.
Ycharts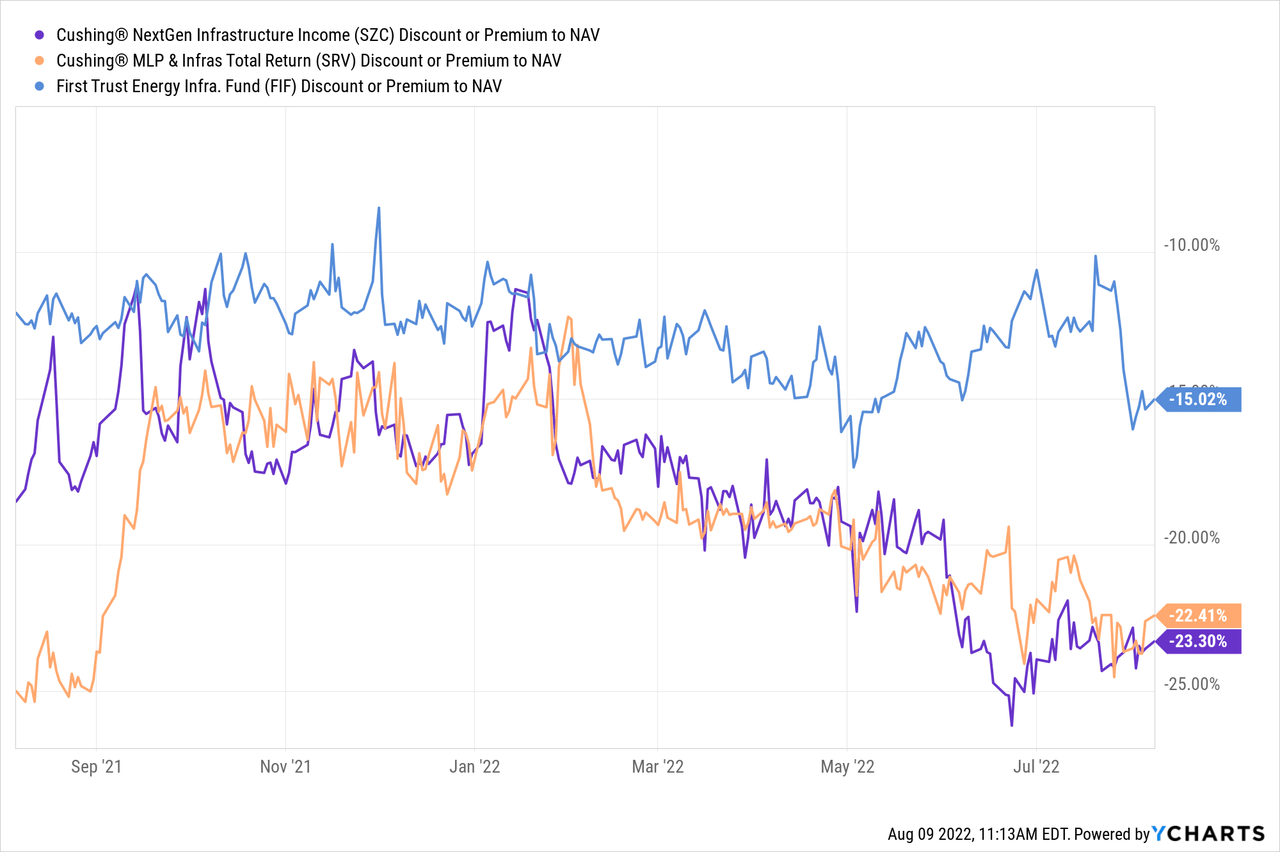
Finally, I want to highlight MFV. While I don’t own, nor have I ever really looked at the fund, it’s a great example of discount/premium valuations in CEFs. The fund’s barely at a discount. Yet, it commands the largest negative 1-year z-score at this time. This is a great example of why screening is only a first look, that a deeper dive would obviously be necessary before making a final decision.
Below is a look at the discount and premium for the fund over the last decade.
Ycharts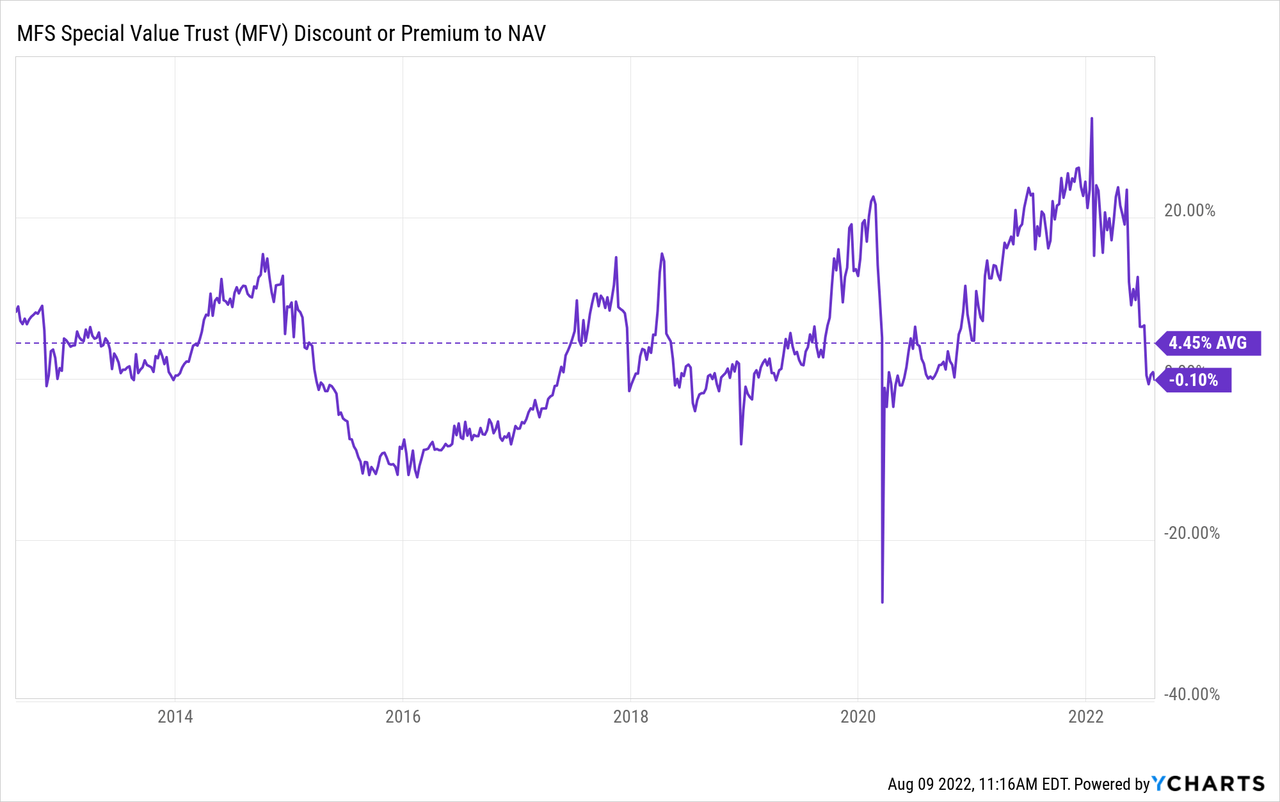
We can see that the fund traded at some enormous premium over the last year. That’s partially why a reversion to even a shallow discount is creating what appears to be a fairly strong value. Over the last decade, we can see that the fund traded at an average premium of almost 4.5%. That would mean that it is still quite attractively valued relative to that basis, but it isn’t nearly as tempting as the 1-year z-score might suggest.
Conclusion
We are continuing the volatile 2022, but discounts in CEFs have narrowed slightly from where we were earlier this year. We are still sitting wider than where we finished up in 2021. I believe that still provides us with opportunities that are worthwhile investing in, especially combining it with the overall market declines that have taken down valuations. That being said, it does appear we have to be a bit more selective at this time on where to put capital to work.
Be the first to comment