

Suriyapong Thongsawang/iStock via Getty Images
Note: This report was previously shared with members of Value Investor’s Edge.
Product Tanker Sector Overview
Rates in the product tanker market have been remarkably resilient over the past couple of months, and operating cash flows for companies in the sector are set to increase noticeably if rates hold onto these gains.
However, whether rates will remain near current levels is anyone’s guess, since part of the recent run-up is attributable to the war in Ukraine, which has caused upheaval in the world energy markets, with the European diesel market being one of the biggest parts of this trend.
Most publicly traded companies in the sector trade at a hefty discount to net asset value (“NAV”), providing downside protection should rates ease once again. Additionally, even though the past couple of years have been notably weak, balance sheets are in decent shape and some firms like Torm (NASDAQ:TRMD), have very strong financial positions and can easily weather all market conditions.
My favorite in the sector on a risk/reward basis is Torm (TRMD), but Scorpio Tankers (NYSE:STNG) and Ardmore Shipping (NYSE:ASC) also look attractive on the more speculative side due to their higher leverage, and thus higher potential upside if the market continues to strengthen. Hafnia (Oslo: HAFNI), a Norwegian listed product tanker company is a strong operational performer but it appears to be fully valued at current pricing, at least when compared to peers.
Demand Drivers for Product Tankers
As most can imagine, the main driver for product tanker demand is the need to transport refined products from regions with a production surplus (i.e., exporters) to regions with a production deficit (i.e., importers). Market balances have been mostly weak since 2009 with the exception of the 2015-2016 and the 2019/H1-20 periods.
Keep in mind that seaborne ton-mile demand for product tankers was virtually static from 2016 to 2019, actually decreasing a tad, whereas the pre-pandemic high in demand was set in 2018. The pandemic obviously weighed on demand once we got over the surge caused by floating storage, which took the market by storm.
However, per Clarkson’s estimates, ton-mile demand for 2021 came in around 1% below 2019’s, whereas 2022’s ton-mile demand is forecasted to easily surpass previous highs, rising around 12.4% over 2019 highs, whereas further growth is expected for 2023, when ton-mile demand is expected to grow an additional 5.5% over 2022’s numbers.
Nonetheless, it is relevant to note that world seaborne oil products trade is forecasted to remain below pre-pandemic highs (set in 2018) not only this 2022, but also in 2023, which is quite interesting given the significant increases forecasted in ton-mile demand. This essentially means that although oil products volumes will remain lower than in 2018, changing trade patterns are providing a significant boost to ton-mile demand.
One of the main drivers behind the increase in ton-mile demand has been shifting trade patterns due to refinery closures in refined products importing regions and the addition of new refining capacity in countries that are already net exporters of products.
As can be seen in the image below, most capacity additions are located in the Middle East and Asia, “boding well for the ton-mile development in the medium and long-term” (link). Publicly traded product tanker companies have been consistently mentioning this as a potential ton-mile demand generator, and it seems it is starting to bear fruit.
Source: Torm’s Q4 earnings presentation, slide 19.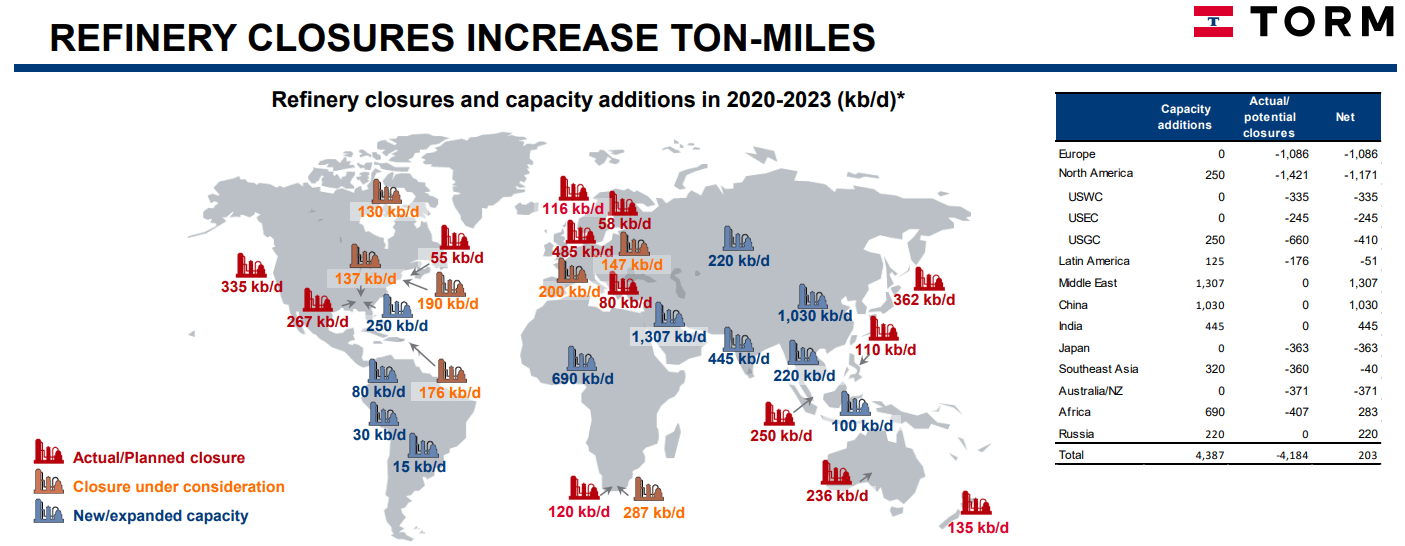
As mentioned before, overall demand for refined products is forecasted to remain below pre-pandemic highs even in 2023, but there have been significant differences in performance inside the overall products market, as can be seen in the image below. Certain oil products such as LPG, Ethane (which are not transported in product tankers), and Naphtha have been remarkably resilient during this demand downturn, mostly due to their use in the petrochemical industry.
Hafnia’s Q4 earnings presentation, slide 12.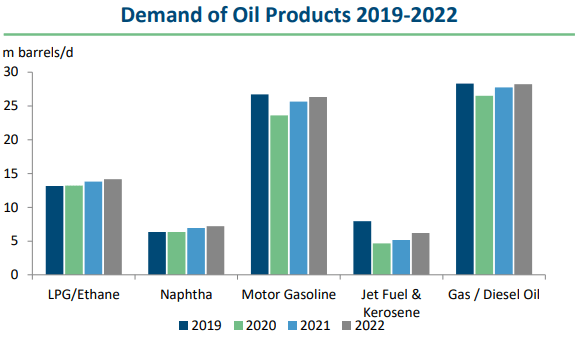
However, volumes mostly come from diesel and gasoline, which came under pressure during the pandemic. Although those two are expected to continue recovering during 2022, jet fuel demand is forecasted to stay well below pre-pandemic levels.
Finally, and regarding the war in Ukraine, keep in mind Russia is one of the main producers of crude oil, and one of the main exporters of both crude oil and refined oil products. As can be seen in the image below, the bulk of Russian seaborne exports are headed towards Europe, whereas Asia is also a sizable importer.
Source: Torm’s Q4 earnings presentation, slide 16.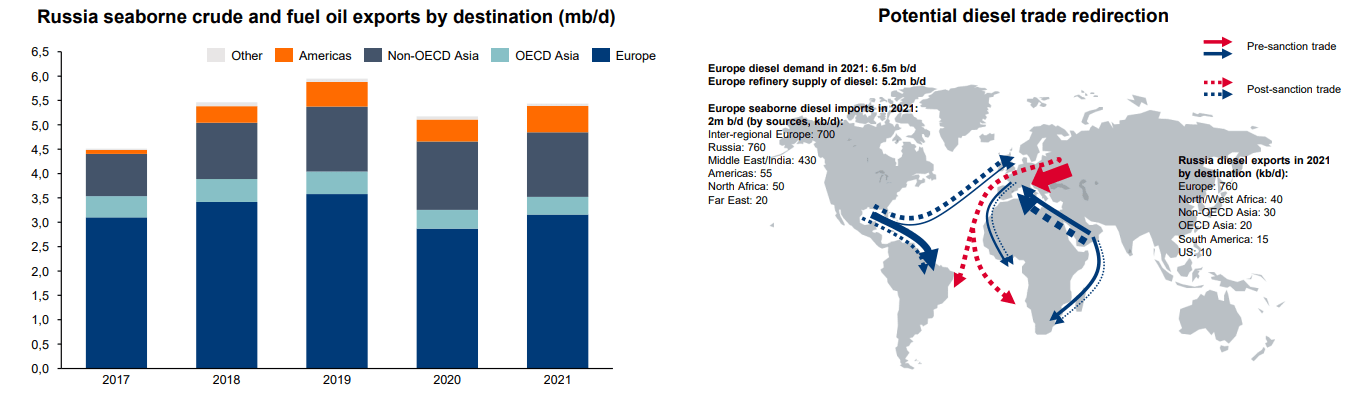
What the ultimate impact from the war will be remains to be seen, since energy exports are one of the main parts of the Russian economy that so far has remained excluded from Western sanctions, with the US has being the only major player to ban Russian oil and gas imports, basically because the US is mostly self-sufficient regarding its oil and gas needs (whereas its European partners are still very dependent on Russian energy imports, although pressure to ban imports has also been increasing as of late).
Though, and albeit Russian energy imports are not legally banned in Europe, certain oil majors and traders have used self-sanctioning to shun Russian energy imports, which has weighed on the European diesel markets. Should European product imports from Russia drop to 0, I would expect significant ton-mile demand gains since significant inefficiencies would appear: European imports would have to be sourced from further away whereas Russian exports would also be sold to buyers that are geographically not as close as Europe.
Overall, significant ton-mile demand gains are expected this and next year, although total volumes will remain below pre-pandemic highs. Refinery dislocations have started to add to ton-mile demand, and market balances have recently started to tighten.
Product Tanker Supply
By supply in the shipping sector, we usually refer to vessel supply, which dictates overall market balances when coupled with vessel demand. The vessel supply is driven by newbuild ordering, which can be easily followed by looking at the orderbook and scrapping (vessels that are sent to the scrapyard since future returns are not deemed attractive by their owners).
As can be seen in the image below, scrapping was very low throughout 2019 and 2020, but increased substantially during 2021. This is entirely justified by the very low rates we have seen throughout the year, and should have arguably been higher if it were not for shipowner’s optimism.
Source: Hafnia’s Q4 earnings presentation, slide 15.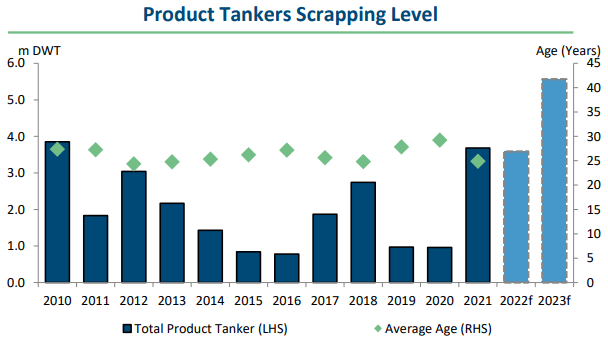
Additionally, note how the average age of the vessels scrapped has been reduced noticeably to circa 2018 levels (around 25 years). Hafnia’s management expects 2022 and especially 2023 to be big scrapping years, most likely due to the upcoming regulations, which are set to put a dent on supply in and by themselves (although the ultimate effect still needs to be assessed).
Furthermore, the orderbook is sitting at very attractive levels (and this is arguably an understatement). It is currently estimated at 5.1% of the fleet, which is the lowest for any of the major shipping segments. Keep in mind that assuming that product tankers have a useful life of about 25 years, we should see around 4% of the fleet being delivered (and the same number of vessels scrapped) for the fleet to remain constant while keeping its average age constant.
Therefore, it does seem we will most likely see negative fleet growth in the medium-term if ordering does not pick up substantially, which seems unlikely given rising newbuild pricing (as can be seen in the image below) and uncertainty regarding future propulsion technologies. Product tankers are generally “cheap” vessels relative to the price of retrofitting them with modern propulsion technologies, meaning that shipowners in the sector have an incentive to wait and see prior to committing to acquiring vessels that may have to surmount expensive retrofits in the medium-term.
Source: Torm’s Q4 earnings presentation, slide 21.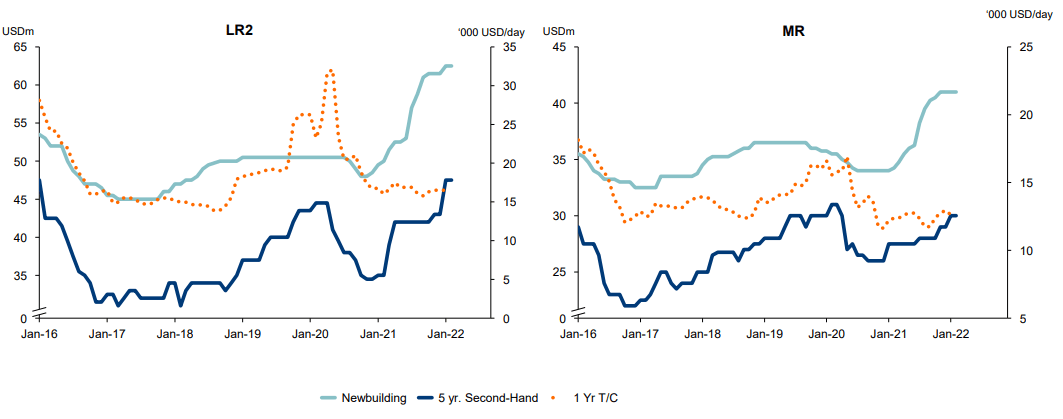
Overall, the supply side of the products tanker segment remains very attractive, with the orderbook as a percentage of the fleet sitting at the lowest point in modern history. However, the question is whether the demand side will keep its end of the bargain. Even if we only see minor ton-mile demand going forward, market balances could be rather tight due to the exceptionally attractive supply side of the equation.
Realized Rates in the Sector
Shipping is a highly commoditized sector, where one company’s offering is virtually the same as that of a competing enterprise. Therefore, operating performance from market participants should be fairly similar when adjusted by fleet attributes (average age and eco component) and scrubber prevalence.
However, performance should be assessed differently for each vessel class, since it is certainly not the same an LR2 than an MR, with the latter being notably smaller and its rates being usually less volatile over time. To assess which companies have the best operational performance I decided to look at the realized averages during 2021 (on a quarterly basis) while adding the rates at which they had so far fixed their open exposure for Q1-22 when these companies reported their earnings.
LR2s are the biggest vessels in the products sector and are usually employed on long trade routes. STNG is the biggest player in the sub-segment, with a fleet of 40 LR2s, followed by TRMD’s 15 vessels and Hafnia’s six. As can be seen in the image below, the best performer has been Hafnia, which has wildly outperformed its peers. This is attributable to the charter cover the company had previously secured but is nonetheless a positive. TRMD’s and STNG’s LR2s have mostly traded in the spot market, and Torm has consistently managed to outperform its peer (although STNG has more modern assets as well as higher scrubber prevalence).
Source: Author’s own elaboration based on public company filings.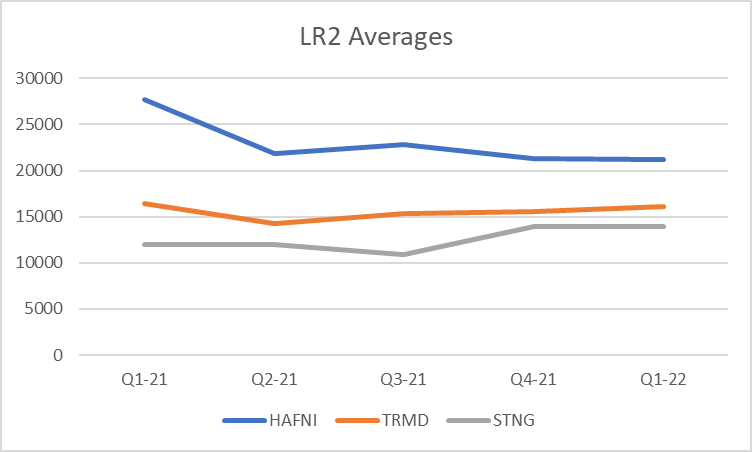
LR1s are employed on similar routes as LR2s, but they have more flexibility to cover routes traditionally controlled by MRs. The biggest player in this sub-segment is Hafnia, even more so after the acquistion of all of STNG’s LR1s. I have decided to include STNG in the LR1 comparison for illustrative purposes but note that the company has sold all of its assets in the segment to Hafnia, so it does not have any exposure to it anymore.
As can be seen in the graph below, the best performer in the segment is Torm, which has consistently come ahead of both STNG and Hafnia over the past year (as well as regarding Q1-22 guidance). Hafnia’s and STNG’s performance were very similar in this period, and I expect Hafnia’s relative performance to improve once all the STNG vessels have been delivered.
Source: Author’s own elaboration based on public company filings.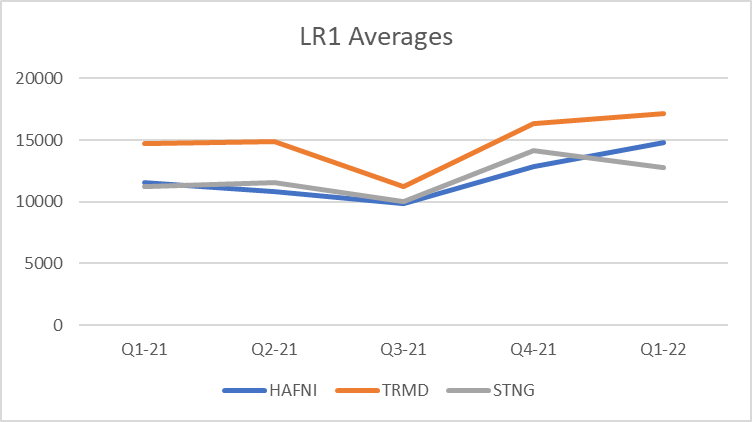
MRs are the workhorse of the products tanker sector, covering most trade routes due to their exceptional flexibility. This sub-segment represents the bulk of the global products tanker fleet, and is also the most prevalent vessel among publicly traded fleets (the vessel type shipowners own the biggest number of).
As can be seen in the image below, the best performer has been Torm, although its superiority has come under question as of late after Hafnia’s significant improvement on relative performance. ASC has been the steadiest performer, coming in with similar performance to STNG, whereas Hafnia’s numbers have been volatile (but has improved noticeably as of late).
Source: Author’s own elaboration based on public company filings.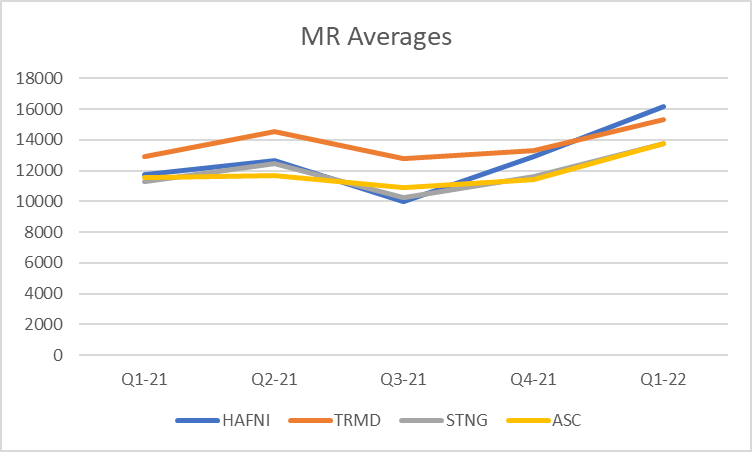
Torm usually outlines their superiority in the MR segment on a quarterly basis, with the following chart. Throughout 2021, the company generated an extra $44M in EBITDA from their superior chartering performance relative to peers, which is quite a feat considering TRMD’s market cap amounts to around $710M (and note that with TRMD’s cost structure, the $44M are pure FCF).
Source: Torm’s Q4 earnings presentation, slide 7.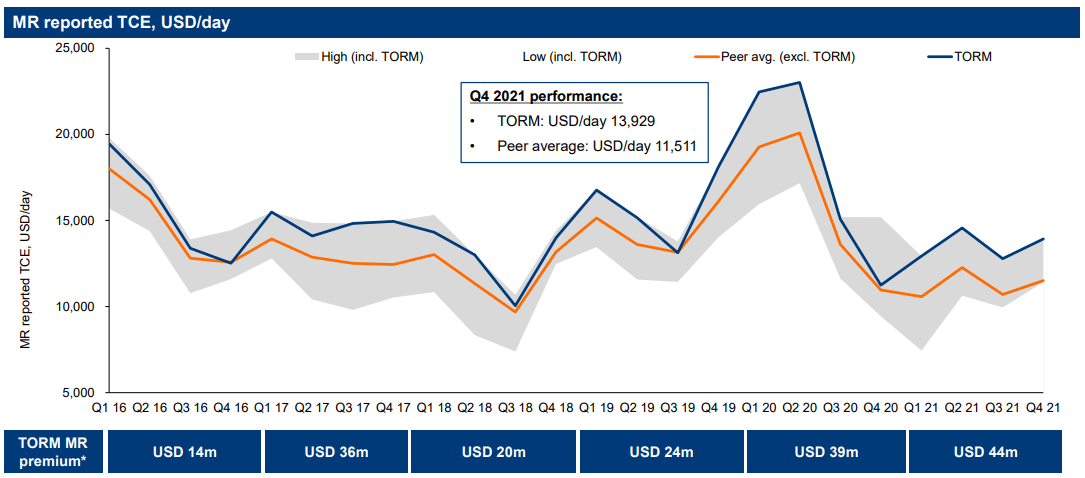
Finally, Handysizes are mostly used for shorter and coastal trade routes, largely the transport of products within European ports or for Mediterranean trade. They represent a small portion of the publicly traded players fleets. Torm’s performance in the segment has been rather volatile, and Hafnia has posted steadier performance (while beating STNG’s realized rates).
Source: Author’s own elaboration based on public company filings.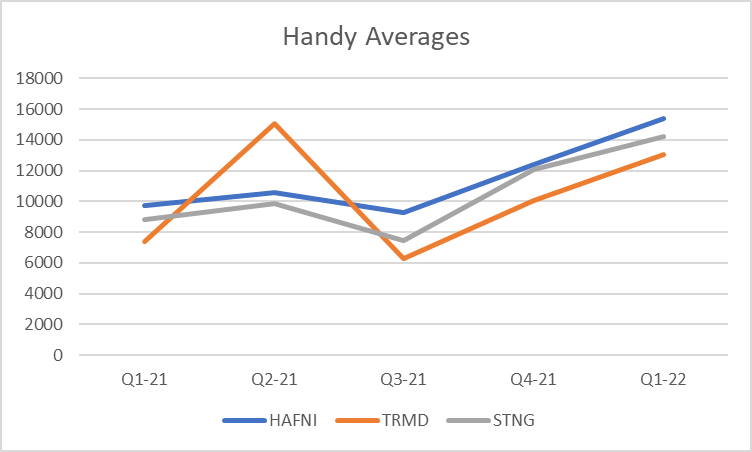
Source: Author’s own elaboration based on public company filings.
As I mentioned before, shipping is a commoditized business, but at least throughout 2021, there have been significant performance disparities. STNG’s realized rates have been lackluster considering their ultra-modern fleet and scrubber prevalence (which is the highest in the sector).
I consider Torm to be the best operational performer, followed by Hafnia. I especially like Torm’s edge in the MR segment (although it has come under question as of late) since it represents the largest sub-segment in all publicly traded fleets. The company has decent scrubber prevalence (52 scrubbers installed and an additional 6 to be installed on an 85x vessel fleet) which provides a boost to nominal performance, but relative to peers, performance is strong, nonetheless.
Torm: My Favorite Risk/Reward Selection
In the current environment, Torm is my favorite player, not only due to its superior chartering abilities, but also due to the hefty discount to NAV, its high scrubber prevalence, and attractive shareholder returns policy already in place. The company’s distribution policy consists of distributing 25% to 50% of net income on a semi-annual basis, following the half-year and full-year results.
On the other hand, Torm is sitting in a comfortable financial position, with ample liquidity and a manageable debt maturity schedule, which can be seen in the image below.
Source: TRMD’s Q4 earnings presentation, slide 26.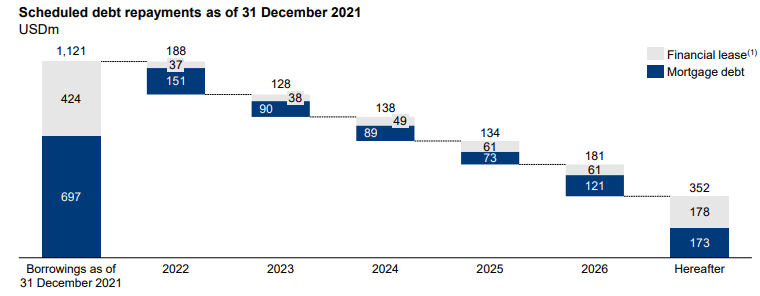
One of the major concerns when investing in Torm is that Oaktree is the largest shareholder with a 66% stake, which represents a major overhang (and weighs on trading liquidity). However, Oaktree has so far been a nimble investor in the shipping sector, and although they also own a controlling stake in Star Bulk Carriers (SBLK), they have been very careful regarding the divestment of their stake.
Finally, note that Torm’s most liquid listing is in Copenhagen, whereas the US one, although a positive to provide more diverse investor accessibility has a very low trading volume (around 200k shares per day). Before investing or trading in TRMD, it makes sense to check the Copenhagen quote to make sure the US market pricing is reasonable.
Overall, and as mentioned before, TRMD is my favorite product tanker operator on a risk-reward basis. If markets were to remain low, the company has the financial strength to continue humming along, whereas if markets are strong, its dividend policy coupled with the current discount to NAV offer significant upside.
Source: Yahoo Finance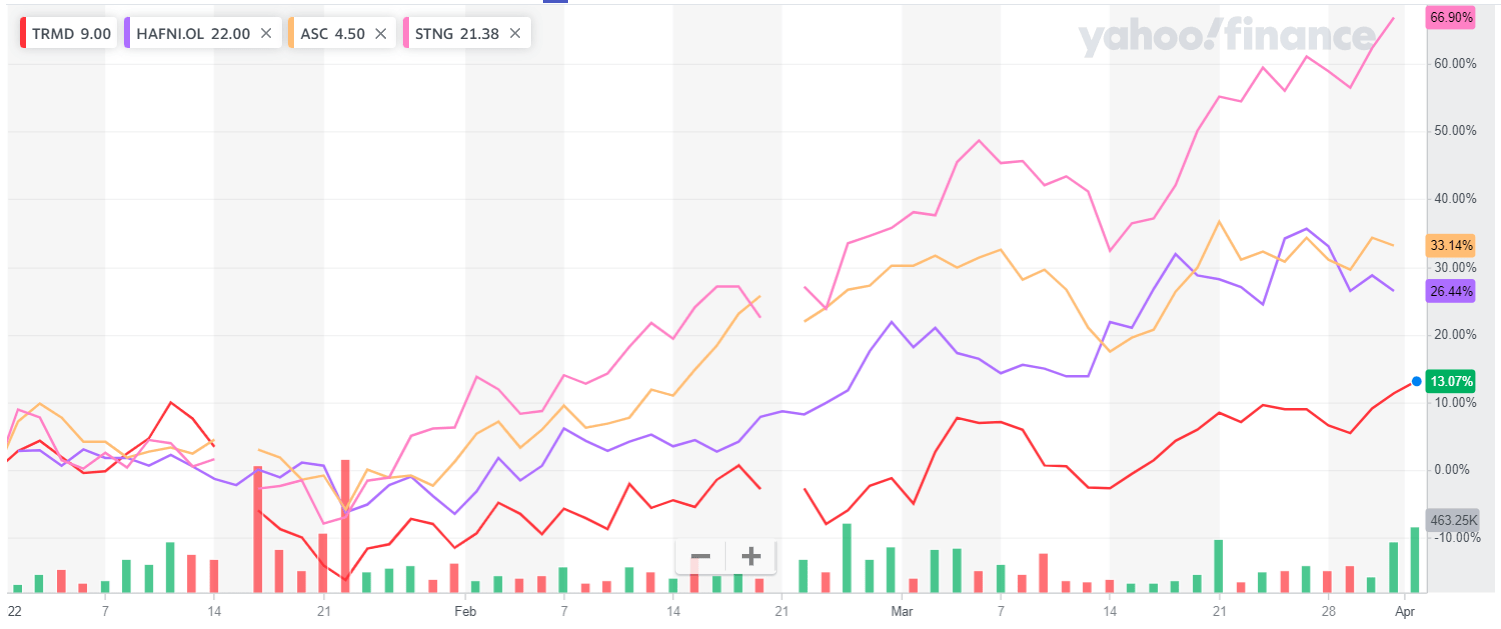
Scorpio Tankers: High Trading Liquidity & Investor Awareness
Scorpio Tankers is the most well-known product tanker player and they previously attained a premium valuation just prior to the pandemic. However, they were the most levered company going into the downturn, which weighed on performance over the past year and a half. Nonetheless, management has done an outstanding job refinancing their debt and maturities, freeing up liquidity to avoid disastrous dilution below NAV (although in the previous downturn they raised significant amounts of equity at a discount to NAV).
More recently, the company decided to sell its LR1 exposure to Hafnia Tankers, raising additional liquidity and putting to rest concerns over their ability to survive the current downturn. Furthermore, the company subsequently agreed to sell three vessels (two LR2s and one MR) for an en-bloc price of $112.5M, $86M for the two 2015-built LR2s and $26.5M for the $2014-built MR.
Even after recent sales, the company remains quite levered, which can be seen as a plus or a negative depending on the view one has on the product tanker sector. If rates run, STNG will most likely post very strong returns due to its brand recognition coupled with its leverage, whereas if markets remain weak, the company may underperform due to its higher leverage.
Furthermore, should rates rise significantly, the company will most likely use most of these cash flows to reduce debt levels (instead of immediately pursuing the institution of a dividend generous dividend policy or a significant share repurchase program). However, during the current downturn, the company did repurchase some shares, and after recent vessel sales, I would not be surprised to see additional buybacks, albeit most likely limited in scope.
Ardmore: Potential Buyout Candidate
Ardmore Shipping used to trade at a premium valuation prior to the current downturn due to its modern and small fleet, which made it at a very attractive acquisition candidate. However, the company is now trading at a substantial discount to NAV, providing an interesting opportunity.
If M&A were to occur in this industry, ASC is the obvious buyout candidate with a fleet composed of MRs and chemical tankers (although with no scrubbers installed, which will weigh on near-term performance).
Note that the company also has higher leverage (relative to Torm), in-line with STNG’s after the latter’s recent divestments. ASC decided to acquire a stake in a hydrogen company (e1) while also participating in a JV for the application of e1’s systems in the shipping sector (e1 Marine).
These investments are not generating any returns in the near-term but could prove to be an interesting avenue in the medium to long-term as new propulsion technologies become readily available and go mainstream in the shipping sector.
Overall, Ardmore has posted mediocre operational performance over the past couple of years, but the company does not have any scrubbers installed (which partly explain this weaker performance). If the market strengthens, ASC will most likely post attractive returns, not only due to its increased cash flows, but also due to the increased likeliness of being acquired should the discount to NAV persist (when companies are flush with cash, they are more likely to become involved in M&A).
Conclusions
The product tanker sector, similarly to crude tankers, has been under pressure over the past year and a half, but some green shoots are starting to emerge, with rates now sitting at attractive levels on most routes and for different vessel classes.
Scrubbers are providing attractive returns in the current environment, and Scorpio Tankers is the main beneficiary from this trend followed by Torm, which also has significant scrubber prevalence. Additionally, bunker fuels are also becoming increasingly expensive, which benefits modern fleets due to their lower fuel consumption (STNG is the main beneficiary of this trend).
However, operational performance is different on a company-by-company basis, and Torm has arguably been the best performer on the LR1 and MR classes. Hafnia is also a strong operational performer, whereas STNG arguably comes in last on a relative basis, since they have been unable to outperform peers on a historic basis, even with the youngest fleet and the highest scrubber prevalence. Going forward, due to the extremely high bunker fuel prices and high scrubber spreads, STNG’s performance should receive a noticeable uplift.
On a risk-reward basis, I believe the most attractive pick in the sector is Torm (TRMD) due to its significant discount to NAV, excellent operational performance, manageable debt levels, and attractive shareholder returns program. As we have recently seen in the bulker sector, dividend payers (with generous policies) are awarded higher valuations than its counterparts, and Torm stands to benefit from this trend as they will likely be the first to pay large dividends if the cycle turns up.
STNG is the most well-known company in the sector in the US markets, while also having the highest trading liquidity in the segment. After recent vessel sales, the company has put to rest concerns over a potential equity raise at a discount to NAV, and although risks remain, the company seems poised to post very attractive returns if markets continue strengthening (although operational performance on a relative basis has been on the weaker side).
ASC is in a similar situation; it has high leverage, but if markets strengthen the company will post very strong results for this very same reason. Leverage is a double-edged sword, and although it has weighed on STNG’s and ASC’s performance over the past couple of years, it will provide substantial benefits if the market strengthens. Additionally, note that ASC is the most likely takeover candidate in the sector due to its arguably small and modern fleet.
International Seaways (INSW) also deserves a honorable mention due to its significant exposure to the MR segment, although it also has significant crude exposure. The company trades at a very attractive discount to both NAV and to GAV, and I believe its management to be a very capable team.
Deciding which company is more attractive on a risk reward basis is no easy feat, and the conclusion can vary among investors. Overall, Torm offers attractive upside with decent downside protection with its lower-than-average leverage and strong operational performance, whereas Scorpio Tankers and Ardmore Shipping offer more upside leverage if markets run hot in 2022 and 2023.
Be the first to comment