

1111IESPDJ
By Sam Peters | Jean Yu
Uncertainty Overshadows Strong Value Signals
Market Overview
The easiest way to navigate difficult and unfamiliar terrain is to use a map to help you get from where you are to where you want to go. However, even with a current and detailed map, it can be all too common to get lost if you have difficulty understanding its scale. Similarly, when mapping a path across an increasingly hostile market landscape, investors must understand that the scale of a financial map is measured in time.
As long-term value investors, our market maps are scaled to navigate cycles that typically last a decade or more and we track our progress through the careful observation of market changes. Although we find ourselves amid near-term challenges, we can chart a course forward thanks to some extremely compelling positive signals we see on the horizon.
One of the powerful signals is that cheap valuations correlate very highly with long-term returns, making valuations one of the most important initial conditions over a market cycle (Exhibit 1). Regardless of whether that cycle is led by growth or value, winning stocks are born of investor neglect and depressed valuations. Why?
Exhibit 1: Cheap Stocks Win Over Time
As of Sept. 30, 2022. Source: Bloomberg Finance, L.P., ClearBridge Investments.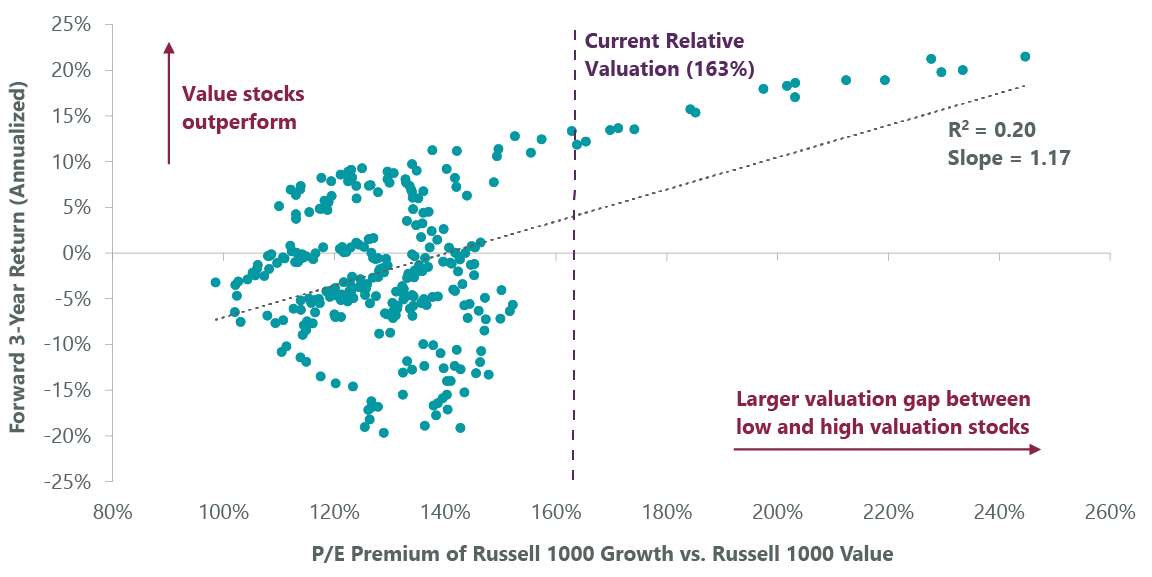
The first reason is simply probability. As real in finance as it is in physics, the law of entropy (that objects move from low probability states to higher probability states over time) illustrates that a prolonged period of historically low valuations is not sustainable.
Instead, over a market cycle, it is nearly inevitable that the extreme pessimism embedded in value stocks will dissipate, and prices will rise closer to historic averages. Whether through simple probability or through the impact of positive catalysts such as strategic actions, management changes or changes in the economic environment, the market will work its magic in addressing valuation extremes.
The second reason is the power of long-term capital cycles that are driven by the feedback between valuation and capital investment. As valuations decline, investment capital declines, which then further lowers valuations. Inevitably, capital investment shrinks to unsustainably low levels resulting in too little supply, driving pricing power and higher returns on capital. This combination of extremely depressed stocks and improving fundamentals is a powerfully bullish combination.
Our long-term market map argues strongly that we are early in a cycle that will be led by value. The initial valuation of value got to its lowest level ever in 2020 and, despite almost two years outperformance over growth, the value of value has still only been cheaper roughly 5% of the time (Exhibit 2). We have pointed out this valuation gap several times since the start of the pandemic. Despite the modest increase in value’s value since the lows of 2020, the law of entropy indicates that this low probability state is not sustainable.
Exhibit 2: Value Remains Historically Undervalued
As of Sept. 30, 2022. Source: Bloomberg Finance, L.P., ClearBridge Investments.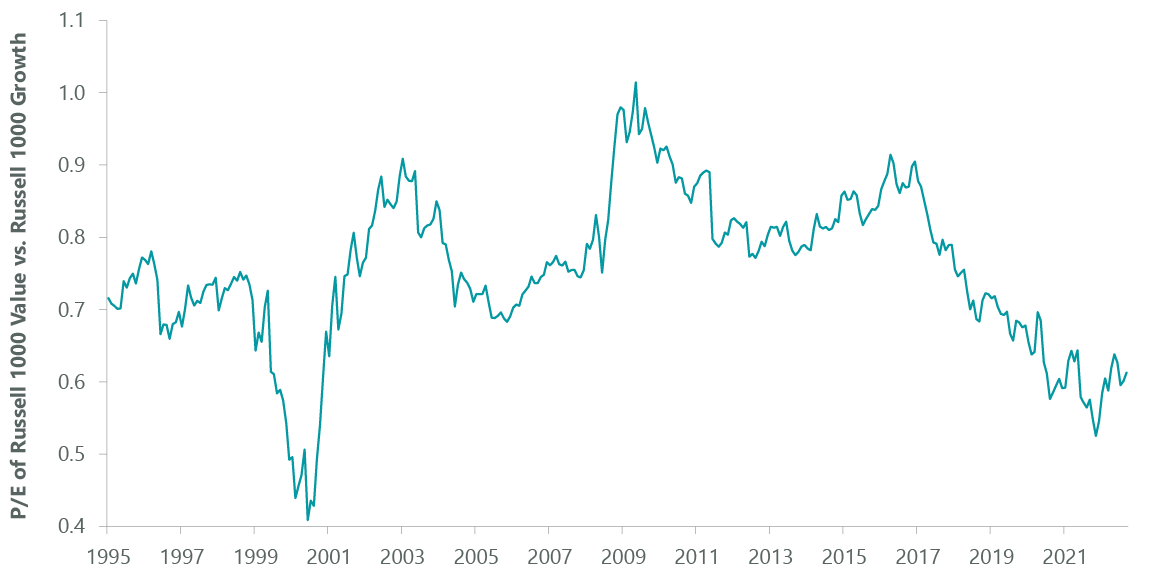
These extremely low valuations have led to underinvestment in two critical value sectors: energy and materials. The result has been a powerful rebound in fundamentals as higher prices have driven an explosion in free cash flow and much higher returns. Despite the rise in returns, with the value of value stuck near historically low levels, capital spending in these sectors remains at record lows, sustaining the strong fundamentals.
Using our long-term market map, the way forward is clear: press on through short-term volatility and stay the course on value. The capital-cycle feedback loop will start to draw investor capital to value, powering depressed valuation multiples higher over the next few years, ironically setting up the ensuing growth cycle and likely resulting in the end of value outperformance. However, this transition is still years away, particularly given that capital spending in critical areas like energy remains significantly depressed.
Unfortunately, our short-term market map suggests increasingly broad fundamental pain ahead. As the probability of a global recession and liquidity crisis keeps rising, overall market earnings estimates are particularly vulnerable to negative revisions as peak profit margins succumb to the toxic combination of inflationary cost pressures and slowing demand. As a result, we concur with the consensus view that broad earnings estimates are too high. The critical question is by how much.
In searching for these answers, many investors find themselves off course due to their insistence on using outdated, deflationary market maps despite traversing a wholly different inflationary landscape. We see this as an advantage and have extensively stress tested our portfolio against the expected outcomes investors are most heavily anchored to. Specifically, these scenarios are the global financial crisis (GFC) which obliterated financial sector earnings, our largest absolute sector weight, and the industrial recession in 2016 that decimated energy sector earnings, our largest relative sector weight.
This very conservative approach captures the cyclical earnings risk we are actively taking if the forthcoming potential recession played out similarly to those in the past. While a repeat of history would result in significant short-term pain, with a nearly 20% decline in the portfolio’s 2023 consensus earnings estimate, even this would still leave the portfolio at 12-15x stressed earnings estimates and a substantial relative valuation advantage to the overall market. Additionally, the incredible balance sheet strength of our portfolio holdings represents an immense improvement from these prior periods.
“The way forward is clear: press on and stay the course on value.”
During the GFC, U.S. financial stocks had overly leveraged balance sheets littered with toxic assets, and energy stocks were bleeding cash and trying to bandage the wound with excess debt. Now our financial stocks have the excess capital and earnings power to earn their way through a GFC scenario, and our energy and commodity stocks are approaching net cash balance sheets while generating market leading free cash flow (Exhibit 3).
Exhibit 3: Energy Balance Sheets Are Much Improved
As of Sept. 30, 2022. Source: Bloomberg Finance, L.P., ClearBridge Investments.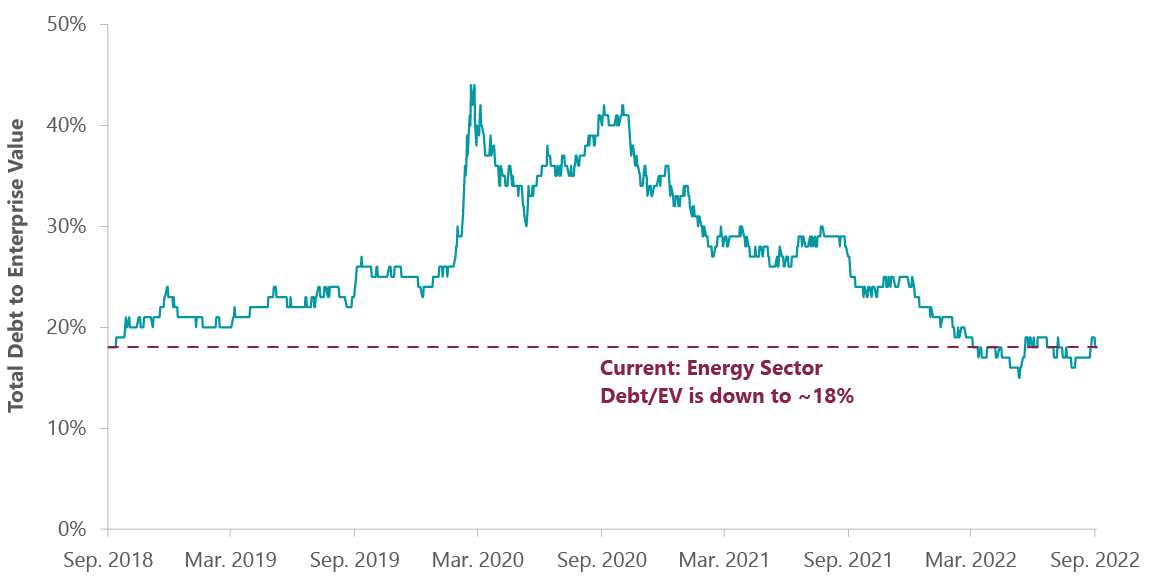
Outlook
Despite such obvious changes in the market landscape, the clearest sign that investors continue to rely on outdated market maps is the relative forward earnings multiples for energy and financials. Despite being at all-time historical lows (Exhibit 4), the market is pricing these stocks as if they have the greatest earnings risk. We have much greater confidence in the cyclical earnings power in our portfolio than that of the overall market and, even if we had weaker convictions, we believe the investment opportunity is abundantly clear given the risks priced into these stocks.
Exhibit 4: Markets Undervalue Financials
As of Sept. 30, 2022. Source: Bloomberg Finance, L.P., ClearBridge Investments.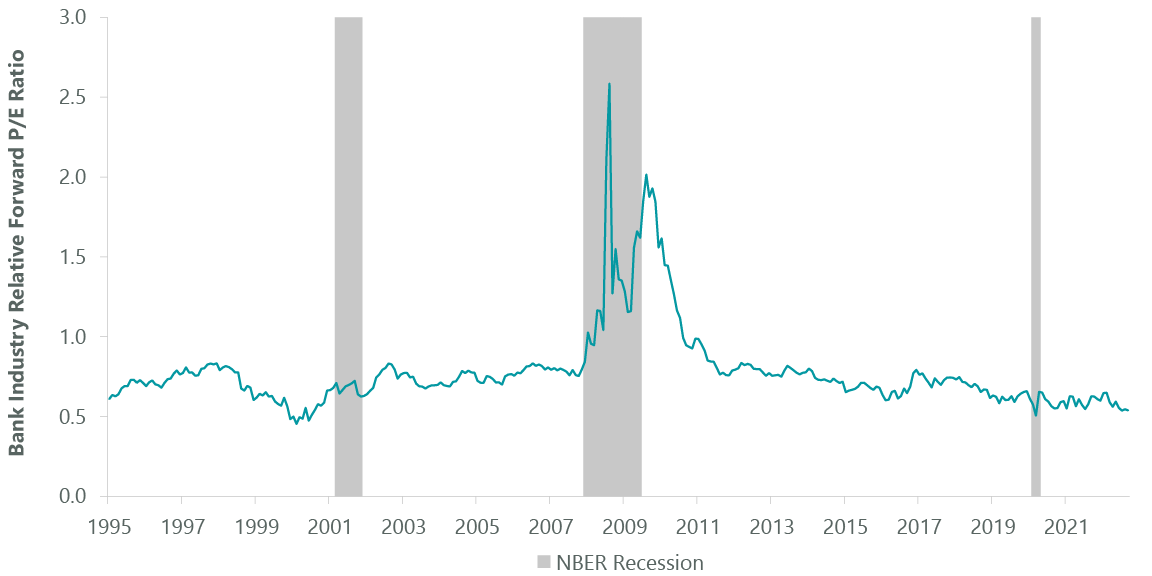
Despite excessive pessimism, investors are correct that market risks are rising. As central banks drain liquidity from the market, there is increased risk of major dislocations reminiscent of the liquidity crisis created by the collapse of Long Term Capital Management in 1998. This is further complicated by the increased debt, greater integration of central banks with financial markets and increased reliance on fiscal policy as the leading economic lever. We expect that, in the event of such a crisis, central banks’ role as the market maker of last resort would necessitate injections of liquidity into financial markets.
Any liquidity injection could further cement value’s leadership by reinforcing economic and inflation volatility, rather than the deflation and abnormally low economic volatility of the last market cycle. This major shift in landscape has yet to fully sink in. As such, we believe the path for the value of value is still higher because of, rather than despite this more hostile environment.
Portfolio Positioning
We have high conviction in our current portfolio positioning but continue to be vigilant for opportunities to exploit the gaps between price and fair value created by market tremors. We maintain an extensive watchlist of companies to replenish our investments as companies reach fair value, or where we exit positions in favor of greater opportunities elsewhere. During the quarter we added three value offense and three value defense stocks, for a total of six new names.
We bought Alcoa (AA), a leading aluminum producer, after the stock sold off over lower commodity prices. The current price of aluminum is unsustainably low, below its cost of production, despite inventories being at historic lows. We believe these depressed prices are due to the evaporation of Chinese demand resulting from its zero COVID-19 policy, but that it will likely recover over the next few quarters.
Additionally, Alcoa is leading the industry in reducing carbon emissions from its smelting process which is helping to improve its cost position relative to global competitors. Given its compelling valuation and strong free cash flow yield, we are confident in the company as it is increasingly relied upon to meet the growing structural demand from electrification and the global energy transition.
AstraZeneca (AZN), a multinational biopharmaceutical company, represents a good addition to the value defense side of our portfolio. We believe AstraZeneca’s durable double-digit earnings growth potential and benign patent expiration risk profile is not reflected in its current valuation, which is at a substantial discount to other “growth” pharmaceutical companies. Combined with the company’s high-potential drug pipeline, particularly in oncology, and management’s history of solid execution, we expect to see the stock rerate higher as the potential of its pipeline materializes.
We also initiated a new position in Goldman Sachs (GS), which is trading far below what we would expect of a well-capitalized financials stock capable of generating an attractive return on equity over a market cycle. The company’s prospects are further enhanced by strong market share gains and further buildout of its fintech consumer finance initiatives.
Additionally, its earnings appear to have stabilized from the peak deal activity and inflated asset valuations of the last market cycle. While we acknowledge that a full-blown recession would put pressure on these earnings, Goldman Sachs has a history of capitalizing on downcycles to solidify its leading investment and trading businesses.
Outlook
Despite the economic uncertainty immediately in front of us, we are confident in our ability to navigate such turmoil without losing sight of value’s long-term path to success. We maintain a high degree of confidence that our portfolio companies’ strong fundamentals will help them to persevere through coming challenges and the probabilities of better outcomes are higher than the market’s expectations. We believe our rigorous, yet flexible, investment process and discipline will help us continue to identify compelling long-term opportunities that these near-term risks should help to crystalize.
Portfolio Highlights
The ClearBridge Value Equity Strategy outperformed its Russell 1000 Value Index during the third quarter. On an absolute basis, the Strategy had losses across nine of the 11 sectors in which it was invested during the quarter. The leading detractors were the health care and materials sectors, while the industrials sector was the top performer.
On a relative basis, overall stock selection and sector allocation effects positively contributed to relative performance. Specifically, stock selection in the industrials, communication services, financials, IT and utilities sectors, an overweight allocation to the energy sector, an underweight allocation to the real estate sector and the Strategy’s cash position benefited performance. Conversely, stock selection in the consumer discretionary, energy and materials sectors weighed on returns.
On an individual stock basis, the biggest contributors to absolute returns in the quarter were Enphase Energy (ENPH), Uber Technologies (UBER), EQT (EQT), Energy Transfer (ET) and M&T Bank (MTB). The largest detractors from absolute returns were Baker Hughes (BKR), Meta Platforms (META), Pfizer (PFE), Coty (COTY) and DXC Technology (DXC).
In addition to the transactions listed above, we initiated new positions in Tenet Healthcare (THC) in the health care sector, Haleon (HLN) in the consumer staples sector and Constellation Energy (CEG) in the utilities sector. We also exited positions in Medtronic (MDT) and Biogen (BIIB) the health care sector and Alibaba (BABA) and Volkswagen (OTCPK:VWAGY) in the consumer discretionary sector.
During the period, portfolio holding East Resources Acquisition (ERESU), a special-purpose acquisition company (SPAC), voted to extend its investment window and allowed the portfolio managers to redeem their investment for cash, which we did.
|
Past performance is no guarantee of future results. Copyright © 2022 ClearBridge Investments. All opinions and data included in this commentary are as of the publication date and are subject to change. The opinions and views expressed herein are of the author and may differ from other portfolio managers or the firm as a whole, and are not intended to be a forecast of future events, a guarantee of future results or investment advice. This information should not be used as the sole basis to make any investment decision. The statistics have been obtained from sources believed to be reliable, but the accuracy and completeness of this information cannot be guaranteed. Neither ClearBridge Investments, LLC nor its information providers are responsible for any damages or losses arising from any use of this information. Performance source: Internal. Benchmark source: Russell Investments. Frank Russell Company (“Russell”) is the source and owner of the trademarks, service marks and copyrights related to the Russell Indexes. Russell® is a trademark of Frank Russell Company. Neither Russell nor its licensors accept any liability for any errors or omissions in the Russell Indexes and/or Russell ratings or underlying data and no party may rely on any Russell Indexes and/or Russell ratings and/or underlying data contained in this communication. No further distribution of Russell Data is permitted without Russell’s express written consent. Russell does not promote, sponsor or endorse the content of this communication. Performance source: Internal. Benchmark source: Standard & Poor’s. |
Editor’s Note: The summary bullets for this article were chosen by Seeking Alpha editors.
Be the first to comment