

grandriver/E+ via Getty Images
Introduction
Oklahoma City-based Chesapeake Energy (NASDAQ:CHK) announced its first quarter of 2022 on May 4, 2022. Notably, it was the first quarter with full quarterly production from the Vine assets.
CHK is an essential oil & gas exploration and production company producing assets in the prolific Marcellus, Haynesville, Powder River, and Eagle Ford shale plays.
It is not easy to find pure-play US natural gas companies, and besides Chesapeake Energy Corp., three others come to mind, Antero Resources Corp. (AR), Range Resources Corp. (RRC), and Coterra Energy (CTRA).
As a reminder, Chesapeake Energy completed the acquisition of Vine Energy Inc. On November 1, 2021. This acquisition strengthened CHK’s position in the Haynesville Shale, explaining the big gas production jump this quarter.
Also, on March 9, 2022, Chesapeake Energy completed the acquisition of Chief E&D Holdings, LP, and associated non-operated interests held by affiliates of Tug Hill, Inc. CEO Nick Dell’Osso said in the press release:
The Chief transaction deepens our premium inventory, allowing us to allocate additional capital toward our world class Marcellus Shale position and accelerate returns for our shareholders. With the integration of these assets into our existing portfolio, we look forward to generating greater free cash flow, growing our dividend programs, and improving our GHG emissions metrics as we continue to responsibly deliver reliable, affordable, lower carbon energy in 2022 and beyond.
Note: I have followed CHK quarterly since 2019 with seven articles and counting. This new article is a quarterly update of my article published on December 5, 2021.
1 – 1Q22 Results snapshot
Chesapeake Energy Corp. reported a first-quarter loss of $764 million after declaring a profit in the same period a year earlier.
The company posted a loss of $6.32 per share, with earnings adjusted for non-recurring costs of $3.09 per share. The results beat Wall Street expectations.
Total revenues were $656 million, and revenues including gains on the sale of assets were $935 million. One significant negative earnings item was “Oil and natural gas derivatives,” with a loss of $2,125 million in 1Q22.
Finally, Chesapeake Energy corporation declared a $2.34 per share dividend in June 2022.
Below are shown the highlights from the presentation:
CHK 1Q22 highlights Presentation (Chesapeake Energy)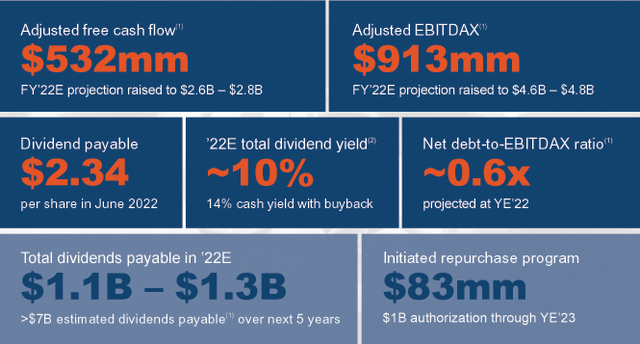
The first quarter marks the first full period we owned the Vine assets. We delivered $532 million in adjusted free cash flow in the quarter setting a new quarterly record for Chesapeake. As a result of this increase and the further uplift we expect following the close of Chief in March, we’ve increased the 2022 free cash flow outlook by $700 million raising the midpoint of our range to $2.7 billion.
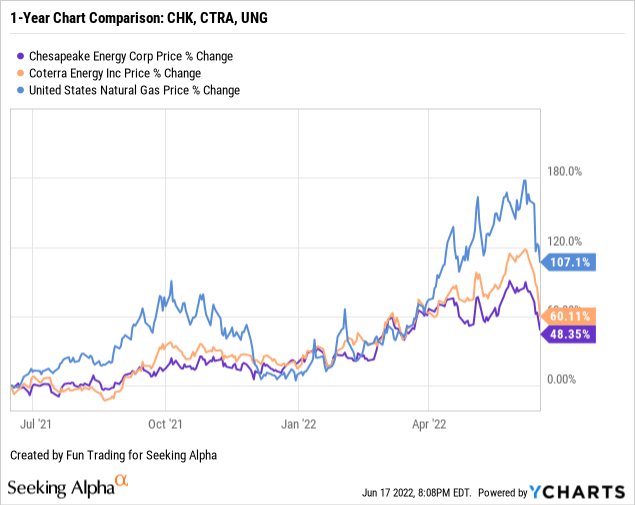
2 – Stock performance
CHK is up 48% on a one-year basis and has significantly underperformed Coterra Energy and UNG ETF.
Chesapeake Energy – 1Q22 Quarterly Financial Table: The Raw Numbers
| Chesapeake CHK | 1Q21 | 2Q21 | 3Q21 | 4Q21** | 1Q22 |
| Total Revenues $ Million | 1,140 | 691 | 887 | 1,131 | 656 |
| Net Income in $ Million | 5,678 | -439 | -345 | 5,678 | -764 |
| EBITDA $ Million | -387 | -421 | -338 | 5,838 | 368 |
| EPS diluted in $/share | 537.26 | -4.48 | -3.51 | 11.13 | -6.32 |
| Operating cash flow in $ Million | 388 | 394 | 443 | 388 | 853 |
| CapEx in $ Million | 143 | 149 | 178 | 143 | 344 |
| Free Cash Flow in $ Million | 245 | 245 | 265 | 245 | 509 |
| Cash and cash equivalent $ Million | 340 | 612 | 849 | 905 | 19 |
| Long term Debt (including short term) in $ Billion | 1.262 | 1.261 | 1.259 | 2.278 | 2.774 |
| Shares outstanding (diluted) in Million | 97.91 | 97.93 | 98.22 | 128.85 | 120.81 |
| Quarterly dividend $ per share | 0.3438 | 0.3438 | 0.4375 | 1.7675 | 2.34 |
| Oil Equivalent Production | 1Q21 | 2Q21 | 3Q21 | 4Q21 | 1Q22 |
| Oil Equivalent Production in K Boepd | 436 | 433 | 436 | 435 | 620 |
| Oil equivalent price realized (composite) in $/Boe | 24.09 | 22.64 | 29.14 | 22.46 | 23.79 |
Source: Chesapeake Energy 10-Q and Fun Trading
* Estimated by Fun Trading.
** During the 4Q21, Chesapeake Energy split the quarter into two periods:
- The period from January 1, 2021, through February 9, 2021.
- The period from February 10, 2021, through March 31, 2021.
Analysis: Revenues, Free Cash Flow, Net debt, And Oil & Gas Production
1 – Quarterly revenues and others were $656 million in 1Q22
CHK Quarterly Revenues history (Fun Trading)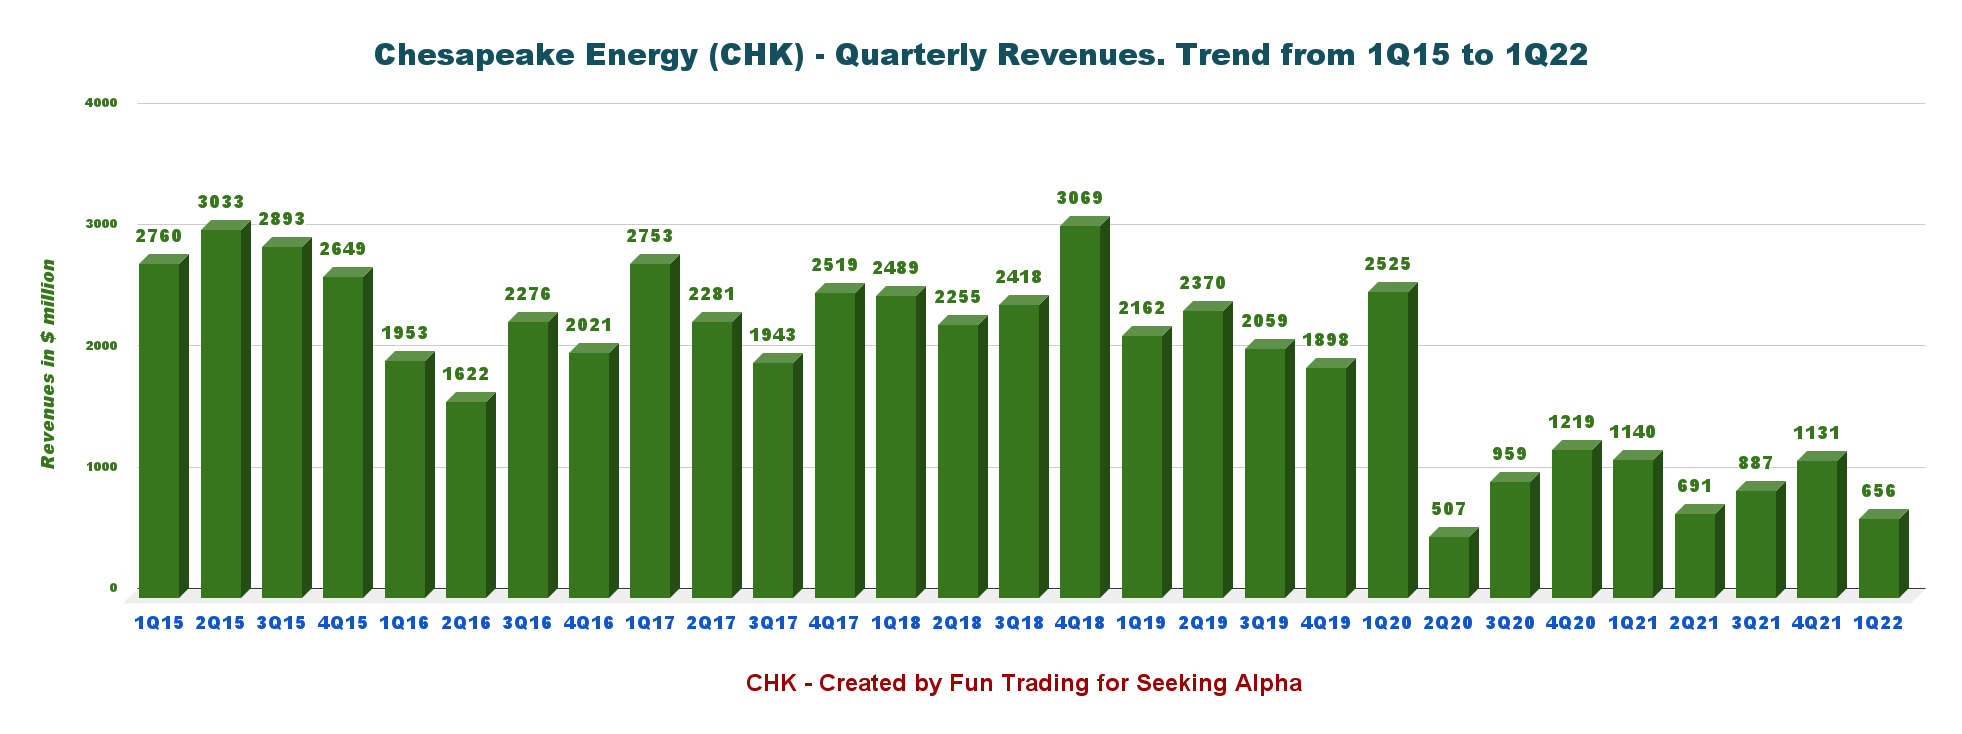
Chesapeake reported a net loss of $764 million in 1Q22 or $6.32 per share. Total revenues were $656 million, and revenues including gains on the sale of assets were $935 million. As I said previously, derivatives costs were very high this quarter, with a loss of $2,125 million.
The company has been busy integrating the Vine’s assets in the Haynesville basin and is fully integrating the Chief’s assets acquired recently in the prolific Marcellus. Also, in the Eagle Ford basin, the company restarted the capital program.
This rapid expansion is paying off with a record adjusted free cash flow of $532 million this quarter (generic free cash flow estimated at $509 million).
CEO Nick Dell’Osso said in the conference call:
We believe these transactions are great examples of how consolidation yields improve cost structures, capital efficiency, and most importantly, accretive free cash flow. Given the depth of our inventory and its resiliency through commodity cycles, we expect to maintain this robust free cash flow profile for a very long time.
This notable progress has been facilitated by a much better outlook for natural gas in 2022. However, the EIA expects the monthly Henry Hub to peak in H2 2022 and quickly retrace in 2023 to around $4 per million British thermal units.
We expect U.S. natural gas prices to remain relatively high in 2022 because of lower-than-average natural gas inventories resulting from factors affecting both supply and demand.
CHK: EIA chart 2022-2023 (EIA)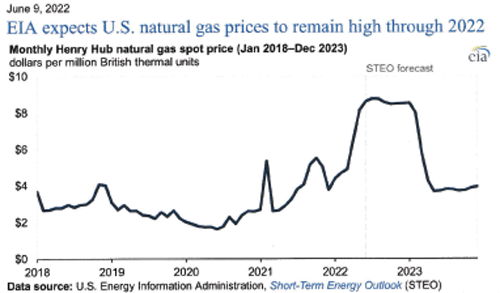
2 – Free cash flow was estimated at $509 million in 1Q22
CHK Quarterly Free cash flow history (Fun Trading)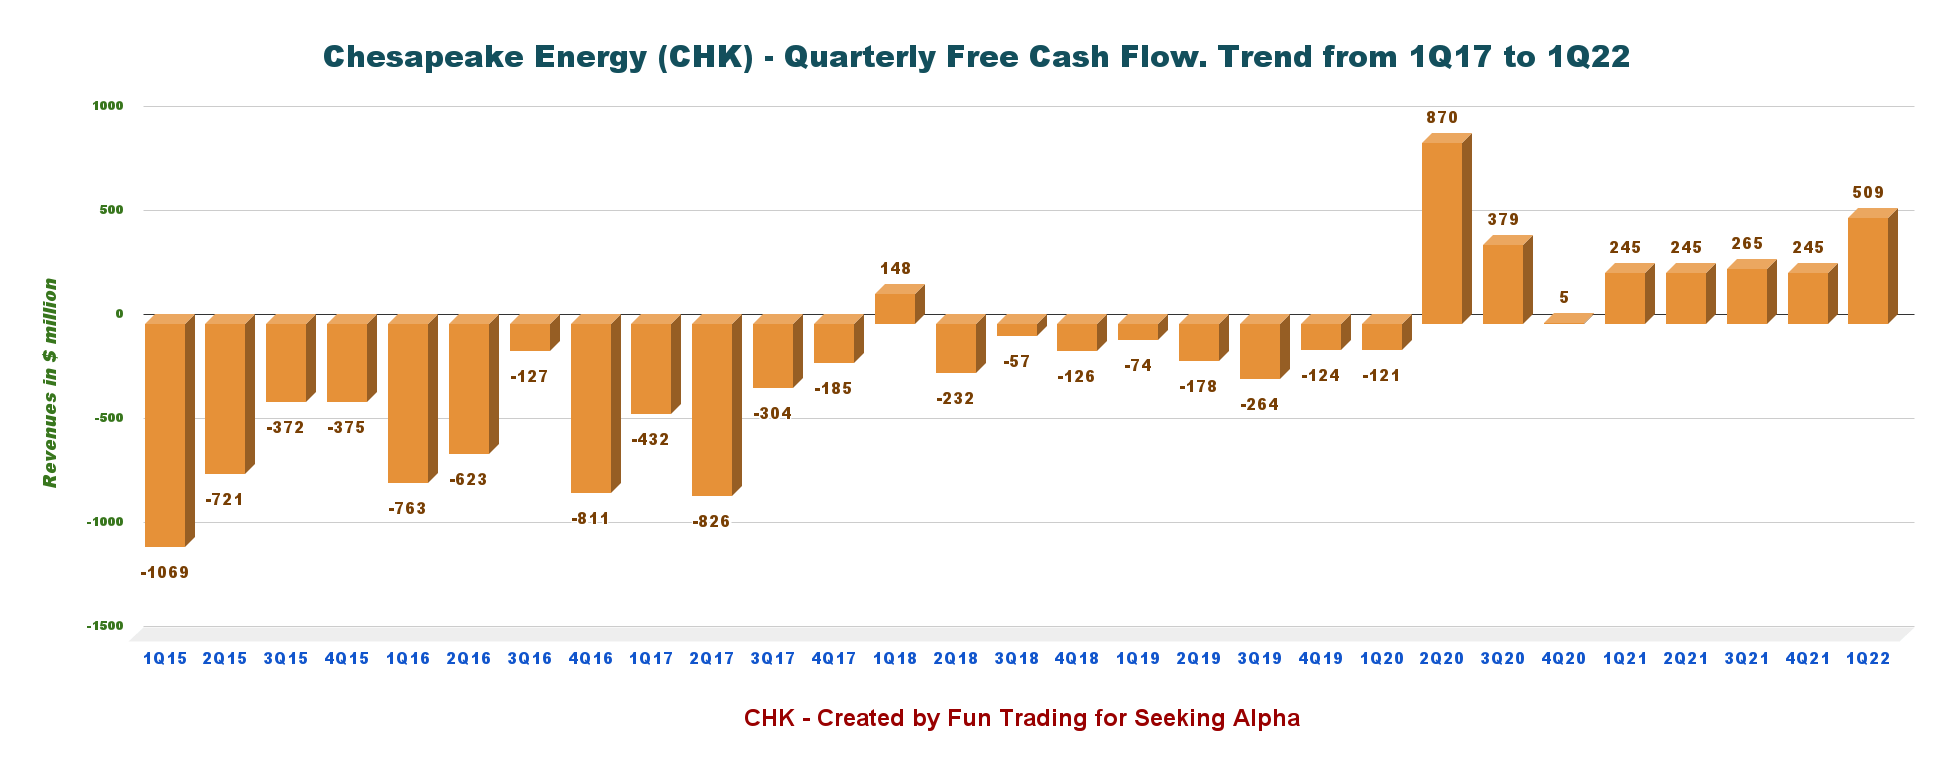
The generic free cash flow is cash from operating activities minus CapEx.
Trailing 12-month free cash flow (“ttm”) is estimated at $1,264 million. The quarterly free cash flow for 1Q22 was $509 million.
CEO Nick Dell’Osso said in the conference call:
…our initial progress on our repurchase program, our first quarter dividend payment reached $2.34 for common share and our dividend yield currently sits around 10% for the full year 2022. If you include this share repurchase program, it reaches 14%. In total at today’s strip, we expect to pay over $7 billion in dividends over the next five years.
CHK Dividend program Presentation (Chesapeake Energy)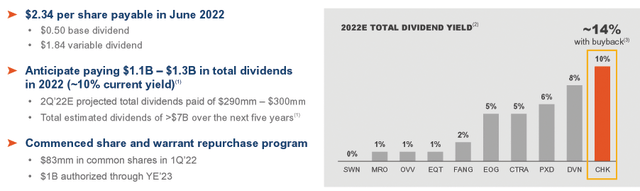
The company initiated a $1 billion share buyback program in the first quarter and is expected to accelerate the pace of the buybacks as it filed the final disclosures related to the Chief transaction this month.
3 – Net debt is $2,652 billion in 1Q22
CHK Quarterly Cash versus Debt history (Fun Trading)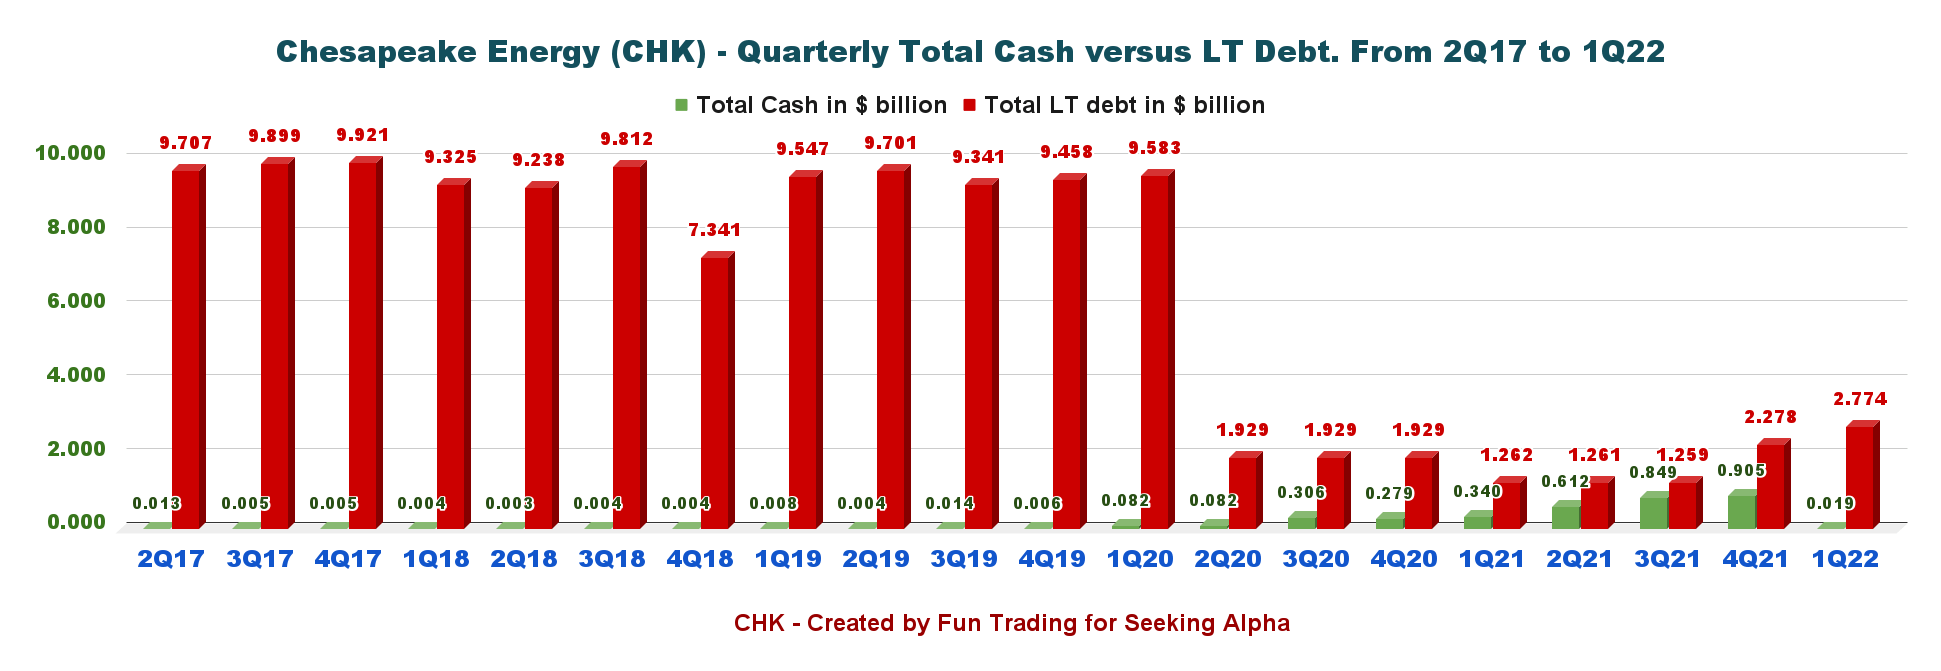
The company reports total debt of $2.774 billion and cash and cash equivalent of $19 million. The net debt on March 31, 2022, is $2.652 billion.
As a reminder, CHK successfully emerged from financial restructuring on February 9, 2021.
4 – Quarterly Production was 620K Boep/d in 1Q22
4.1 – Production was 620K Boep/d this quarter, up 42.2% from the same quarter a year ago and up 42.5% sequentially.
CHK: Quarterly Production history (Fun Trading)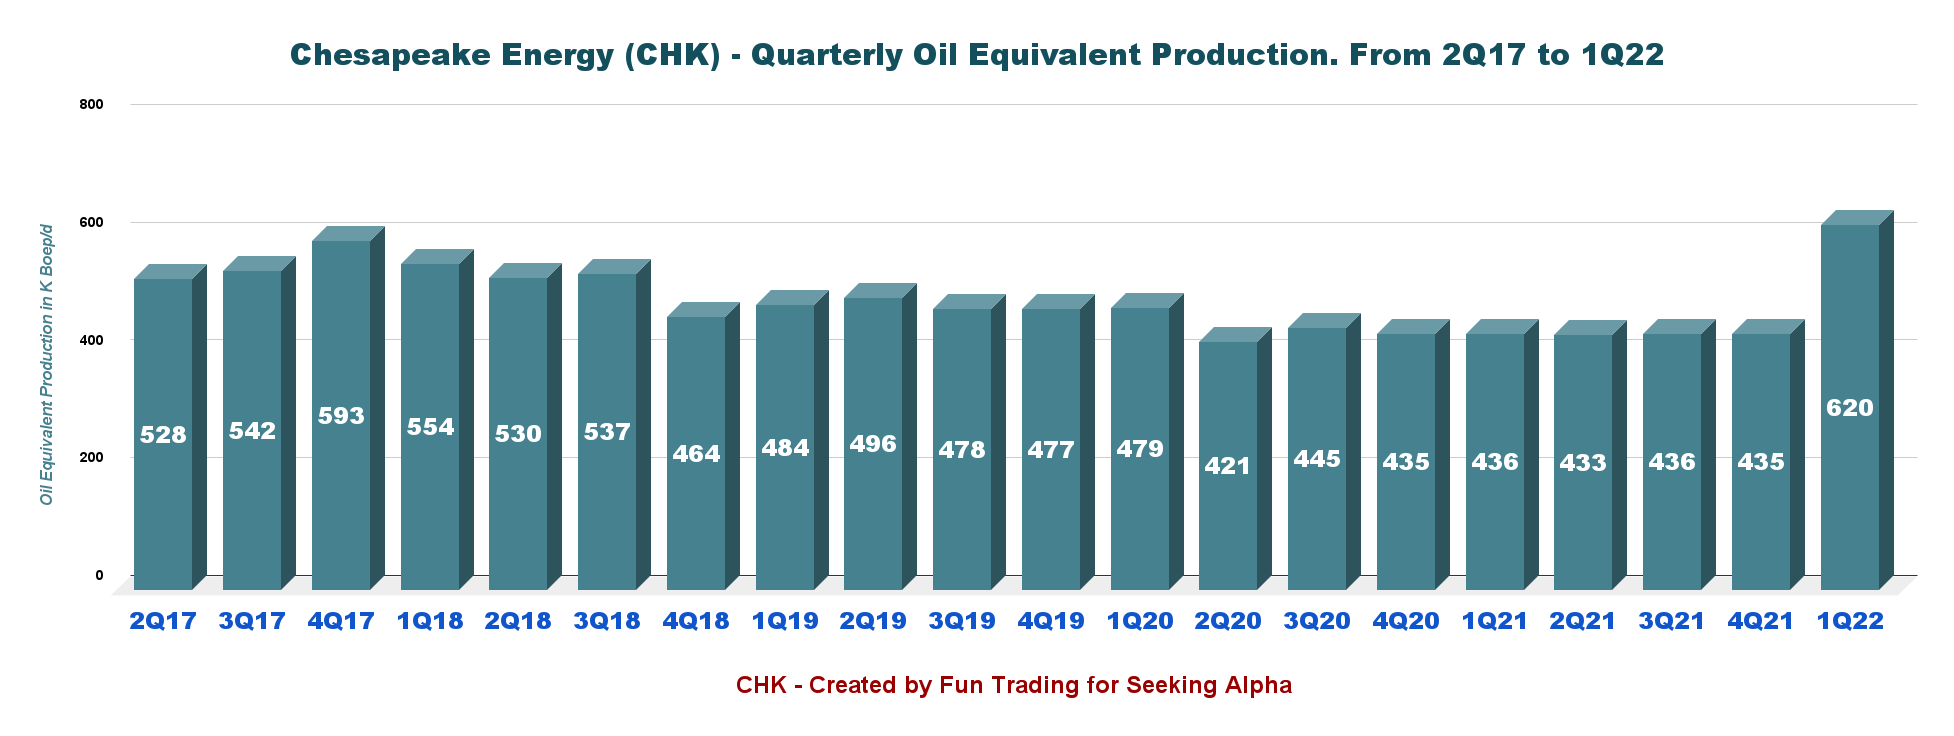
4.2 – The price per Boe (composite) fell this quarter to $23.79 from $24.09 a year ago and up 5.9% sequentially:
CHK Quarterly price per Boe history (Fun Trading)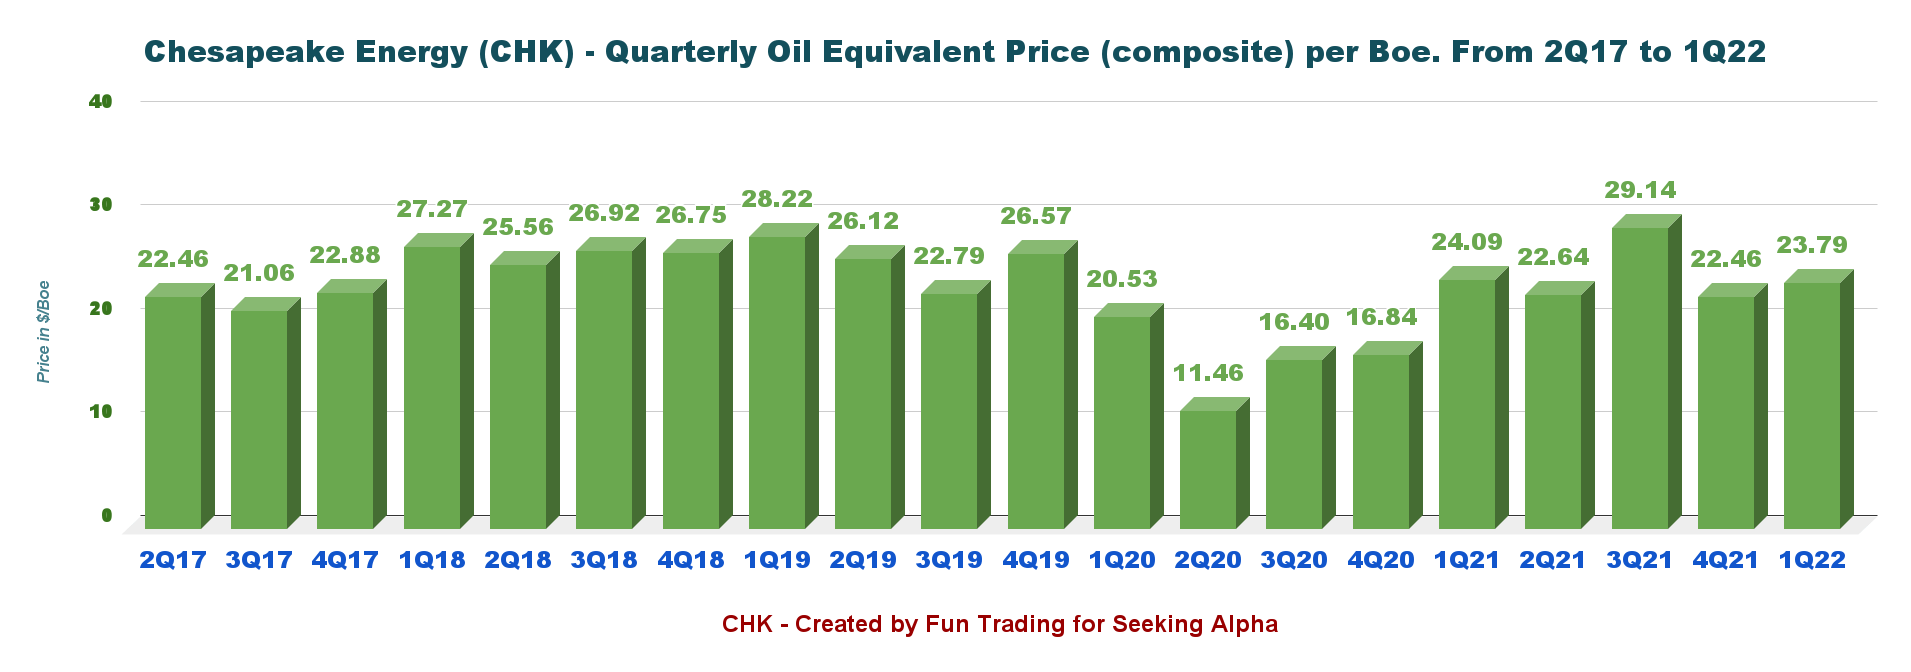
4.3 – Below is the output in K Boep/d per basin in 1Q22. The company produces from four different locations in the USA.
CHK Quarterly production equivalent per region in 1Q22 (Fun Trading)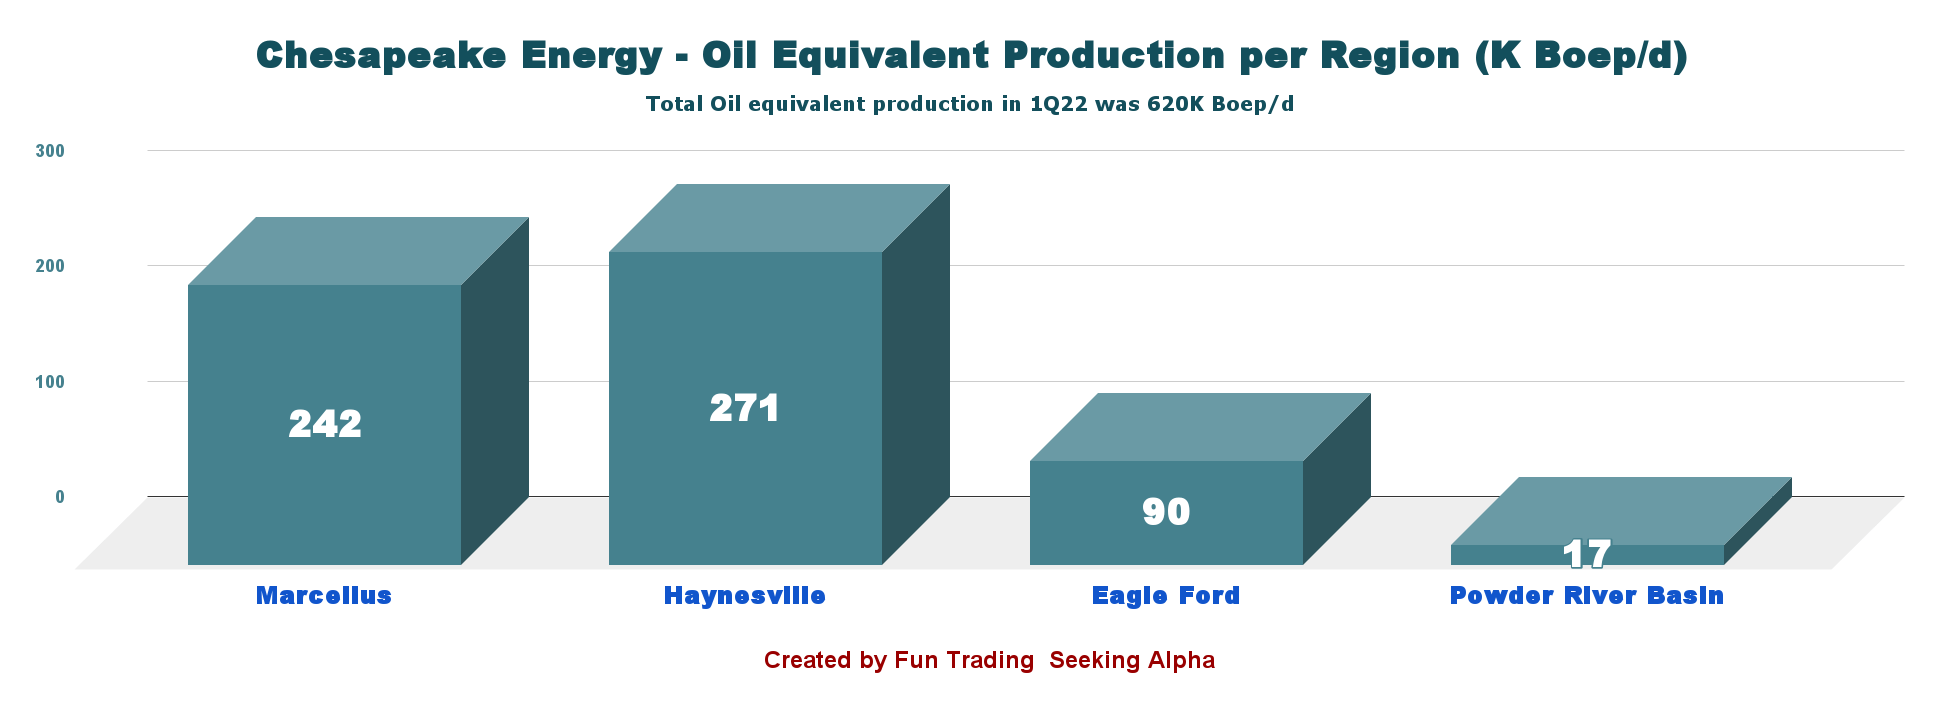
4.4 – Chesapeake Energy is a domestic gas producer representing 87.3% of the total output for the first quarter of 2022.
CHK Production oil NG and NGL in 1Q22 (Fun Trading)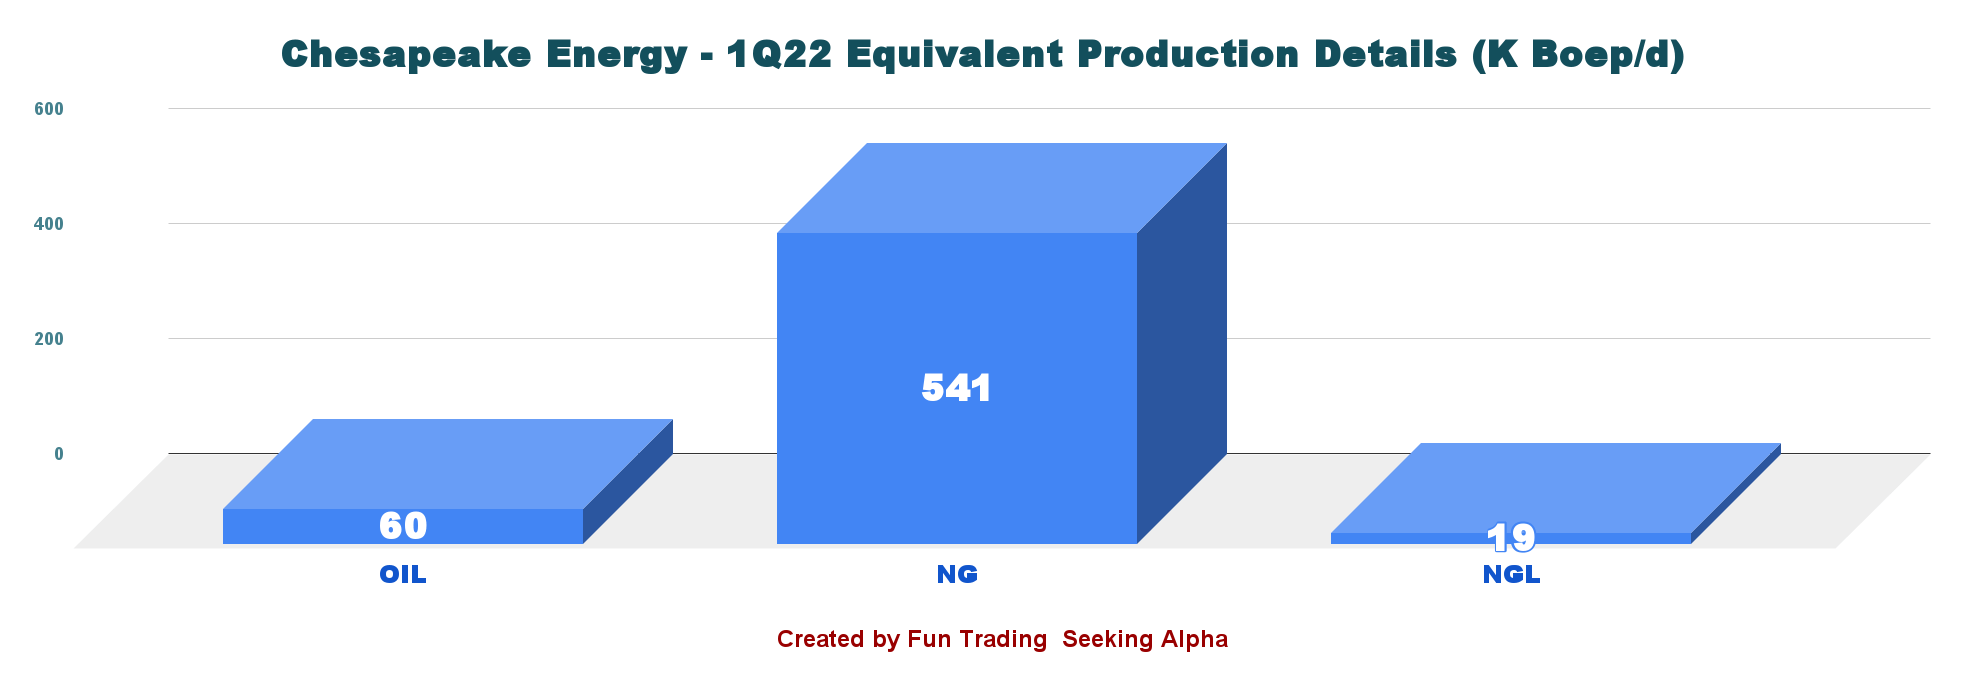
5 – 2022 Guidance
Chesapeake Energy expects full-year 2022 average daily production to be approximately 670-690K boep/d. The company’s planned CapEx for 2022 is $1,500-$1,800 million.
For the 2Q22, the oil equivalent production is expected to increase from 620K this quarter to 685K-690K Boep/d.
CHK Guidance 2022 (Chesapeake Energy)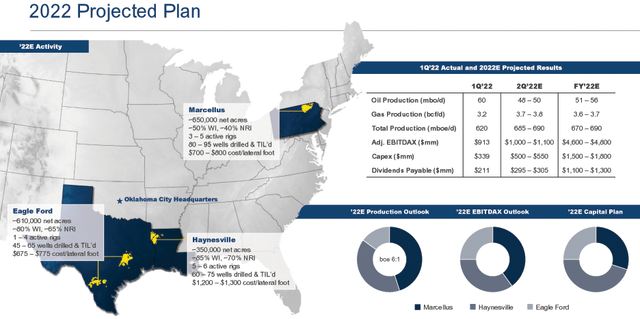
Chesapeake increased its expected 2022 adjusted EBITDAX range from approximately $4.6 billion to $4.8 billion.
Technical Analysis (short-term) and commentary
CHK: TA Chart short-term (Fun Trading)
CHK forms an ascending broadening triangle pattern with resistance at $105 and support at $78.85.
The trading LIFO strategy that I generally recommend in my marketplace, the “The Gold and Oil Corner,” is to sell about 40% at or above $105 and consider accumulating between $79.50 and $78 with potential lower support at $76.25.
The recent 75-point hike by the Fed triggered a big selloff in the oil and gas sector last week, driven by fear of a possible recession by 2023. Hence, we may have entered a period of consolidation in this sector, which was considered overbought. Thus, I suggest buying CHK below $79.50 with a possible bottom at or below $70.
Note: The LIFO method is prohibited under International Financial Reporting Standards (IFRS), though it is permitted in the United States by Generally Accepted Accounting Principles (GAAP). Therefore, only US traders can apply this method. Those who cannot trade LIFO can use an alternative by setting two different accounts for the same stock, one for the long-term and one for short-term trading.
Warning: The TA chart must be updated frequently to be relevant. It is what I am doing in my stock tracker. The chart above has a possible validity of about a week. Remember, the TA chart is a tool only to help you adopt the right strategy. It is not a way to foresee the future. No one and nothing can.
Author’s note: If you find value in this article and would like to encourage such continued efforts, please click the “Like” button below to vote for support. Thanks.
Be the first to comment