

Natalia Lagutkina
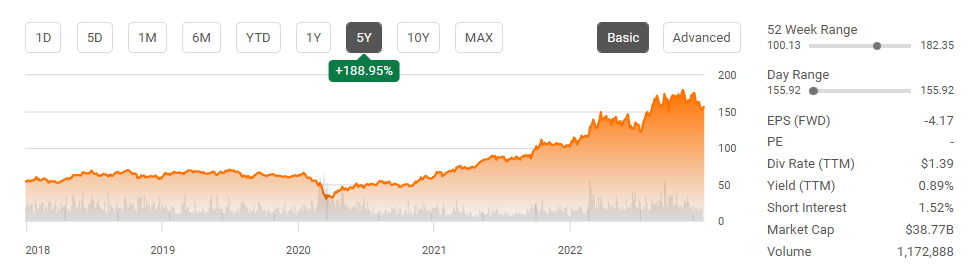
Shares of Cheniere Energy (NYSE:LNG) are off their 2022 highs by -14.49% and, since 12/1/22, have declined -11.17%. Despite the recent selloff, shares of Cheniere Energy have appreciated 52.13% YTD and have been in a multi-year uptrend, increasing 364.32% since its 3/23/20 lows. In the trailing twelve months (TTM) compared to Cheniere Energy’s 2021 fiscal year, revenue has increased 84.31% ($14.55 billion), and its free cash flow (FCF) has increased 328.41% ($4.94 billion). Cheniere Energy is a Houston-based energy infrastructure company that is primarily engaged in liquified natural gas (LNG) activities. At the close of 2021, Cheniere was the largest producer of LNG in the United States and the second-largest producer globally. I have often indicated that I believe there is a strong future for American exporting companies as the demand for energy increases on a global scale. When I look at what is occurring in Europe regarding LNG and the exporting capacity in the United States, Cheniere continues to look like an attractive equity for years to come. Shares of Cheniere have started to retrace, and they could decline further, but the global energy landscape is set up favorably for Cheniere in 2023.
Seeking Alpha
2022 has been a monster year for Cheniere Energy, and the financials are misleading due to GAAP Accounting Principles.
Looking at Cheniere Energy’s income statement, you would probably wonder why I am bullish on a company that has generated negative operating income and net income in 2021 and the TTM. These aspects aren’t just in the red, they have grown YoY, and in the TTM, Cheniere has generated -$3.83 billion in net income compared to -$2.34 billion in 2021. Cheniere Energy is a prime example of why calculating and researching a company’s FCF is important because in some industries, GAAP Accounting Principles can impact net income in a way that isn’t necessarily fair.
Cheniere Energy’s long-term integrated production marketing (IPM) gas supply agreements are structured to provide stable margins on purchases of natural gas and LNG sales over the agreement’s life. These IPM agreements have a fixed fee component, similar to long-term, fixed-fee LNG SPAs. Unfortunately for Cheniere Energy, the long-term duration and international price basis of its IPM agreements make them particularly susceptible to fluctuations in fair market value over time. Accounting requirements prescribe recognition of these long-term gas supply agreements at fair value but does not permit fair value recognition of the associated sale of LNG, resulting in a mismatch of accounting recognition for the purchase of natural gas and sale of LNG. Cheniere Energy continues to be impacted by the unrealized noncash derivative impact related to its IPM agreements. In Q3 specifically, Cheniere recognized $4.9 billion of unrealized noncash losses due to LNG margins increasing and commodity price volatility. GAAP accounting principles require mark-to-market accounting for IPM agreements, and it doesn’t allow Cheniere the latitude of mark-to-market of the associated and offsetting sale of LNG.

Cheniere
This is why I am looking at one of my favorite metrics, FCF, to determine Cheniere’s level of profitability. In 2021, Cheniere generated $17.26 billion in revenue, and in the TTM, this has increased by 84.31% ($14.55 billion) to $31.82 billion. This has allowed Cheniere to generate an additional $5.51 billion in cash from operations over this period, which has led to its FCF increasing by 328.41% YoY to $4.94 billion in the TTM. If Cheniere wasn’t profitable, it wouldn’t be in a position to pay down debt, increase its share repurchase plan, or increase its dividend.
The board of directors revised Cheniere’s share repurchase plan, and on 10/1/22, Cheniere announced that they were extending the share repurchase plan by 3 years and authorizing an additional $4 billion to be allocated for repurchases. During Q3, Cheniere repaid over $1.3 billion of consolidated long-term debt; over the past year, Cheniere has reduced its long-term debt by -$4.12 billion or -14%. Cheniere also increased its quarterly dividend of $0.33 by 20% to $0.40 during Q3. Cheniere is firing on all cylinders as it’s able to significantly reduce its debt load while enhancing its capital allocation plan to benefit shareholders.
The global energy landscape sets up well for Cheniere in 2023
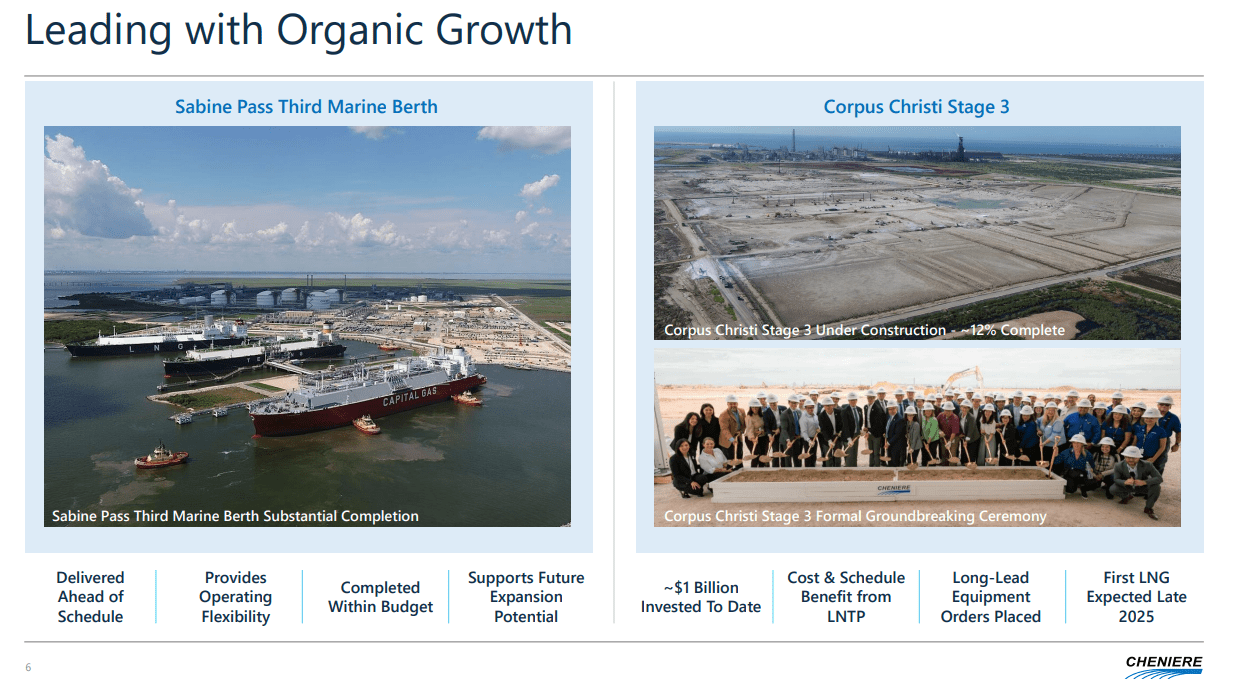
In Q3, Cheniere reached a daily production record, producing in excess of 7 TBtu of LNG and a daily record at Sabine Pass of approximately 5 TBtu of LNG. Cheniere also produced and exported 156 cargoes of LNG from its facilities, of which 70% was destined for Europe. The third marine berth at Sabine Pass has been completed, which will provide increased flexibility to Cheniere’s marine loading operations. Cheniere has invested roughly $1 billion in Corpus Christi Stage 3. Cheniere is expecting to generate its first LNG from Stage 3 in late 2025. Cheniere has also signed additional long-term contracts with PetroChina and PTT to supply LNG starting in 2026 for 20 and 25-year durations on a DES/DOB basis.
Cheniere
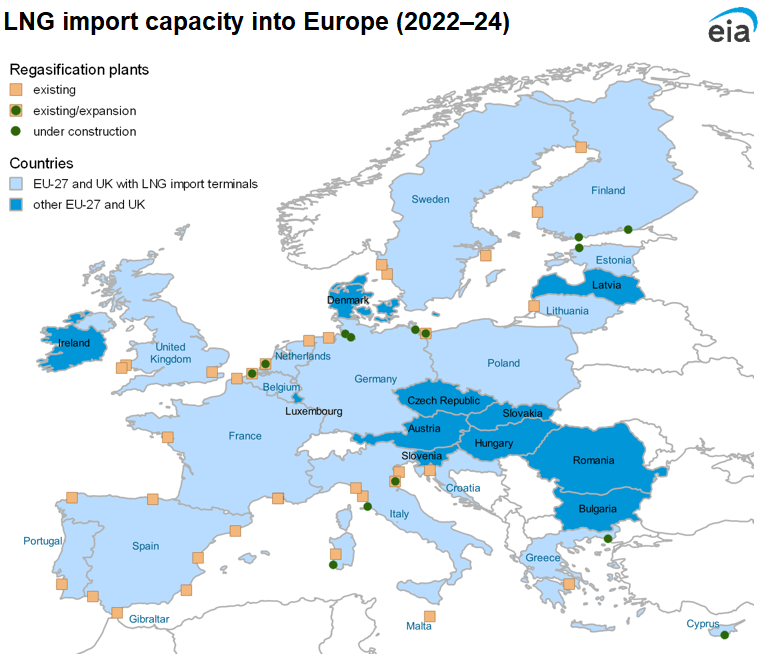
The way the global energy landscape is unfolding is exceptionally bullish for Cheniere Energy. The United States Energy Information Administration is projecting that liquified natural gas (or LNG) terminals across the European Union will expand their capacity by 5.3 billion cubic feet per day (Bcf/d) by the end of 2023. In 2024, this capacity will expand by another 1.5 Bcf/d for a total of 6.8 Bcf/d of new LNG regasification capacity added in the region (34% expansion) compared with 2021. Between January and November 2022, an estimated 1.7 Bcf/d of new and expanded LNG regasification capacity was added in Poland, Italy, the Netherlands, Finland, and Germany. By the end of 2023, LNG regasification terminals that are currently under construction in Germany, Poland, France, Finland, Estonia, Italy, and Greece will add 3.5 Bcf/d of new capacity.
EIA
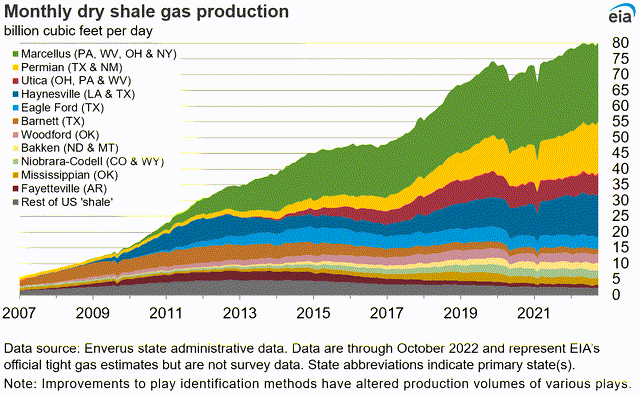
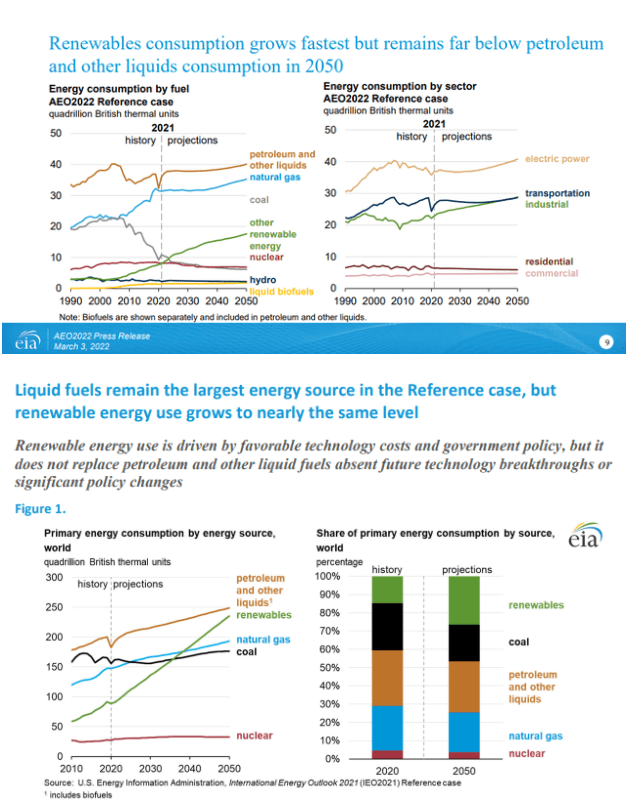
Natural gas production in the United States has increased by 51.31% over the past decade, as it increased by 316.8 billion cubic meters. According to the EIA, we have seen the most production increase come out of the Marcellus shale and Permian Basin. On 3/3/22, the EIA released its 2022 Annual Energy Outlook and concluded that petroleum and natural gas remain the most consumed sources of energy in the United States through 2050 (1st slide below). The EIA publishes its international energy outlook every 2 years, and the last one was published prior to the war in Ukraine. In 2021, on a global scale, the natural gas consumption rate will increase by roughly 18% by 2050 per the EIA’s projections (2nd slide below). Their next report is slated for 2023, and it will be interesting to see how things have changed due to the growing demand for natural gas overseas.
EIA
EIA
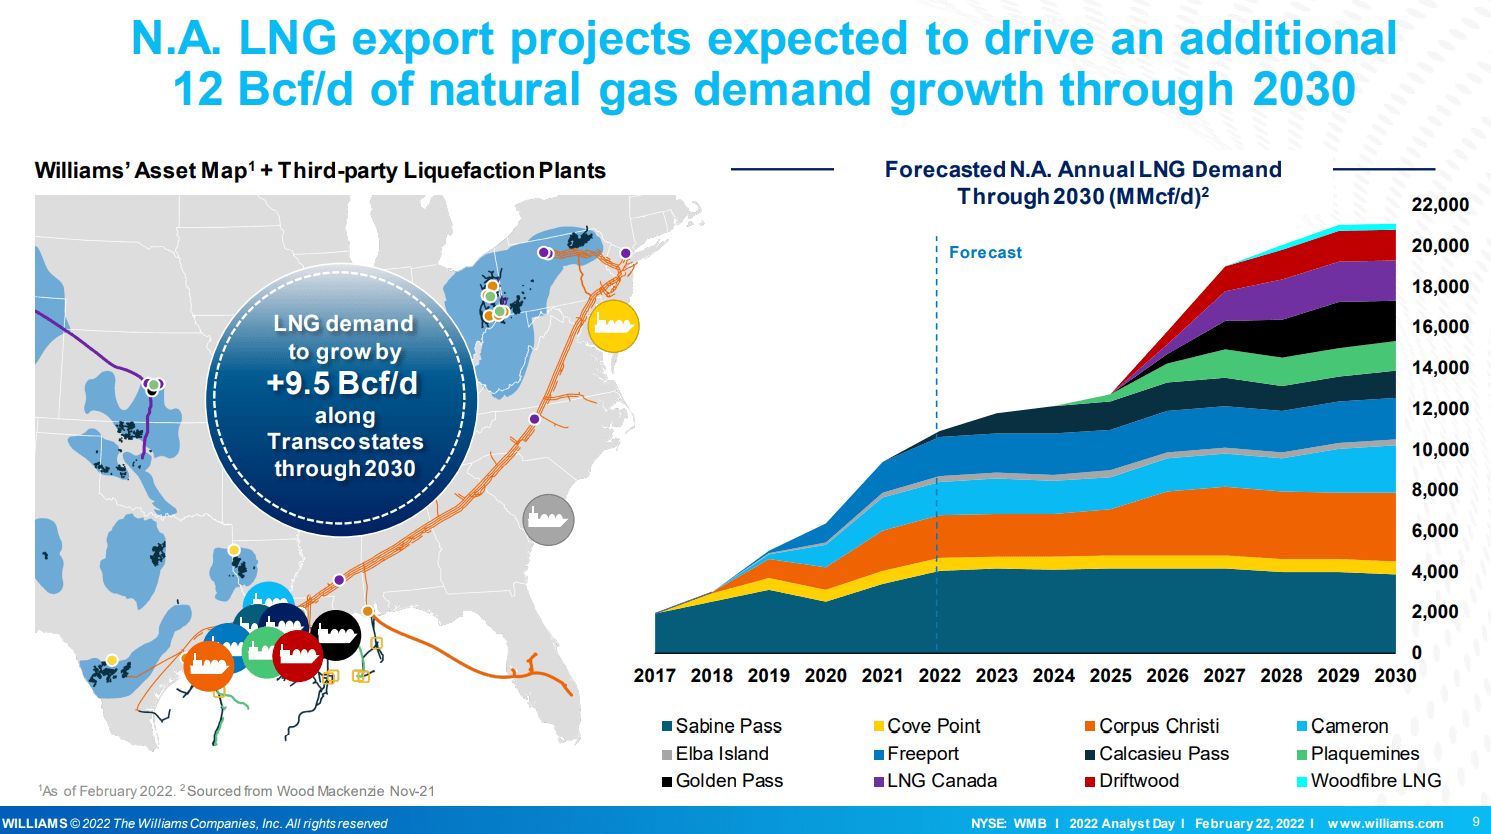
While the EIA has projected the LNG export demand out through 2050, Williams Companies (WMB) has indicated that LNG demand will grow by 9.5 Bcf/d through 2030. They also provided a forecasted annual LNG demand per export facility.
Williams Companies
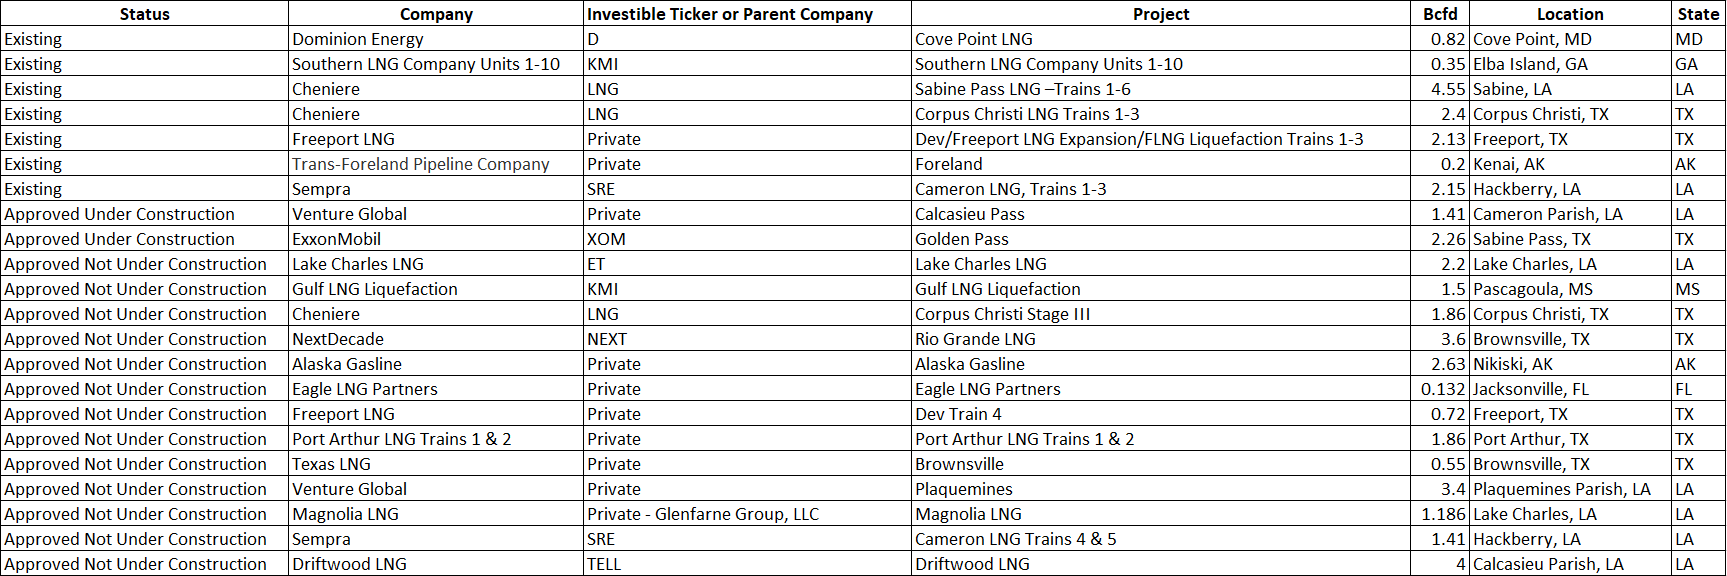
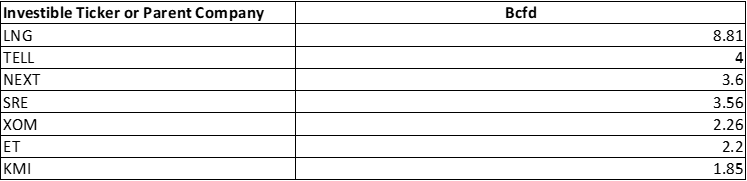
I decided to work backward and identify which companies will have the largest amount of exporting capability through LNG export facilities. I went through the data from the Federal Energy Regulatory Commission (FERC) and identified every investible company for LNG export facilities. In my table below, I have existing facilities, approved facilities that are under construction, and approved facilities where construction hasn’t started. I identified the parent company of each facility, listed the investible ticker symbol or if the company is private, and listed some other critical information.
Steven Fiorillo, FERC
While Cheniere has the largest LNG export capacity, I will only cite public companies, even though I listed the private ones in the chart above. Cheniere has the largest existing export capacity with 6.95 Bcf/d followed by Sempra (SRE) with 2.15 Bcf/d, then Dominion (D) with 0.82 Bcf/d, and Kinder Morgan (KMI) with 0.35 of Bcf. There are currently two approved projects under construction and an additional 13 projects which FERC has approved, but construction hasn’t commenced yet. After all of the approved projects have been completed, Cheniere will still have more than double the LNG Export capacity of the 2nd closest rival.
Steven Fiorillo, FERC
Conclusion
Europe isn’t bringing more LNG capacity online while building new LNG import facilities, and Chinese companies aren’t entering into multi-decade LNG contracts because natural gas is being utilized less. In addition to reports from the EIA, 2022 is proof that renewables aren’t going to eradicate oil & gas anytime soon. The United States is the largest oil and gas-producing nation in the world. The United States produced 934.2 billion cubic meters of natural gas throughout 2021, which was 23.14% of the global natural gas production level. The demand for LNG abroad continues to increase, and the amount of companies with export facilities is limited. Cheniere Energy has a stranglehold on LNG exports, and when all of the approved projects come online, it will still have more than double the exporting capacity as the next largest exporter. 2022 has demonstrated the growth potential for Cheniere as its revenue and FCF have grown immensely. I think the energy landscape is setting up well for Cheniere, and that share could exceed $200 in 2023 if its revenue and FCF continue to grow, and Cheniere continues to return capital to shareholders and deleverage its balance sheet further.
Be the first to comment