

da-kuk
Investment Thesis
Though the Chainlink (LINK-USD) project has been finely developed by its core team, it has not been massively adopted by the crypto community during this bear market. In the meantime, some top holders may be distributing their holdings while the network value is relatively low. This may cause the short-term volatility in the trading price of LINK.
How The Chainlink Network Has Developed
One of the fundamental aspects of cryptocurrency projects is the development process as it shows how the developer team and its community engage in the project. Looking at the metric of ChainLink development activity, it measures the pure contribution to the project conducted by the developer community. It only counts the real update that itself affected the project building on github and excludes all development-unrelated substances. This metric suggests that the core team has continually enhanced the project in spite of the recent bear market.
Development activity has been heightened over time as the core team keeps engaged in Chainlink. (Santiment)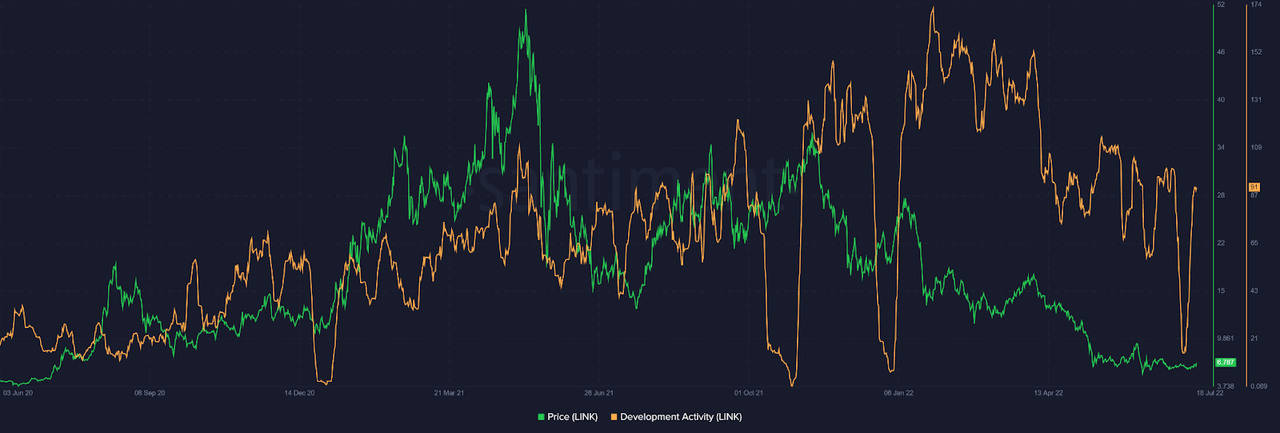
Besides, the metric of Dev contributors count, which is the sum of total events and activity on github that relates to the project, has gradually increased. Therefore, the Chainlink developer community is generally thriving during this bear market.
Development activity contributors count has gradually increased as the Chainlink community is close-knit. (Santiment)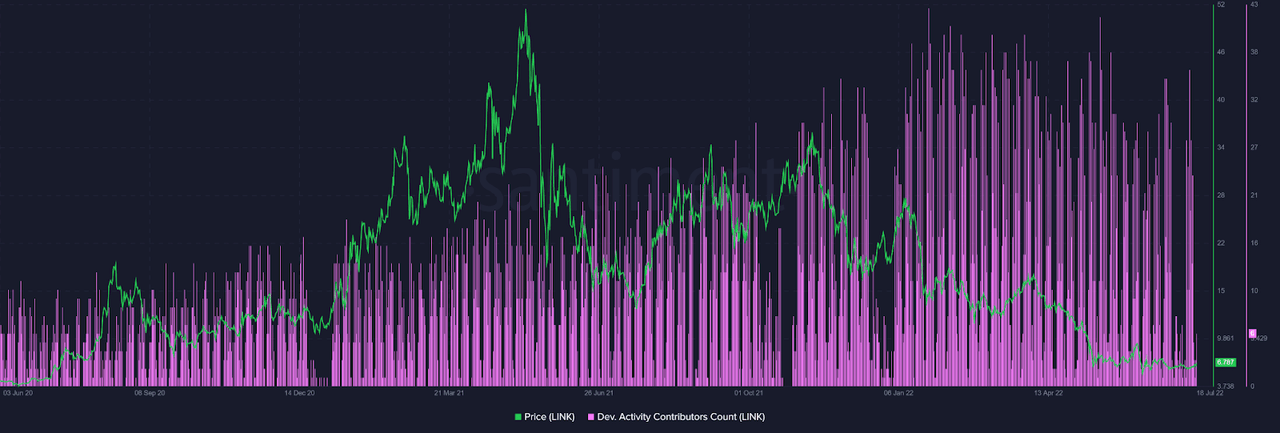
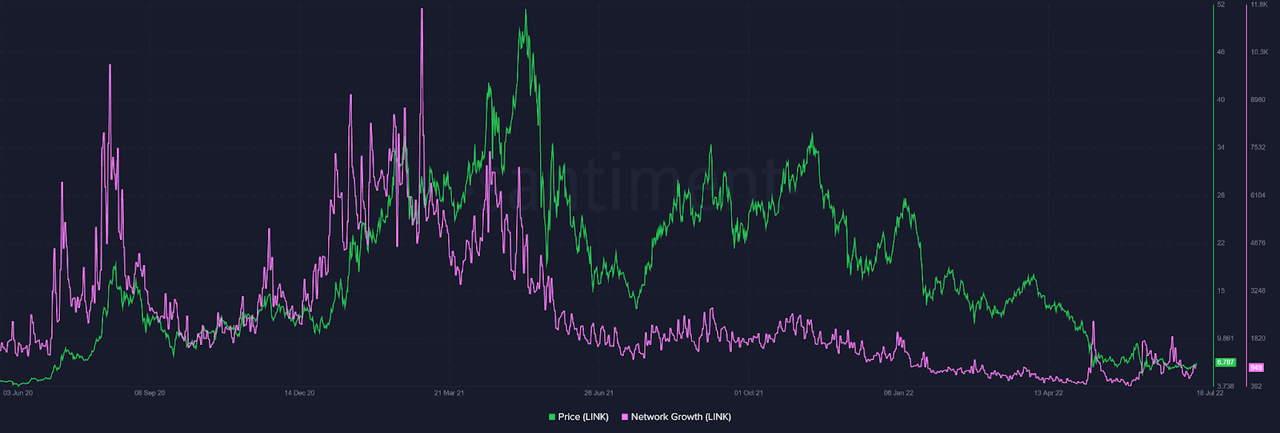
Although the sum count of contents that mention Chainlink related terms has increased, the number of new addresses being created on a daily basis has gradually decreased since the May 2021 peak. It indicates that there are not many new users interested and participating in the Chainlink despite the increasing social media discussion and promotion. This may not be good for the network because new users can make a huge contribution to the network growth.
The total number of documents mentioning Link related terms have increased during this bear market. (Santiment) The speed of the network growth is relatively low as not many new users have adopted Chainlink. (Santiment)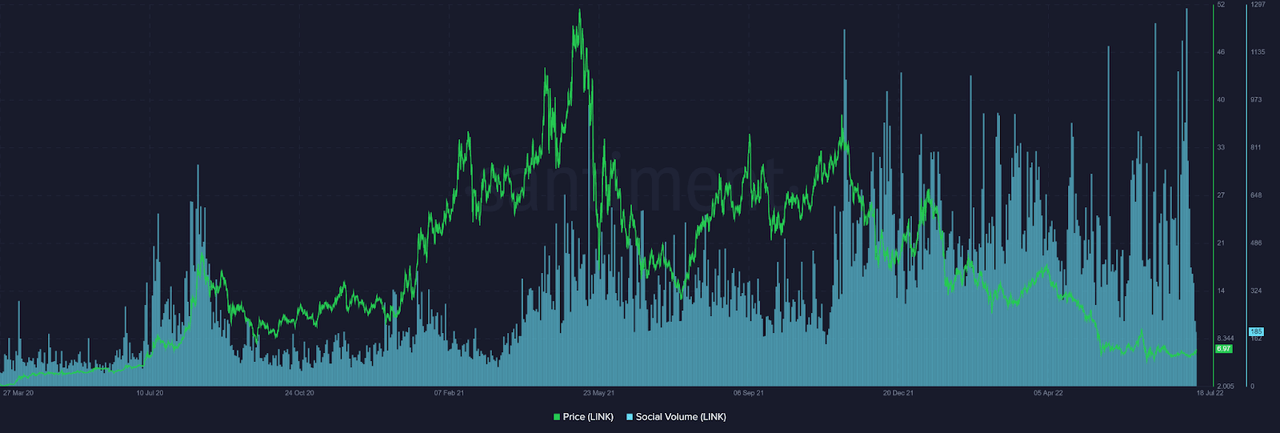
Top Holders Might Have Sold Off Their LINKs
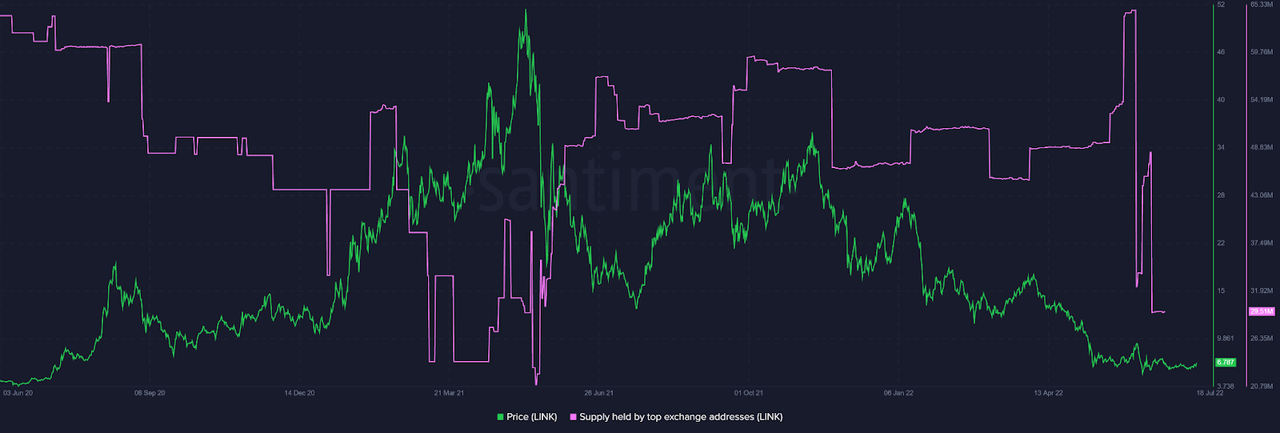
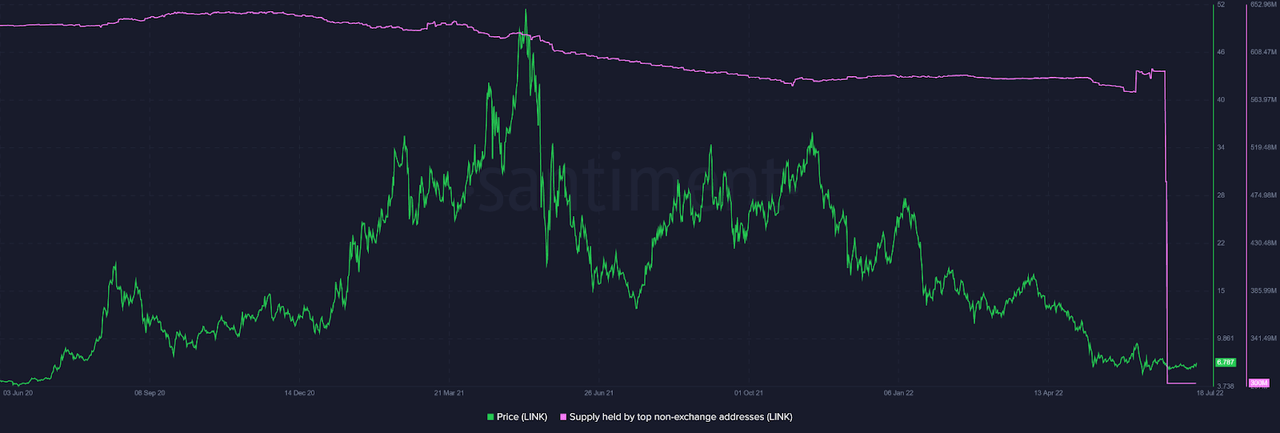
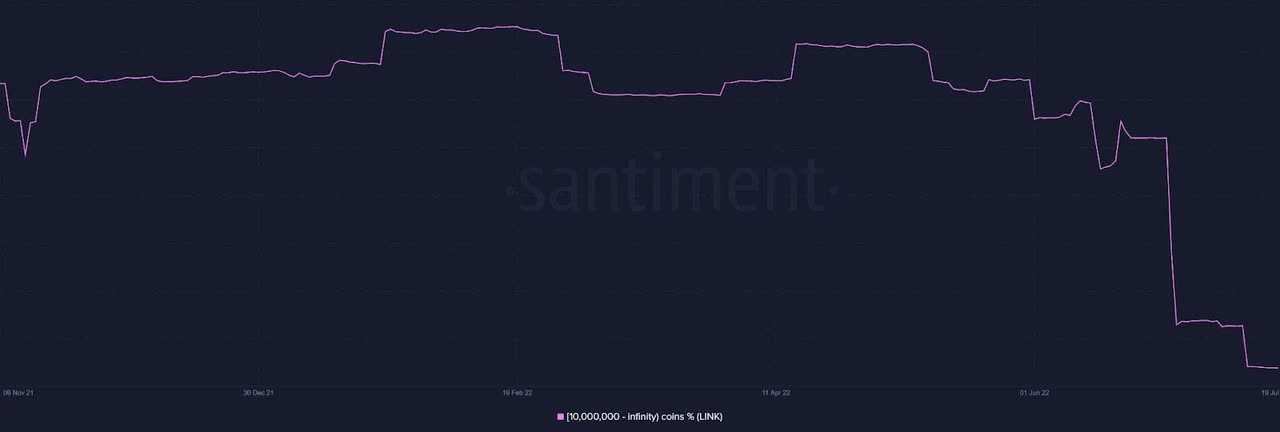
While the network has not grown, top holders might have sold off when they just moved nearly 52.5% of their holdings out of their wallets. This is largely attributed to the wallet addresses with the balance from 10,000,000 LINKs.
The total number of coins held by top addresses has recently dropped roughly 52.5%. (Santiment) The number of coins held by top exchange addresses has recently dropped about 35.25 millions LINKs. (Santiment) The number of coins held by top non-exchange addresses has recently dropped around 290 millions LINKs. (Santiment) The number of wallet addresses with the balance from 10,000,000 LINKs have plunged recently (Santiment)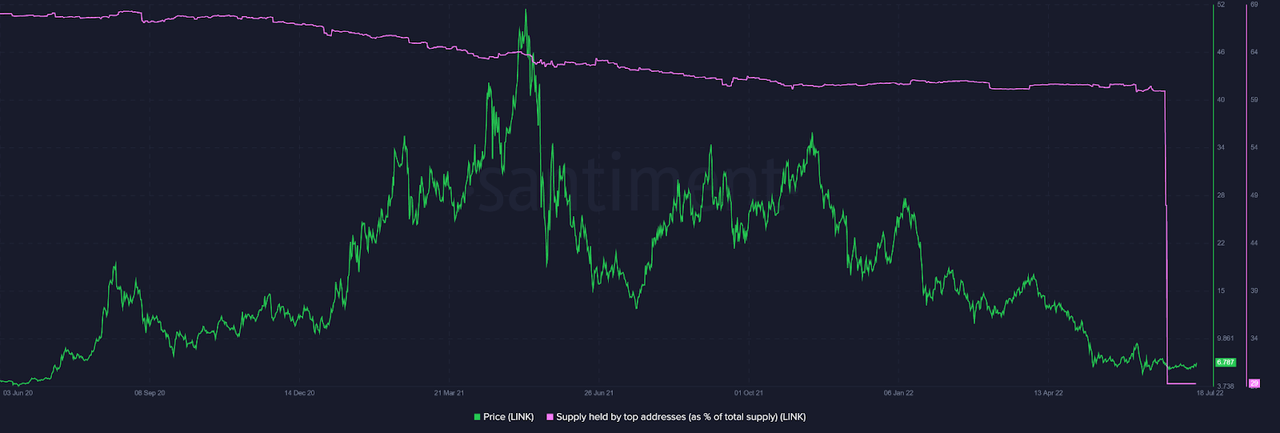
The Network Activity Is Not Heightened
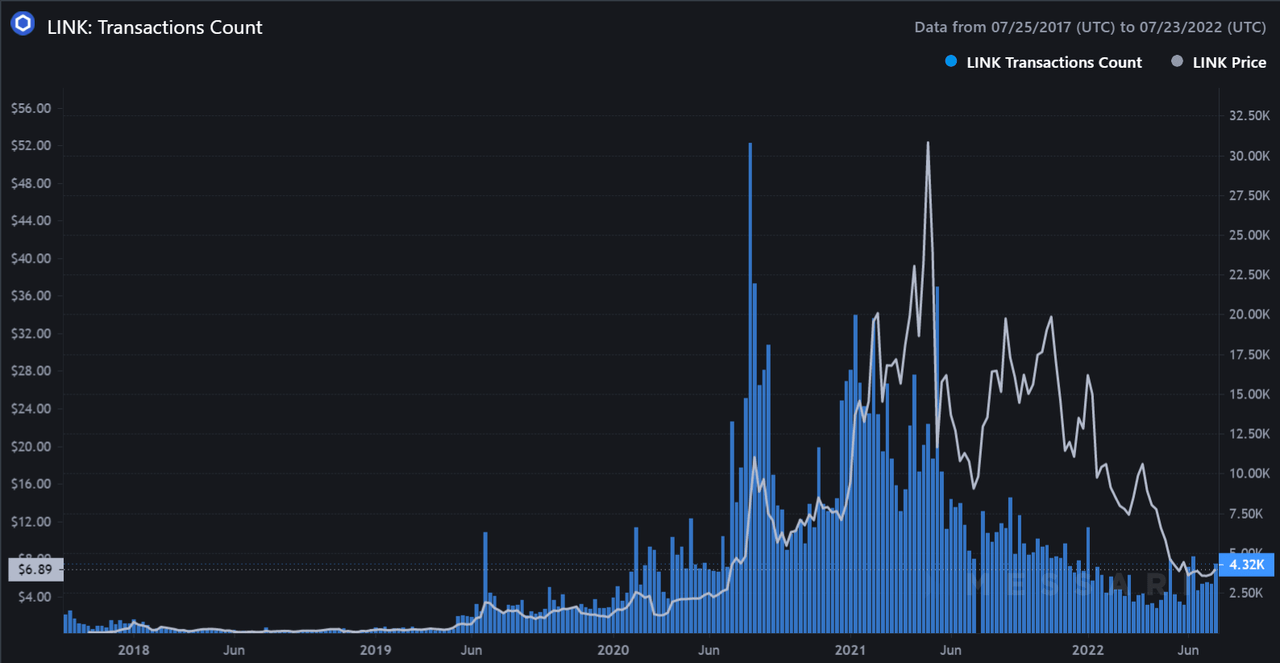
In addition, the network activity is not heightened as the number of daily active addresses -the total number of sender and receiver addresses- has declined since the market top in May 2021. It is normal during bear markets when users are not actively transacting their coins over the network, clearly shown in the transaction volume. As shown in the aforementioned sections, both these data of the network activity have recently increased because top holders have moved off their coins but not due to the network growth.
The number of daily active addresses in a downtrend since May 2021 makes the network value relatively low. (Messari) The amount of transactions has recently surged after a downtrend since May 2021. (Messari)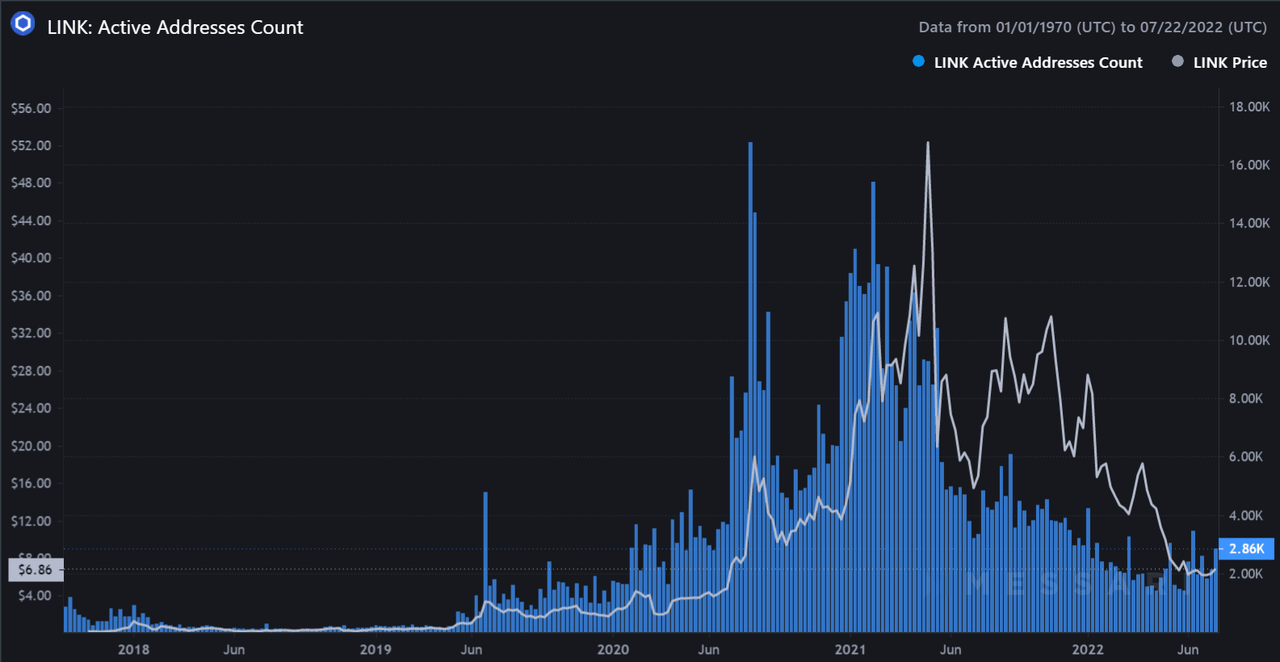
The Network’s Value Is Relatively Low
Meanwhile, the ratio of daily on-chain transaction volume in profit to loss shows the ratio of those coins that move in profit to those coins that move in loss on a daily basis. Its value has been in a downtrend since May 2021, which possibly causes short-term holders to sell at a loss. It can make the network healthy in the long term but volatile in the short term as most coins being sold in loss is a good sign for the reversal pattern.
There are more coins that move in loss than that move in profit. (Santiment)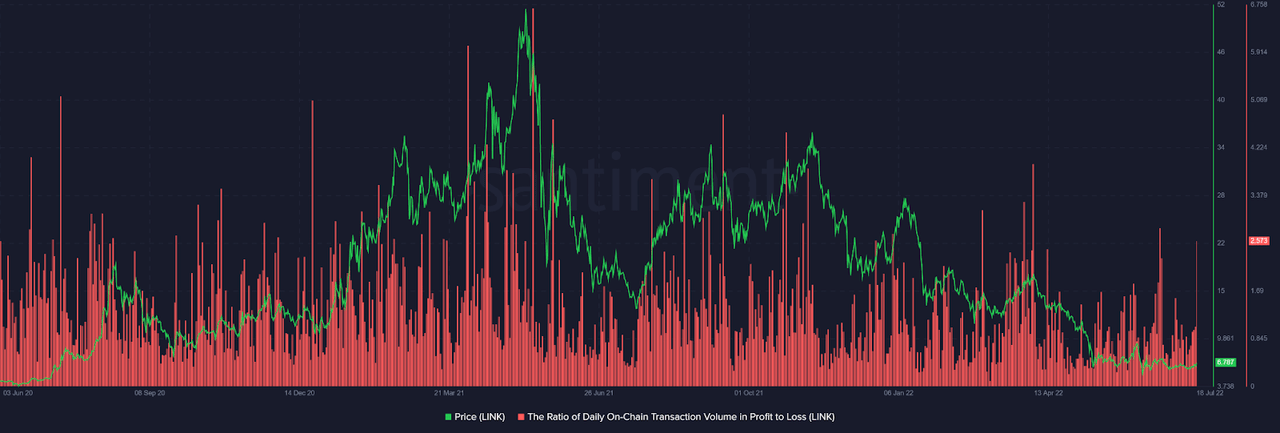
The worst thing that makes the network look bad is that the value of the 3-year MVRV ratio is at 31.11, which means all coins that moved at least once in the past three years are at a loss of about 31.11%. Nonetheless, it suggests that the Chainlink network is relatively undervalued in the long term until the saturation point appears wherein holders already sell most of their coins in loss, that is, the reversal zone.
Those coins that have circulated at least once in the last three years are at a loss of nearly 31.11%. (Santiment)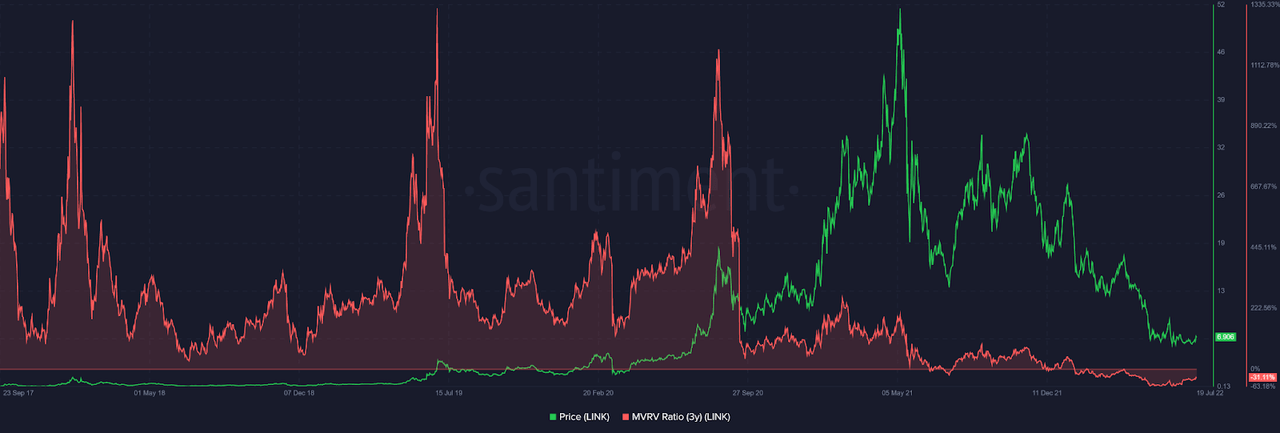
Historically, the annualized standard-deviation of daily returns over a specific interval of time has been highly correlated to the LINK’s price for over the past year. This indicator shows that a volatility in the value of the LINK network should be expected in the next short-term price movement.
The volatility indicator suggests that LINK’s price is in the locally overbought zone. (Messari)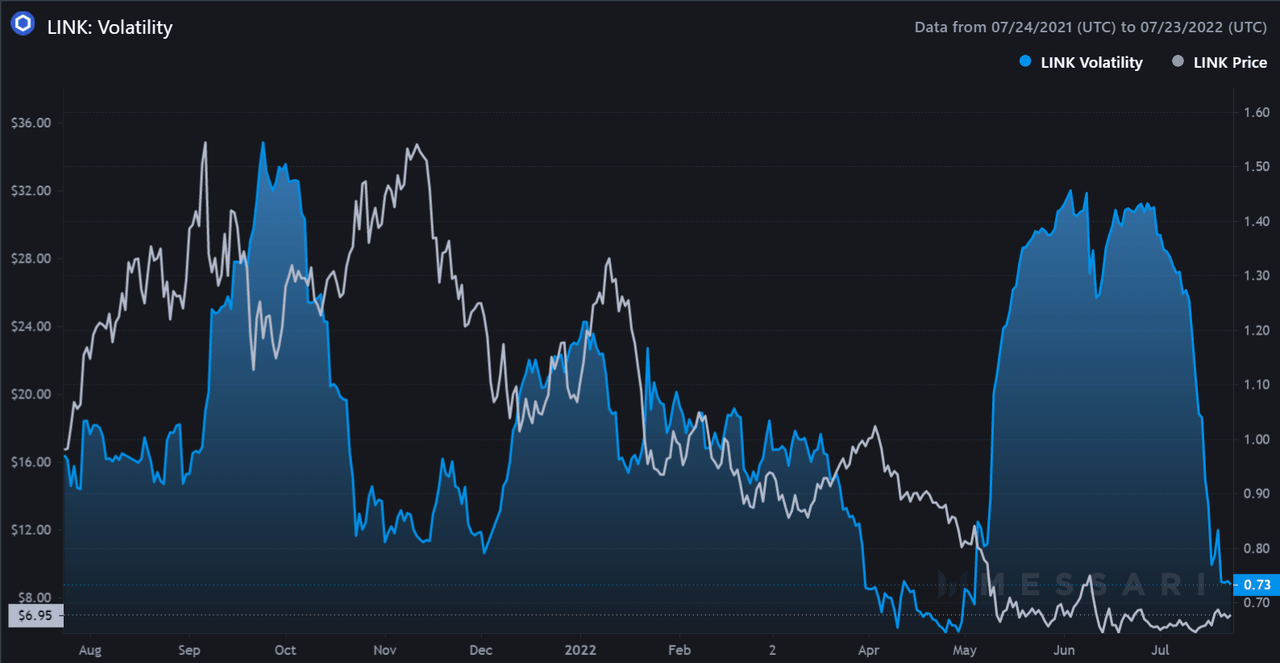
Regarding the investment return, the LINK’s price has been strongly correlated to its Sharp ratio’s value for over the last year. At the moment, this metric is likely to form a local peak, which suggests that the network is locally overvalued.
The Sharp ratio suggests that the network is locally overvalued. (Messari)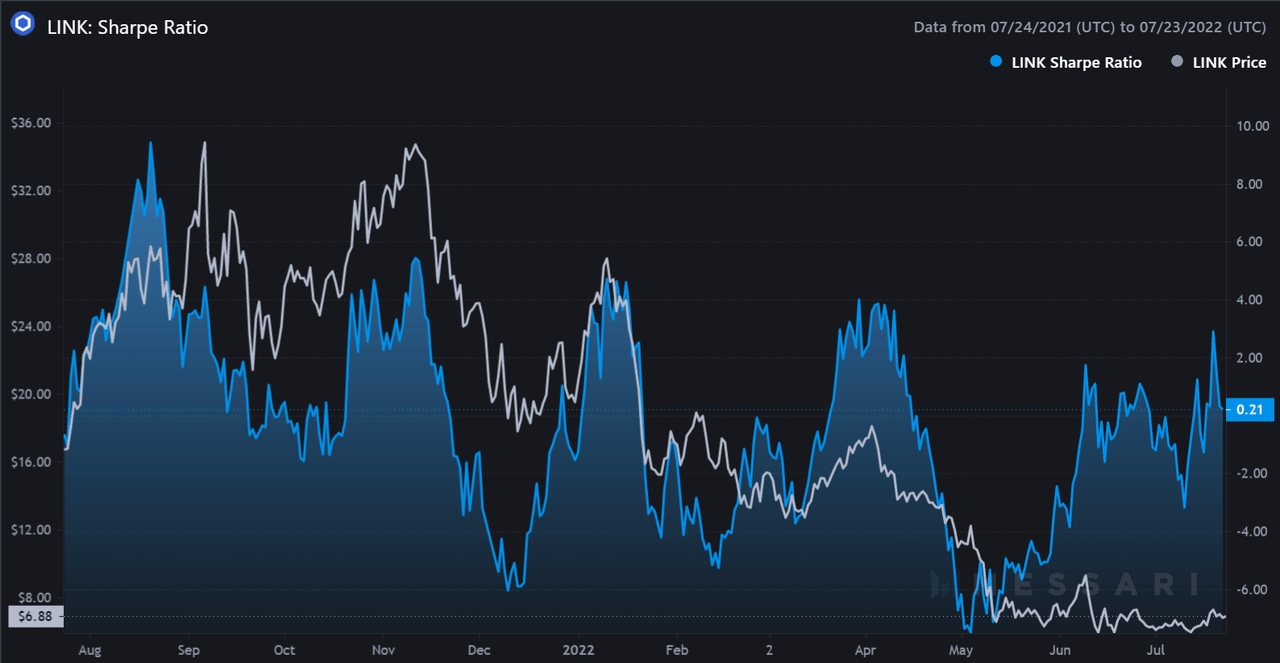
In particular, the realized market capitalization is like the traditional market capitalization, but the formula is calculated based on the price of each UTXO when it was last moved instead of its current trading price. This metric has recently spiked which can be assumed from top holders’ movement as mentioned above. However, the LINK’s price does not fluctuate so does its market capitalization, that is not normal. Historically, the LINK’s value should have spiked with the realized market capitalization, but this time was different. It is suspicious that this can lead to the short-term volatility.
The unusual spike in realized marketcap can cause a volatility in price. (Messari)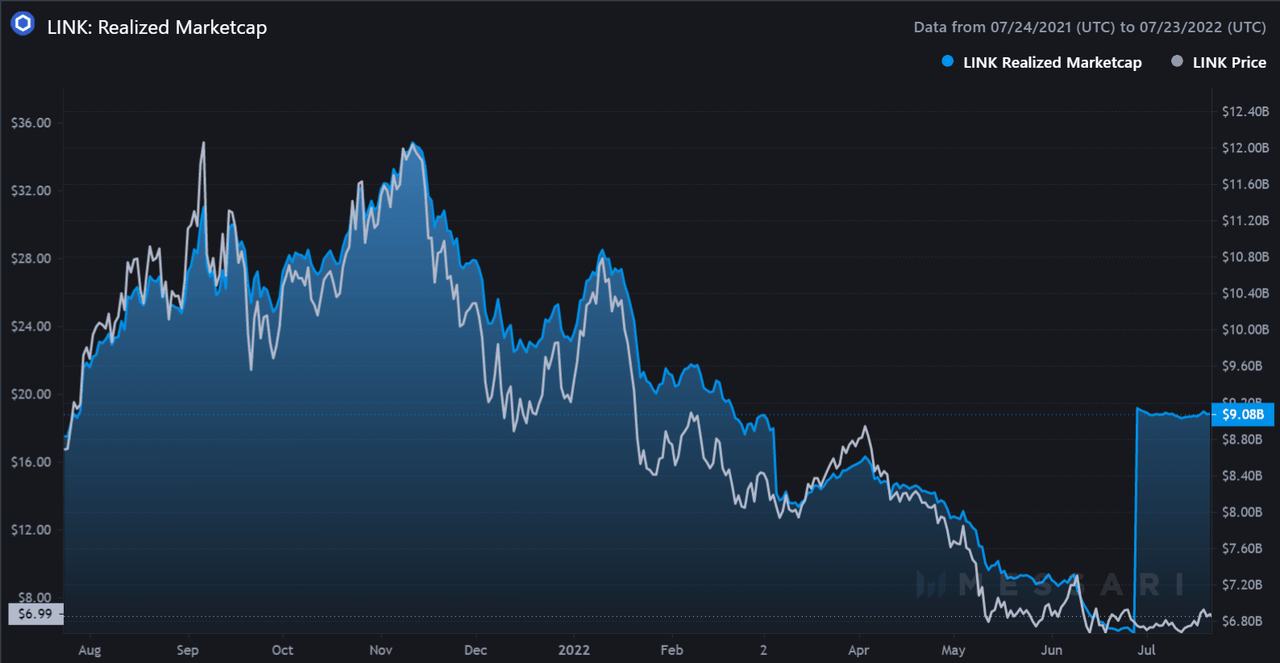
No Accumulative Selling Pressure From Retail Investors
The major concern is that the liquid supply of Link reserved on exchanges has risen since the peak of May 2021. This may increase the potential selling pressure over the marketplace.
The increasing supply of LINK on exchanges since May 2021 may build up the selling pressure. (CryptoQuant)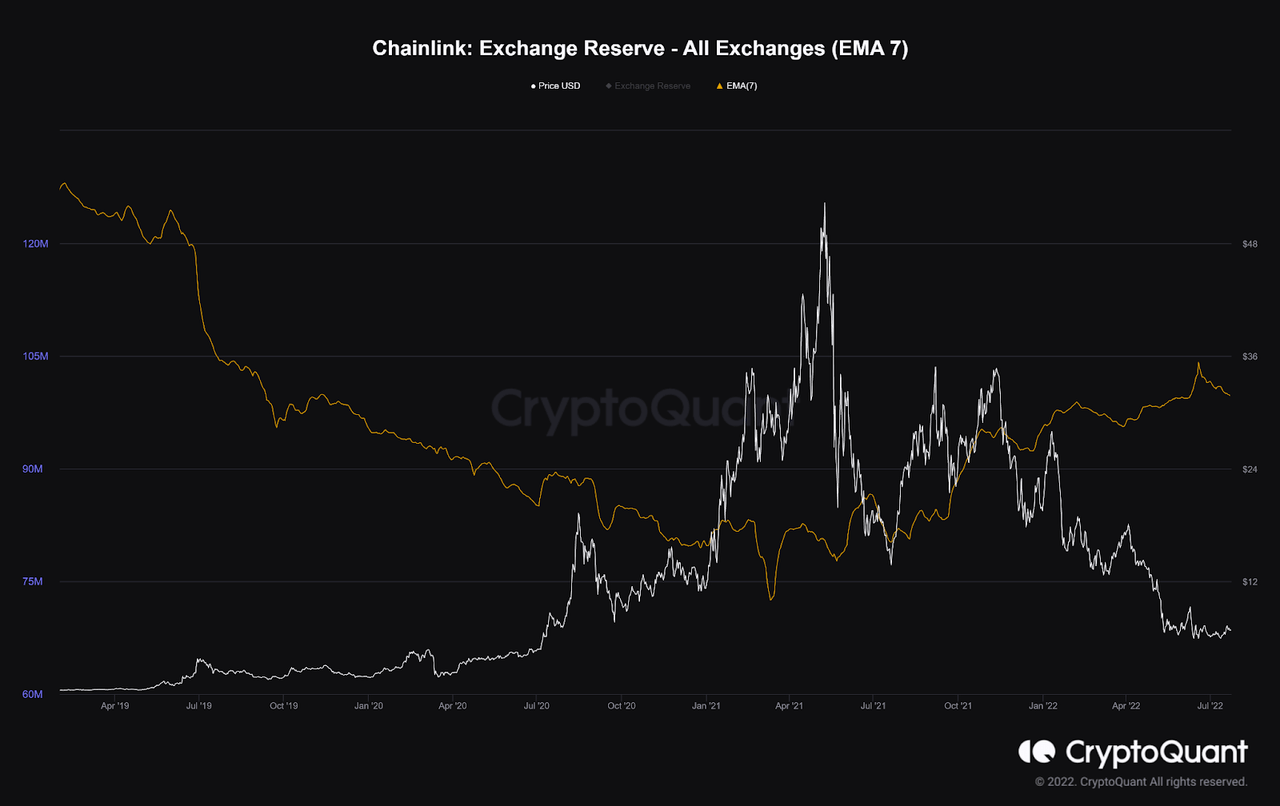
However, the amount of transactions that involve daily deposit addresses of centralized exchanges has been in a downtrend since May 2021. It shows that there could be no increasing selling pressure from retail traders.
Transactions depositing LINK to exchanges have decreased, reducing the selling pressure on exchanges. (Santiment)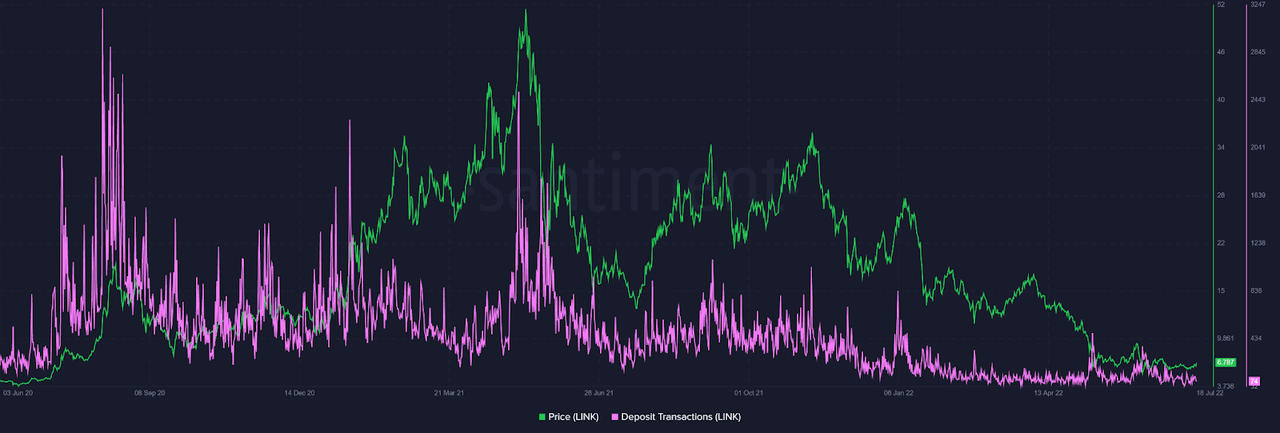
Average Whales May Be Slightly Accumulating LINKs
Additionally, the amount of transactions associated with daily withdrawal addresses of centralized exchanges has been volatile since May 2021. It suggests that there may be a slight accumulation among stakeholders because the aforementioned network growth’s data shows that not many new users have adopted the Chainlink network.
Withdrawal transactions from exchanges are volatile indicating some may be purchasing LINKs. (Santiment)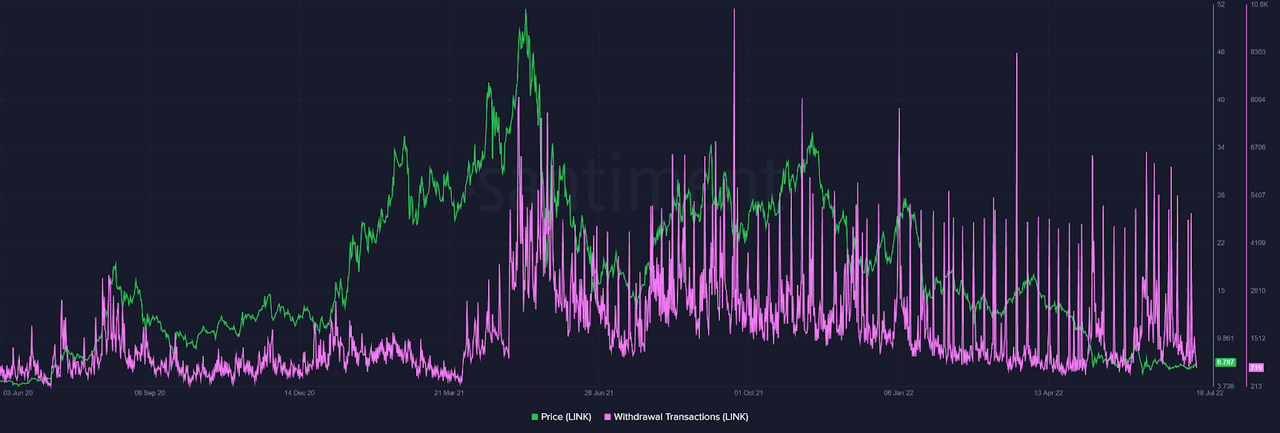
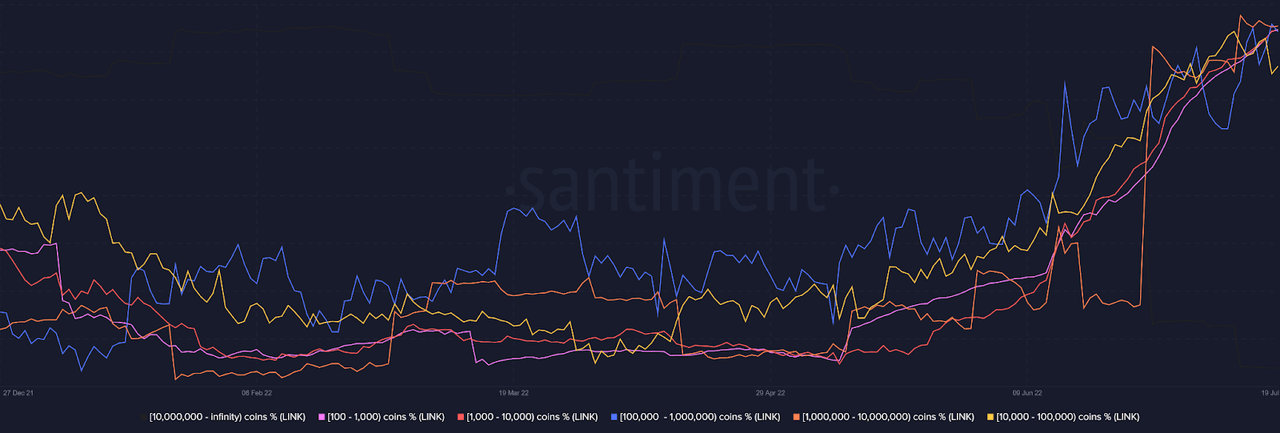
Last but not least, a good sign for long-term holders is that both the total number of addresses holding from 100 to 10,000,000 LINKs and the total number of all tokens of all addresses holding from 100 to 10,000,000 LINKs have overall moved upward since the early 2022. It means that average whales are slightly accumulating more LINKs during the first half of 2022.
The total number of addresses holding 100-10,000,000 LINKs has increased since the early 2022. (Santiment) The total number of all tokens of all addresses holding 100-10,000,000 LINKs has increased since the early 2022. (Santiment)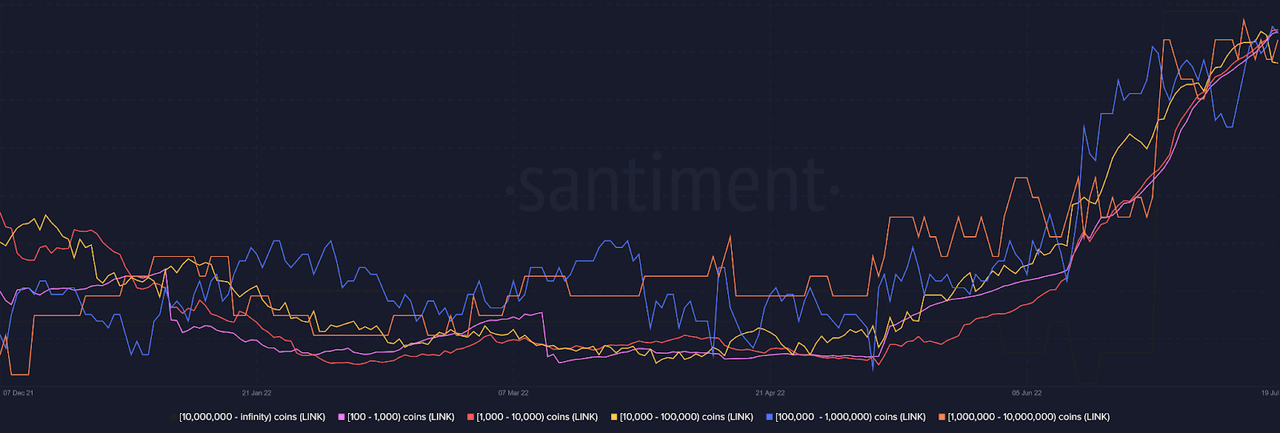
Conclusion
In summary, it can be seen that not many new users have adopted the Chainlink network since May 2021 in contrast to the high discussion on social media platforms, and this trend may continue as the crypto community is still skeptical about the bear market. Although many stakeholders are continually accumulating LINKs as the network is undervalued, some giant whales are possibly distributing their holdings, which likely causes the short-term volatility.
Be the first to comment