

alex_skp/iStock via Getty Images
Funds Macro Portfolio (“FMP”)
Our Funds Macro Portfolio (“FMP”) is a portfolio consisting only of funds with one simple goal: Outperforming the SPDR S&P 500 Trust ETF (SPY) on a risk-adjusted basis, over time.
Since its inception date (Dec. 31, 2020), this is exactly what FMP is doing, and in this article we would like to reveal and talk about the single best-performing holding that has been part of the portfolio since day 1, without us making any change to the position ever since.
But before we dive into this single holding, it’s important to better understand what is the FMP, how it’s structured, and how it’s operating.
Performance as at Sep. 2, 2022:
| FMP | |
| Type of securities held | Funds |
| Max. No. of positions | 50 |
| Actual, Current, No. of positions | 10 |
| Inception Date | Dec 31, ’20 |
| YTD correlation b/w portfolio to SPY | 0.6067 |
| Portfolio YTD Return | 4.35% |
| SPY YTD Return | (16.80%) |
| Over/Under-performance YTD Return | 21.15% |
| Portfolio YTD SD | 1.02% |
| SPY YTD Return | 1.50% |
| Over/Under-performance YTD SD | 0.48%* |
*Positive number = Lower volatility = Less risk
As of Sep. 2, 2022, nearly 2/3 of the portfolio (63.17% to be precise) is in cash – the highest level we’ve been at since inception.
Macro Trading Factory – Funds Macro Portfolio (“FMP”)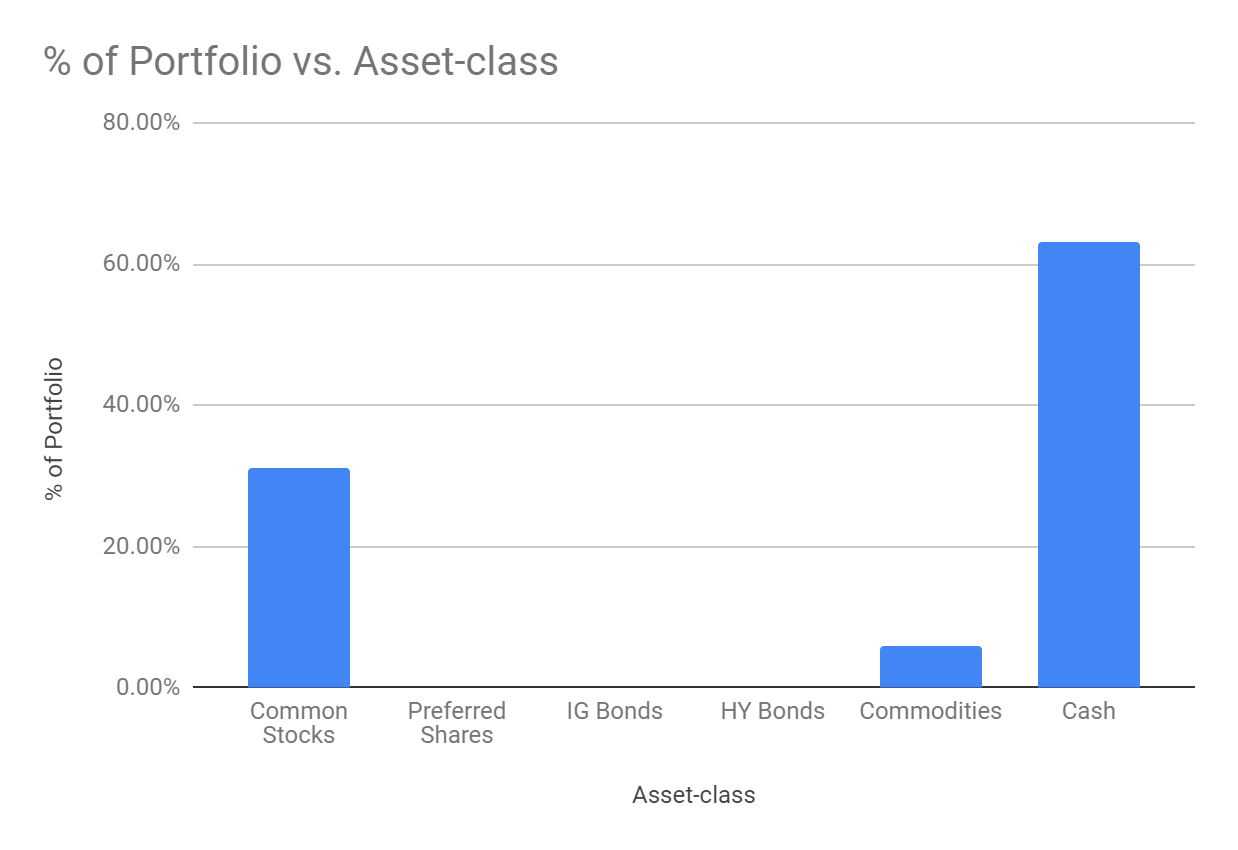
Nonetheless, it’s important to note that the 37% of assets that are invested don’t (necessarily) reflect the exact long exposure of the portfolio (at any given moment). This is due for two possible reasons:
1) 37% represents the net cash exposure which, for itself, is the result of the long cash exposure minus the short cash exposure.
For example, if I’m cash long 70% and cash short 30% the net cash long is 40%.
2) We might be using leveraged instruments on the long and/or short side, and if we do – the real leveraged exposure of the portfolio can be higher or lower.
Using the same example as before: If 30% out of the 70% (cash long) are invested in 2x-leveraged instruments and 10% out of the 30% (cash short) are invested in 3x-leveraged instruments, the leveraged net exposure is 50% = (30%X2+40%)-(10%*3+20%)
Please note that the leverage we refer to here is a constant one, i.e. an essential part of the instrument, and not a leverage that may or may not be employed by a company or portfolio manager, as deemed appropriate.
Usage of leverage instruments may increase/decrease the real (=inc. the leverage effect) exposure compared to the cash (non-leveraged) exposure.
Our current net exposure when accounting for the leverage effect (of all instruments) is 50% – still very low (historically) but higher than the 37% net cash exposure.
With that in mind, we can move onto introducing the FMP’s single best-performing which is a non-leveraged instrument:
ClearBridge MLP and Midstream Fund Inc. (NYSE:CEM)
As per its own description, the fund:
- Provides an efficient, single investment for accessing a portfolio of energy-related master limited partnerships (“MLPs”) and midstream entities
- Seeks a high level of total return with an emphasis on cash distributions
- Targets energy-related midstream entities and MLPs with long-lived assets and predictable cash flows
We’ve been bullish on Energy – particularly MLPs – for a couple of years now, and since its inception, FMP has held an overweight Energy position.
At the end of 2020, CEM was a perfect candidate for us because not only is the fund holding many MLPs that we like and believe in, but it was trading over 20% below its NAV, a discount that we found to be excessive.
CEM has only 27 holdings, with the top-10 accounting for 58.5% of the AuM.
| Ticker | Security Name | Weight (%) |
| EPD | Enterprise Products Partners LP | 7.66 |
| MPLX | MPLX LP MLP | 7.56 |
| WES | Western Midstream Partners LP | 7.16 |
| ET | Energy Transfer Equity LP | 6.89 |
| MMP | Magellan Midstream Partners LP | 5.95 |
| WMB | Williams Cos Inc | 5.7 |
| TRGP | Targa Resources Corp | 5.11 |
| OKE | ONEOK Inc | 4.2 |
| DCP | DCP Midstream Partners LP | 4.2 |
| ENB | Enbridge Inc. | 4.06 |
Aside from CEM, the main two other instruments that accounted for the FMP’s energy exposure were Alerian MLP ETF (AMLP) and NB MLP and Energy Income Fund Inc. (NML).
As we revealed six months ago, our intention was to start taking some Energy chips off the table along the year – and indeed we have – but we cut it short in light of how the year progressed, especially following the Russian invasion of Ukraine and the consequences the ongoing war has on the Energy market.
Timing is Everything
Since FMP’s inception date, CEM has been a stellar investment.
Not only has the fund performed way better than AMLP, but it has even managed to (slightly) outperform the most popular Energy ETF – Energy Select Sector SPDR ETF (XLE), which (unlike a MLPs-based fund) is dominated by Exploration and Production (“E&P”) names.
When energy prices are soaring and/or when operating margins are widening – E&P names are likely to outperform MLPs. Therefore, CEM outperforming XLE since 2021 is a notable and unexpected outcome.
Y-Charts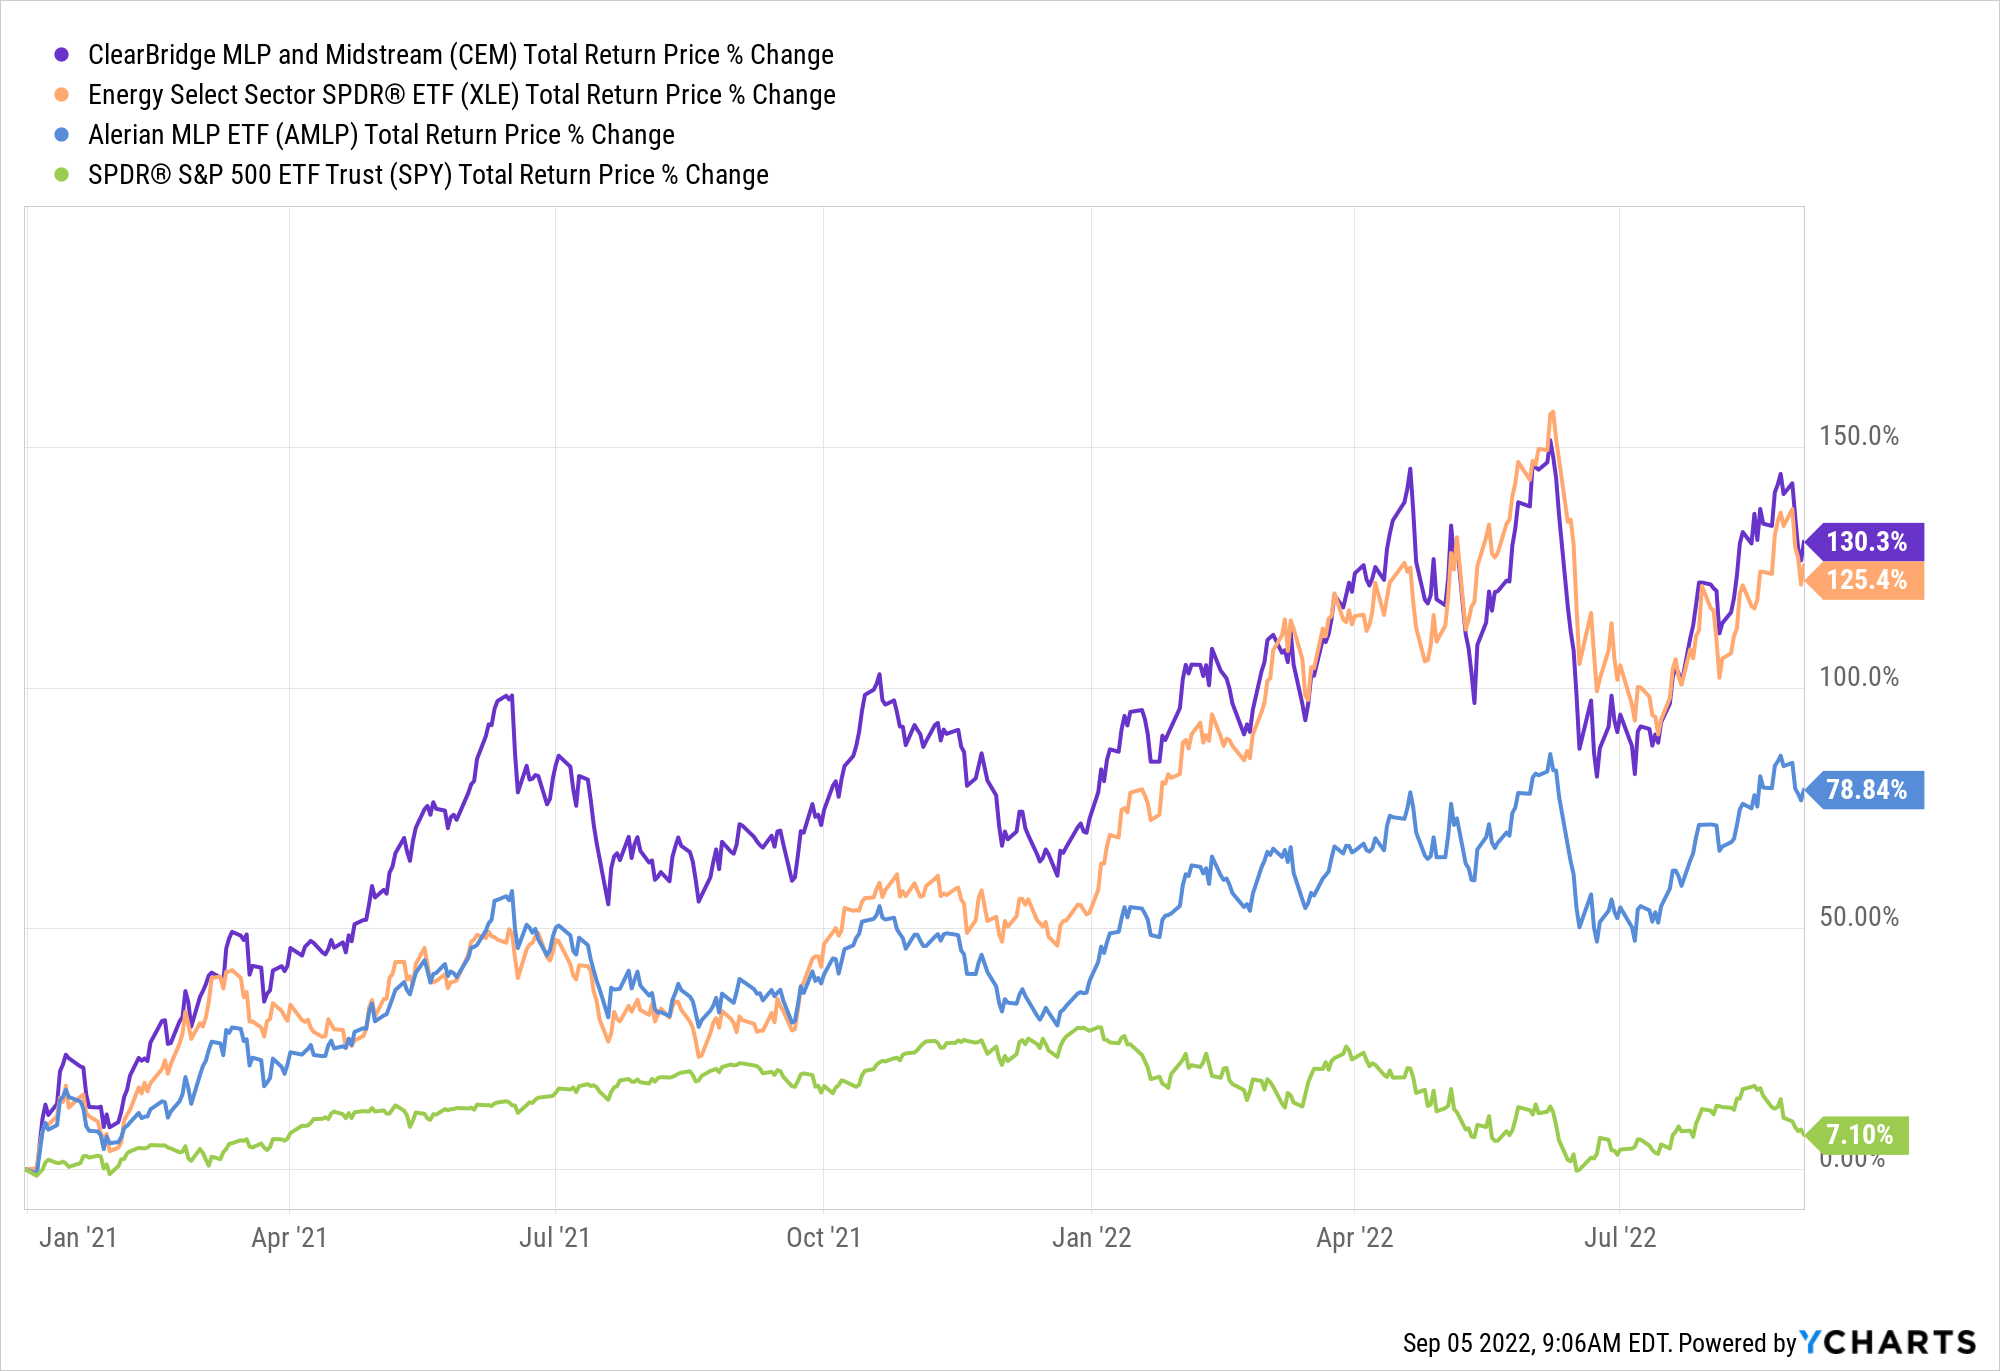
Principally, we would expect a MLP-based (thus income-rich) fund to be less volatile than an E&P-based ETF, however CEM is about as volatile as XLE.
Normally, this could have been explained by CEM small amount of holdings and high concentration among its top-10 holdings, however taking into consideration that XLE has even less holdings than CEM and that XLE’s top-2 holdings (XOM, CVX) account for nearly half of AuM that can’t be a valid explanation here.
Y-Charts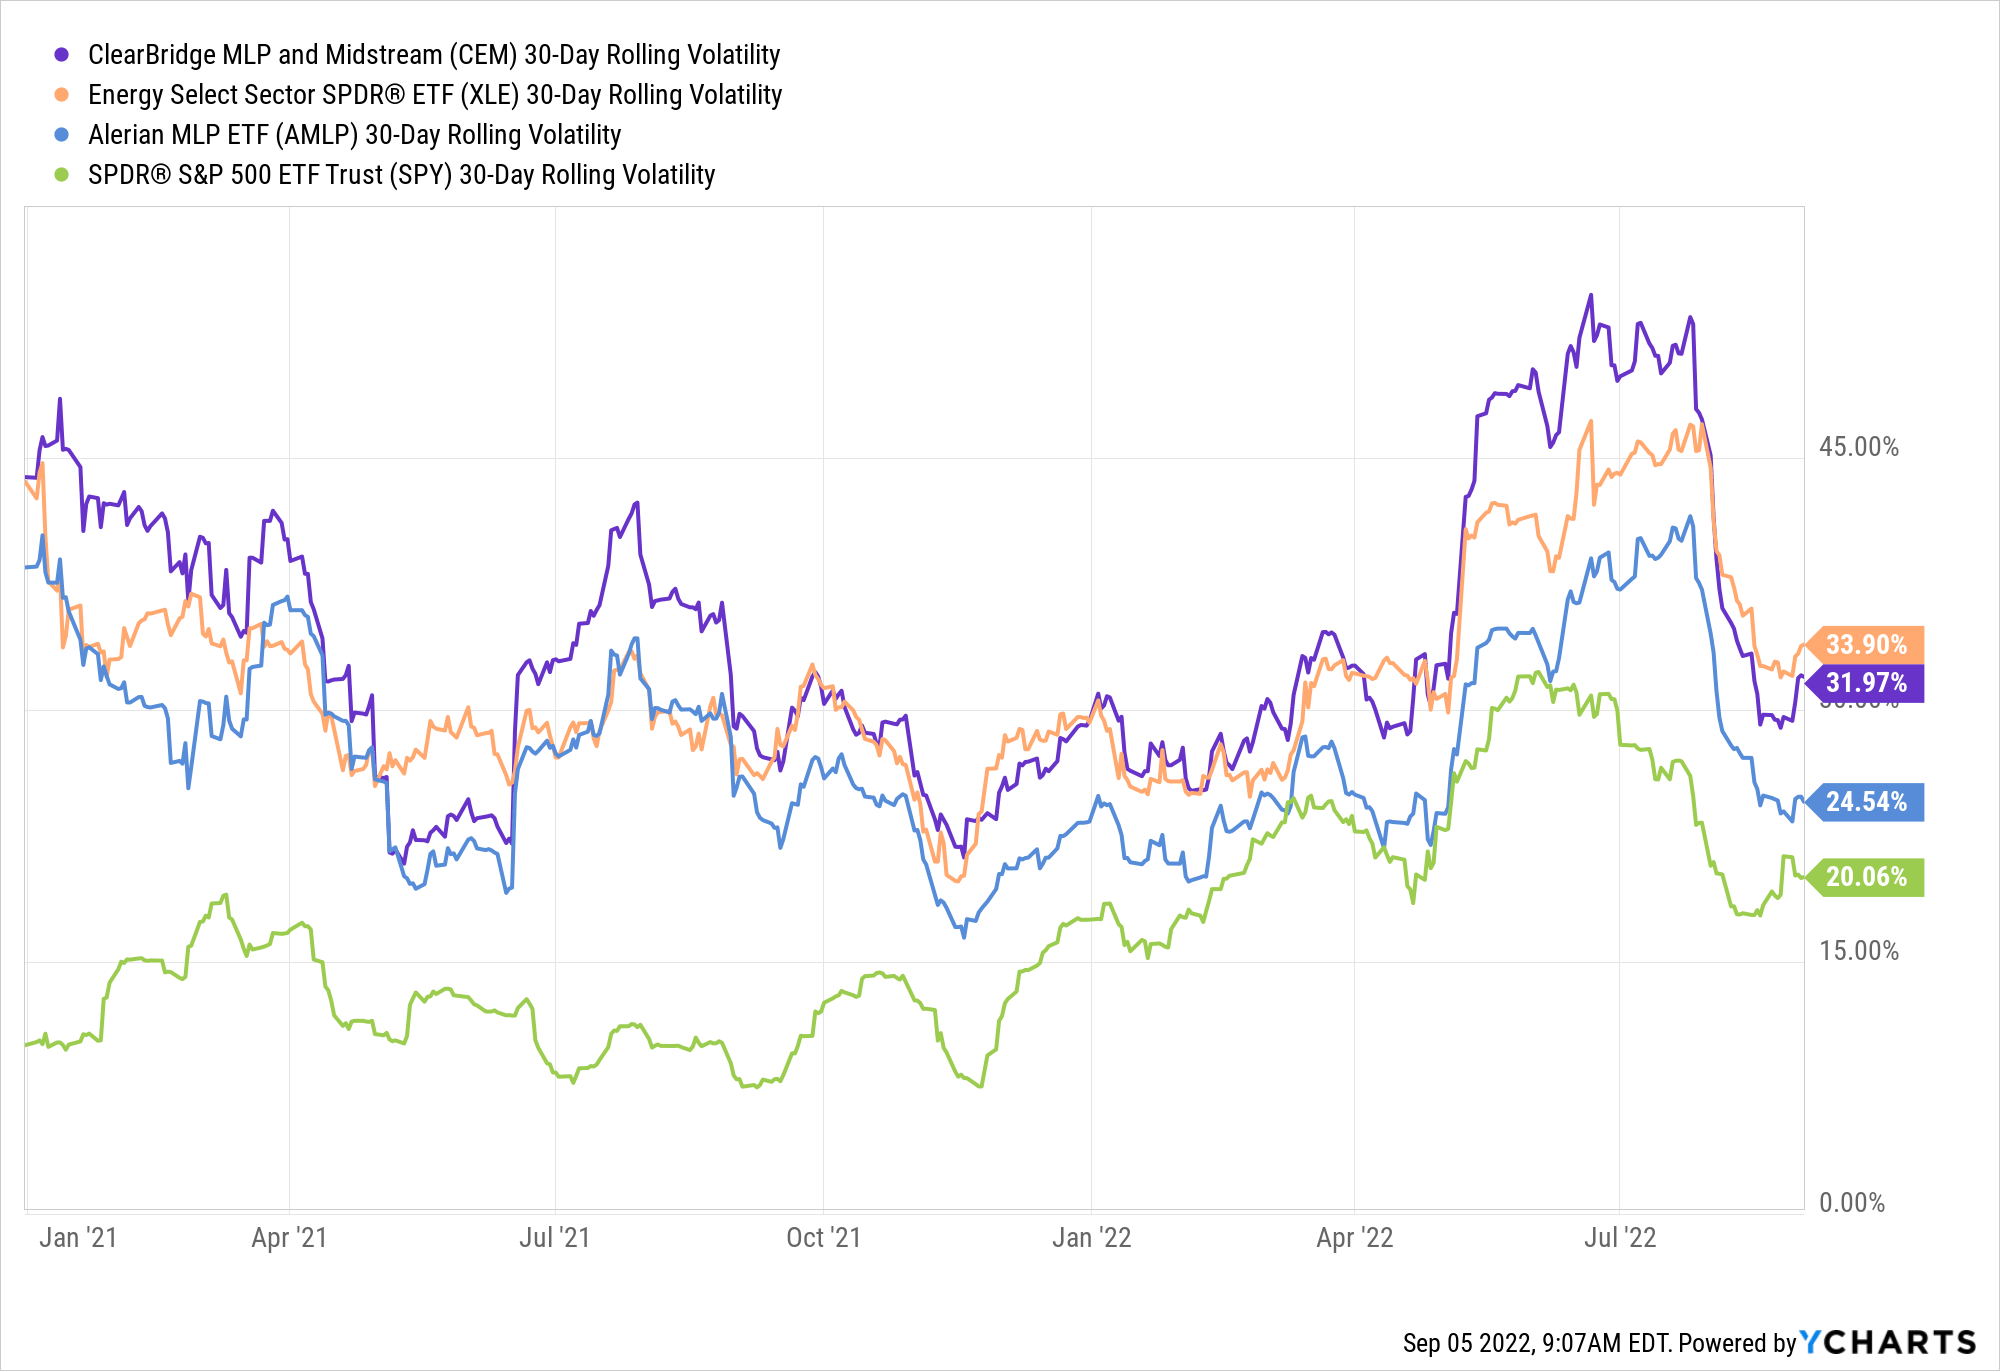
It’s important to note that if one is looking at CEM’s entire history since inception – it’s not a pretty picture.
As a matter of fact, aside from the post-COVID era, the fund has performed poorly with losses tracking back to any period equal or greater than 3 years.
[The below table related to the fund as at June 30, 2022]
ClearBridge MLP and Midstream Fund Inc.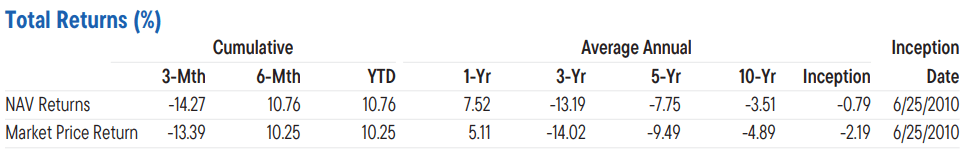
Nevertheless, timing is everything and if you jump on the right boat at the right time – it doesn’t really matter how bad things were before.
CEM’s Main Advantages
CEM has three notable advantages compared to alternatives like XLE or AMLP.
Firstly, the forward distribution rate which currently, based on the fund’s most recent $0.61/share quarterly dividend, comes to 7.16%. True, AMLP’s distribution rate is a bit higher (7.40%) but that of XLE is only 3.50%.
Y-Charts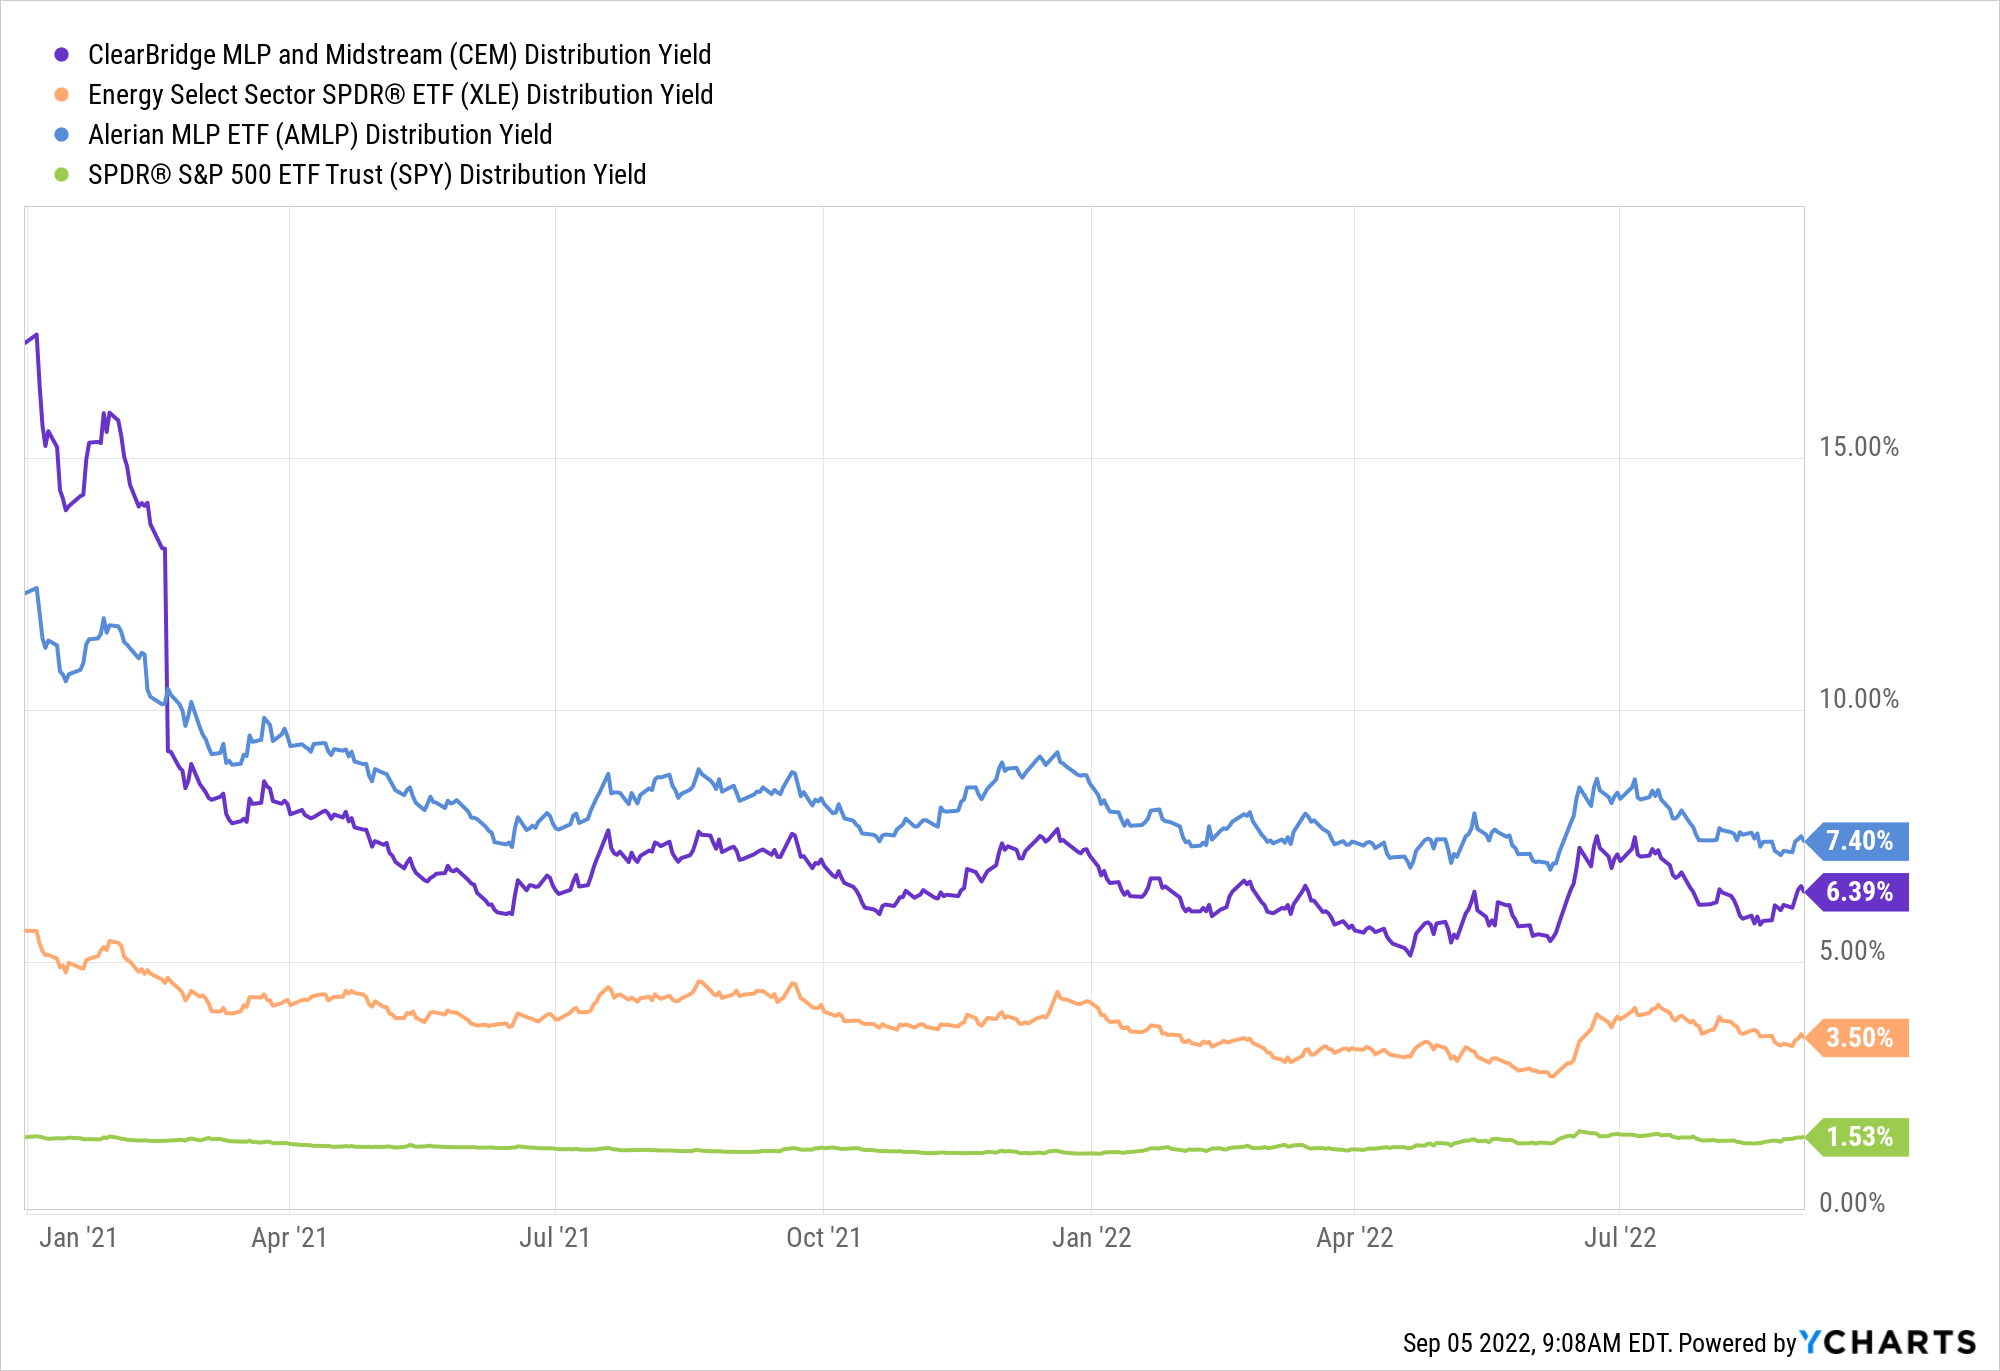
Secondly, AMLP and XLE are both ETFs. As such the market prices of these funds track very closely the NAV, as if the case for any ETF. CEM, on the other hand, is a CEF (Closed-end fund) which can trade with a (significant) discount or premium to its NAV.
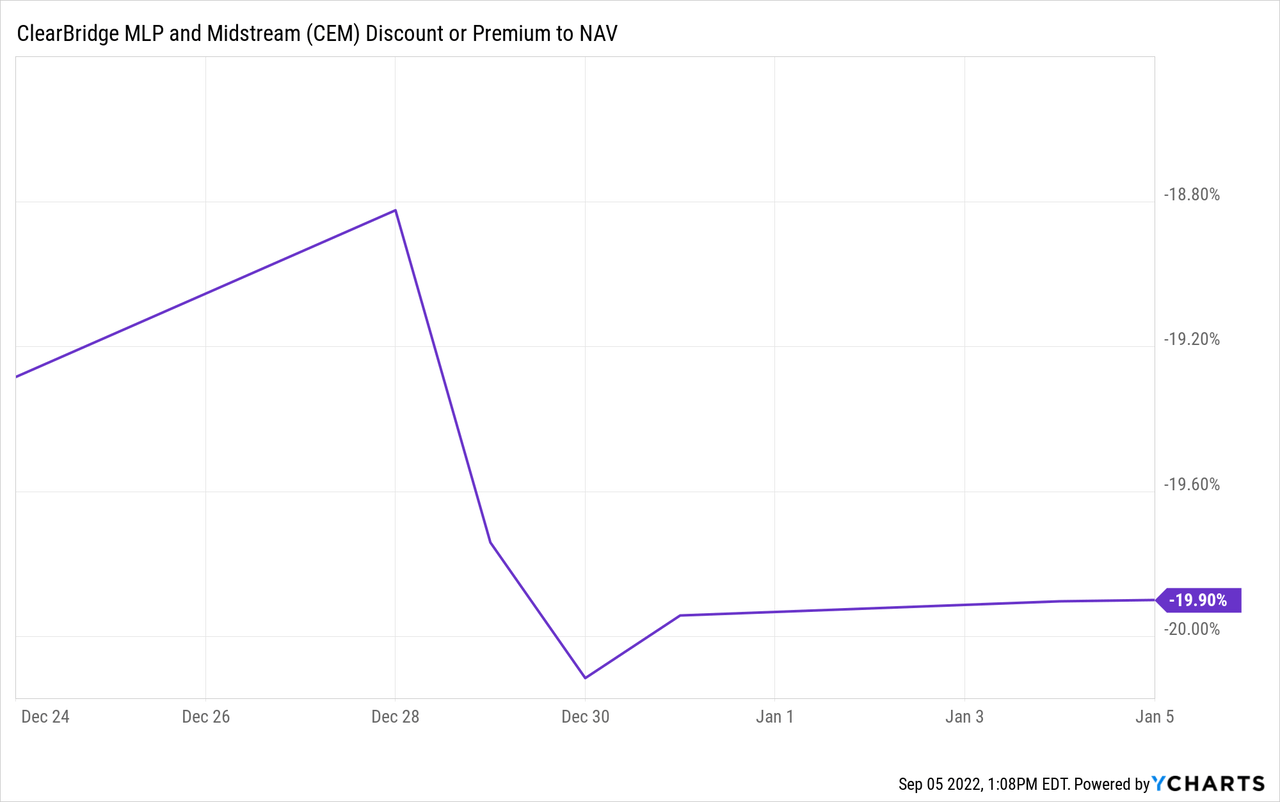
Before the COVID pandemic entered our lives, CEM used to trade with a premium/discount of up to +/-10% to its NAV. As a matter of fact, prior to 2020, the fund traded with a premium about half the time.
Nonetheless, since trading with a discount of nearly 50% (at the peak of the market COVID-induced panic) the fund hasn’t been able to move back to its old range, and over the past two years it has consistently traded with a discount ranging from -12% (at best) to about -20% (at worst)
Y-Charts, Author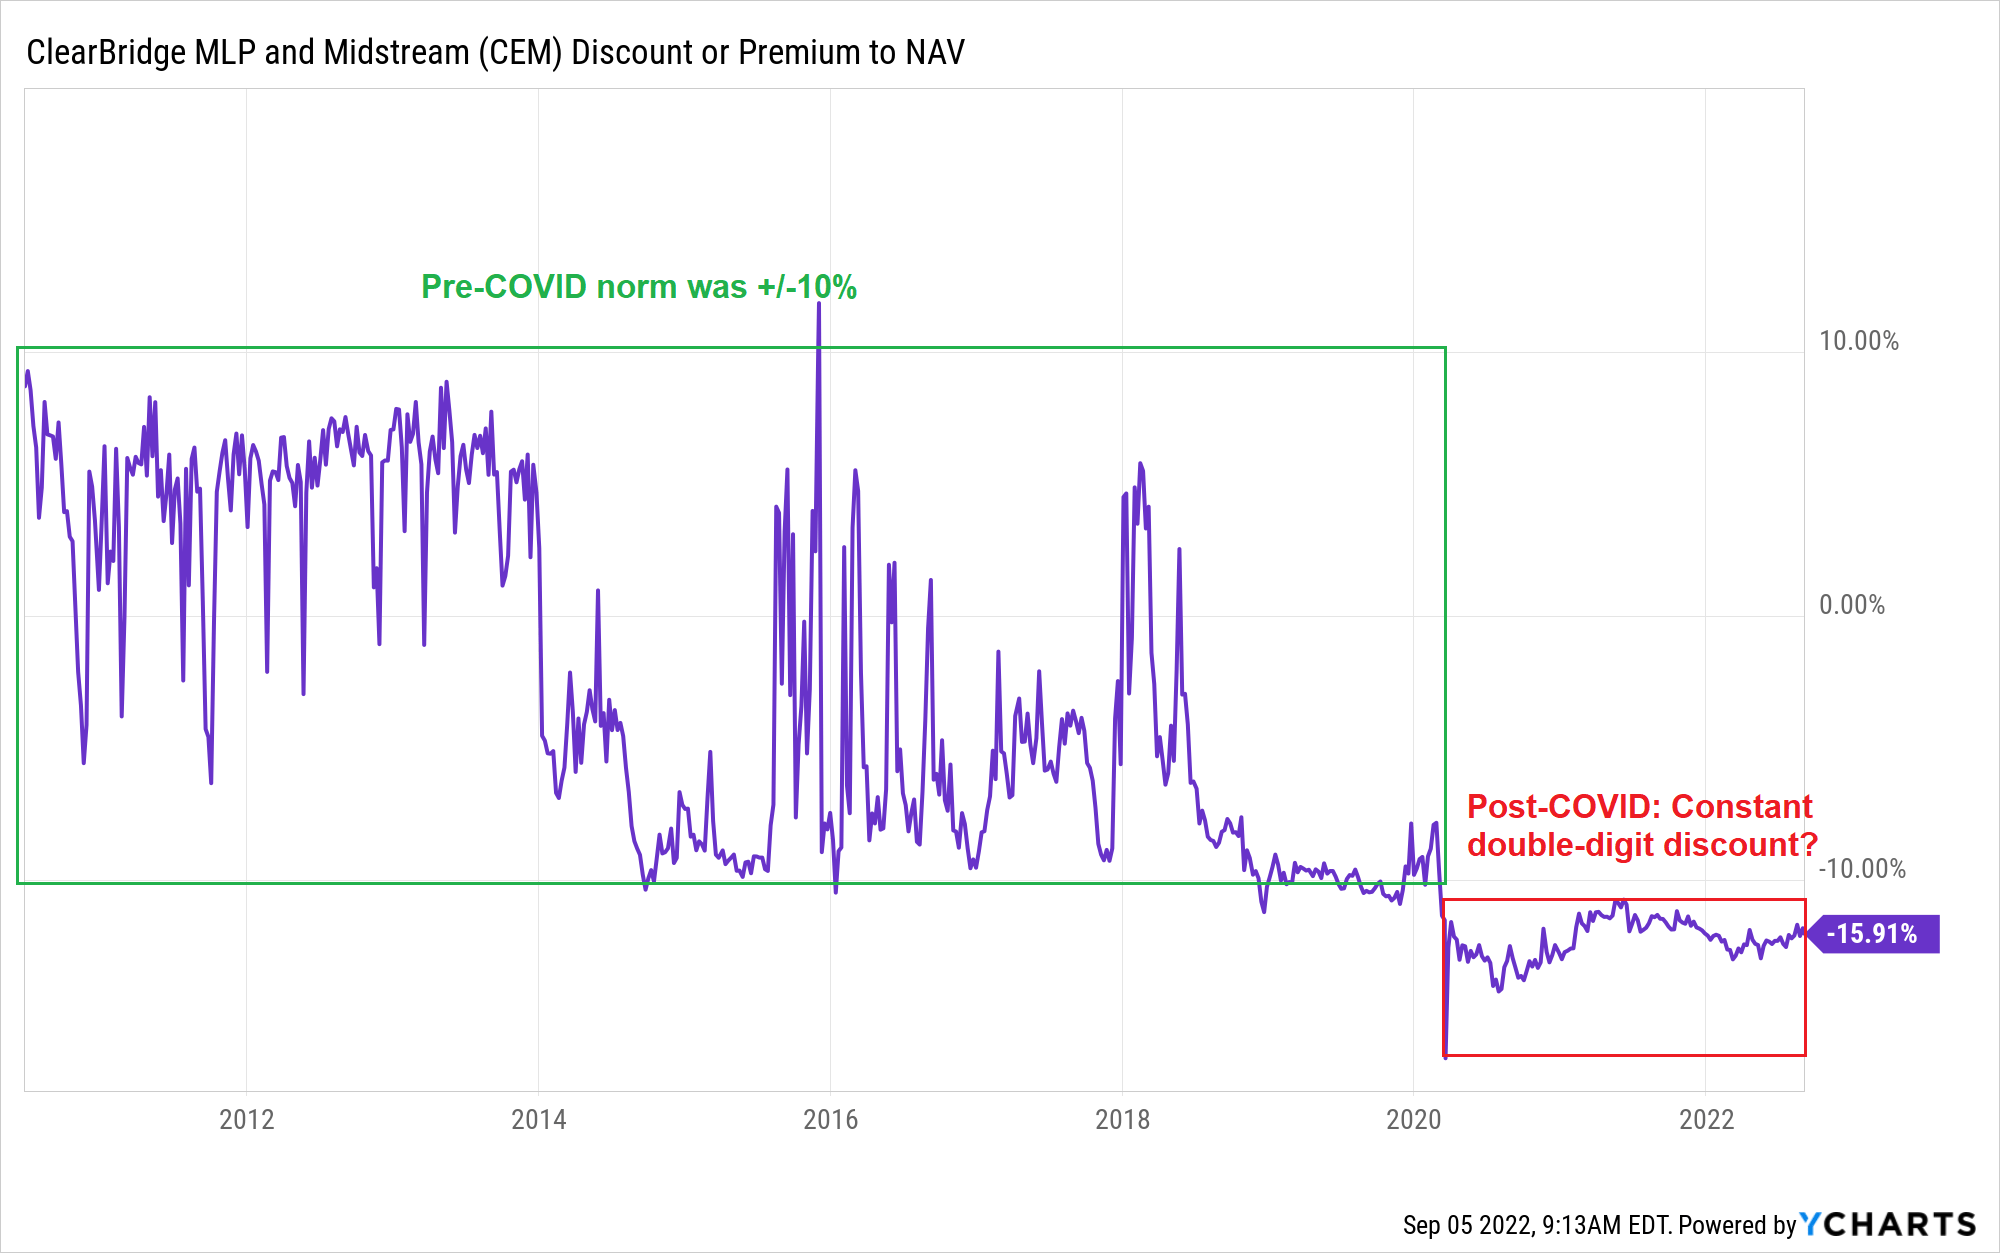
Can CEM’s discount to NAV shrink again? Your guess is good as ours, but we do know that there’s no justification for a fund holding top-class MLPs to trade with a discount of 16%.
The below chart shows the [discount/premium to NAV / 30-day rolling volatility] ratio. While this is not an official gauge, it suggests that CEM is trading with a too low ratio compared to the improvement in fundamentals surrounding the Energy sector.
Why would this ratio now be at the same level it was back in 2017-2019 when these fundamentals were significantly weaker?
Y-Charts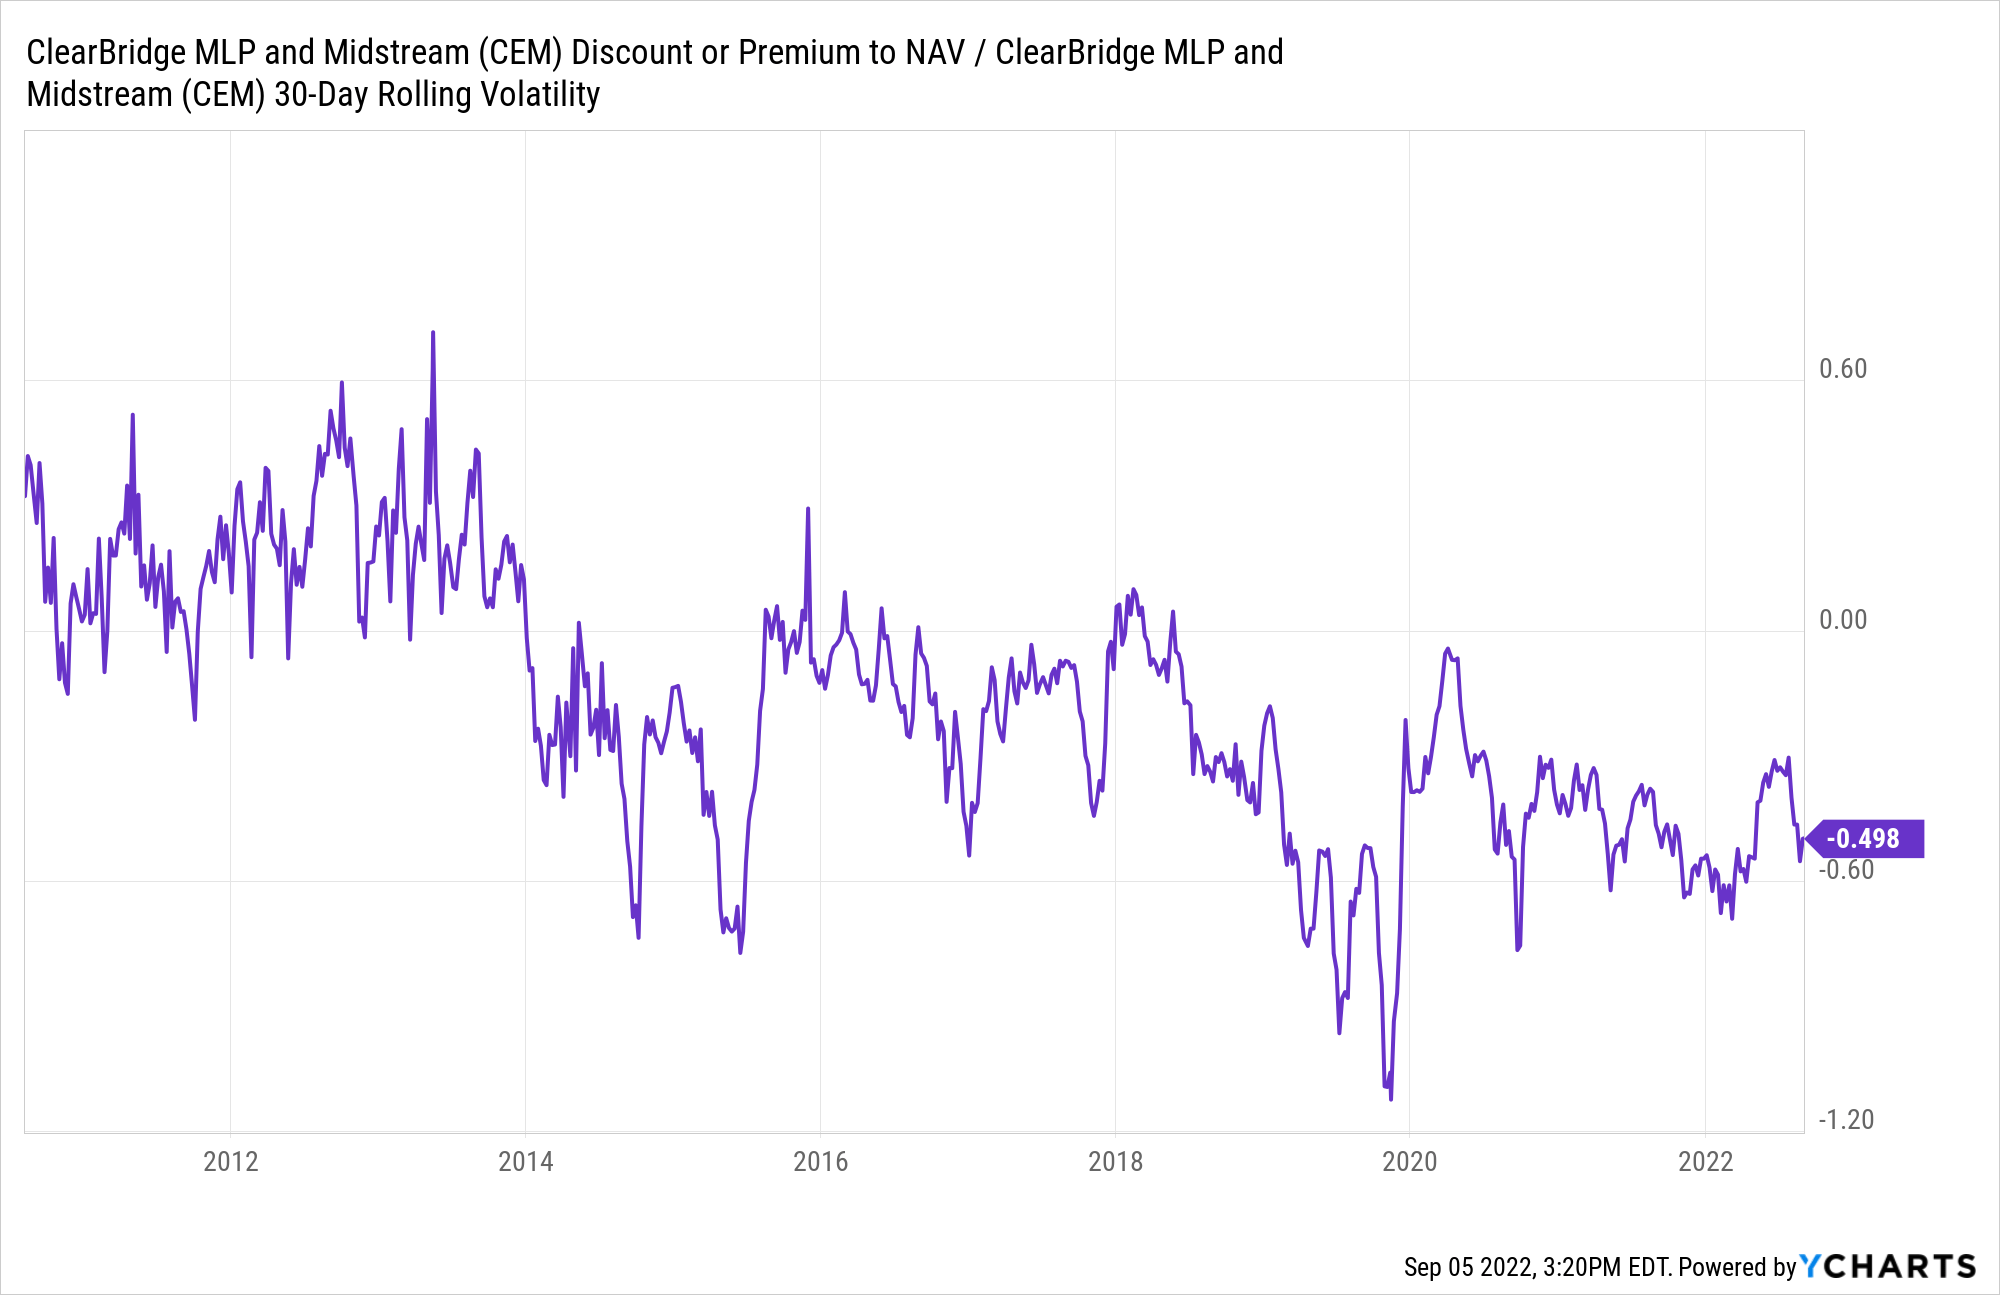
Lastly, we believe that while E&P names are more sensitive to energy prices, MLPs are supposed to be less vulnerable to oil and gas price fluctuations, especially under the current geopolitical situation.
Sure, MLPs (just like E&P names) are trading higher/lower when oil prices move up/down, but MLPs are more volume-oriented (and less oil price oriented) than E&P names. As such, the main aspect to assess their well-being is the expected flows running through their pipes.
Following Russia cutting its energy supply to Europe (with the latest development being a permanent shut to the Nord Stream pipeline), with OPEC mulling a production cut, and with the winter/heating season approaching fast – it’s safe to assume that 1) energy prices aren’t going down significantly anytime soon, and 2) any spare capacity will find (desperate) European customers. Is it economically/viable to transport oil/gas from the US to Europe? When you don’t have any alternative, I guess that we will find soon that cost is becoming a secondary (if not non-) issue.
Putting it differently, even if oil prices ease further (hurting E&P names), it’s unlikely that MLPs are going to see any reduction to the flows running their pipelines.
Bottom Line
Energy as a whole, and CEM particularly, still deserve a BUY-rating in our opinion.
In-spite of the recession fears, it looks as if the combination of geopolitical tension, possibly lower production, and upcoming winter is strong enough to compensate for the slowing economy.
CEM is still trading with a larger-than-usual, and we add: unjustified, discount to NAV and we see no reason why this discount won’t get smaller over time, back to the historical range the fund traded at before 2020.
Y-Charts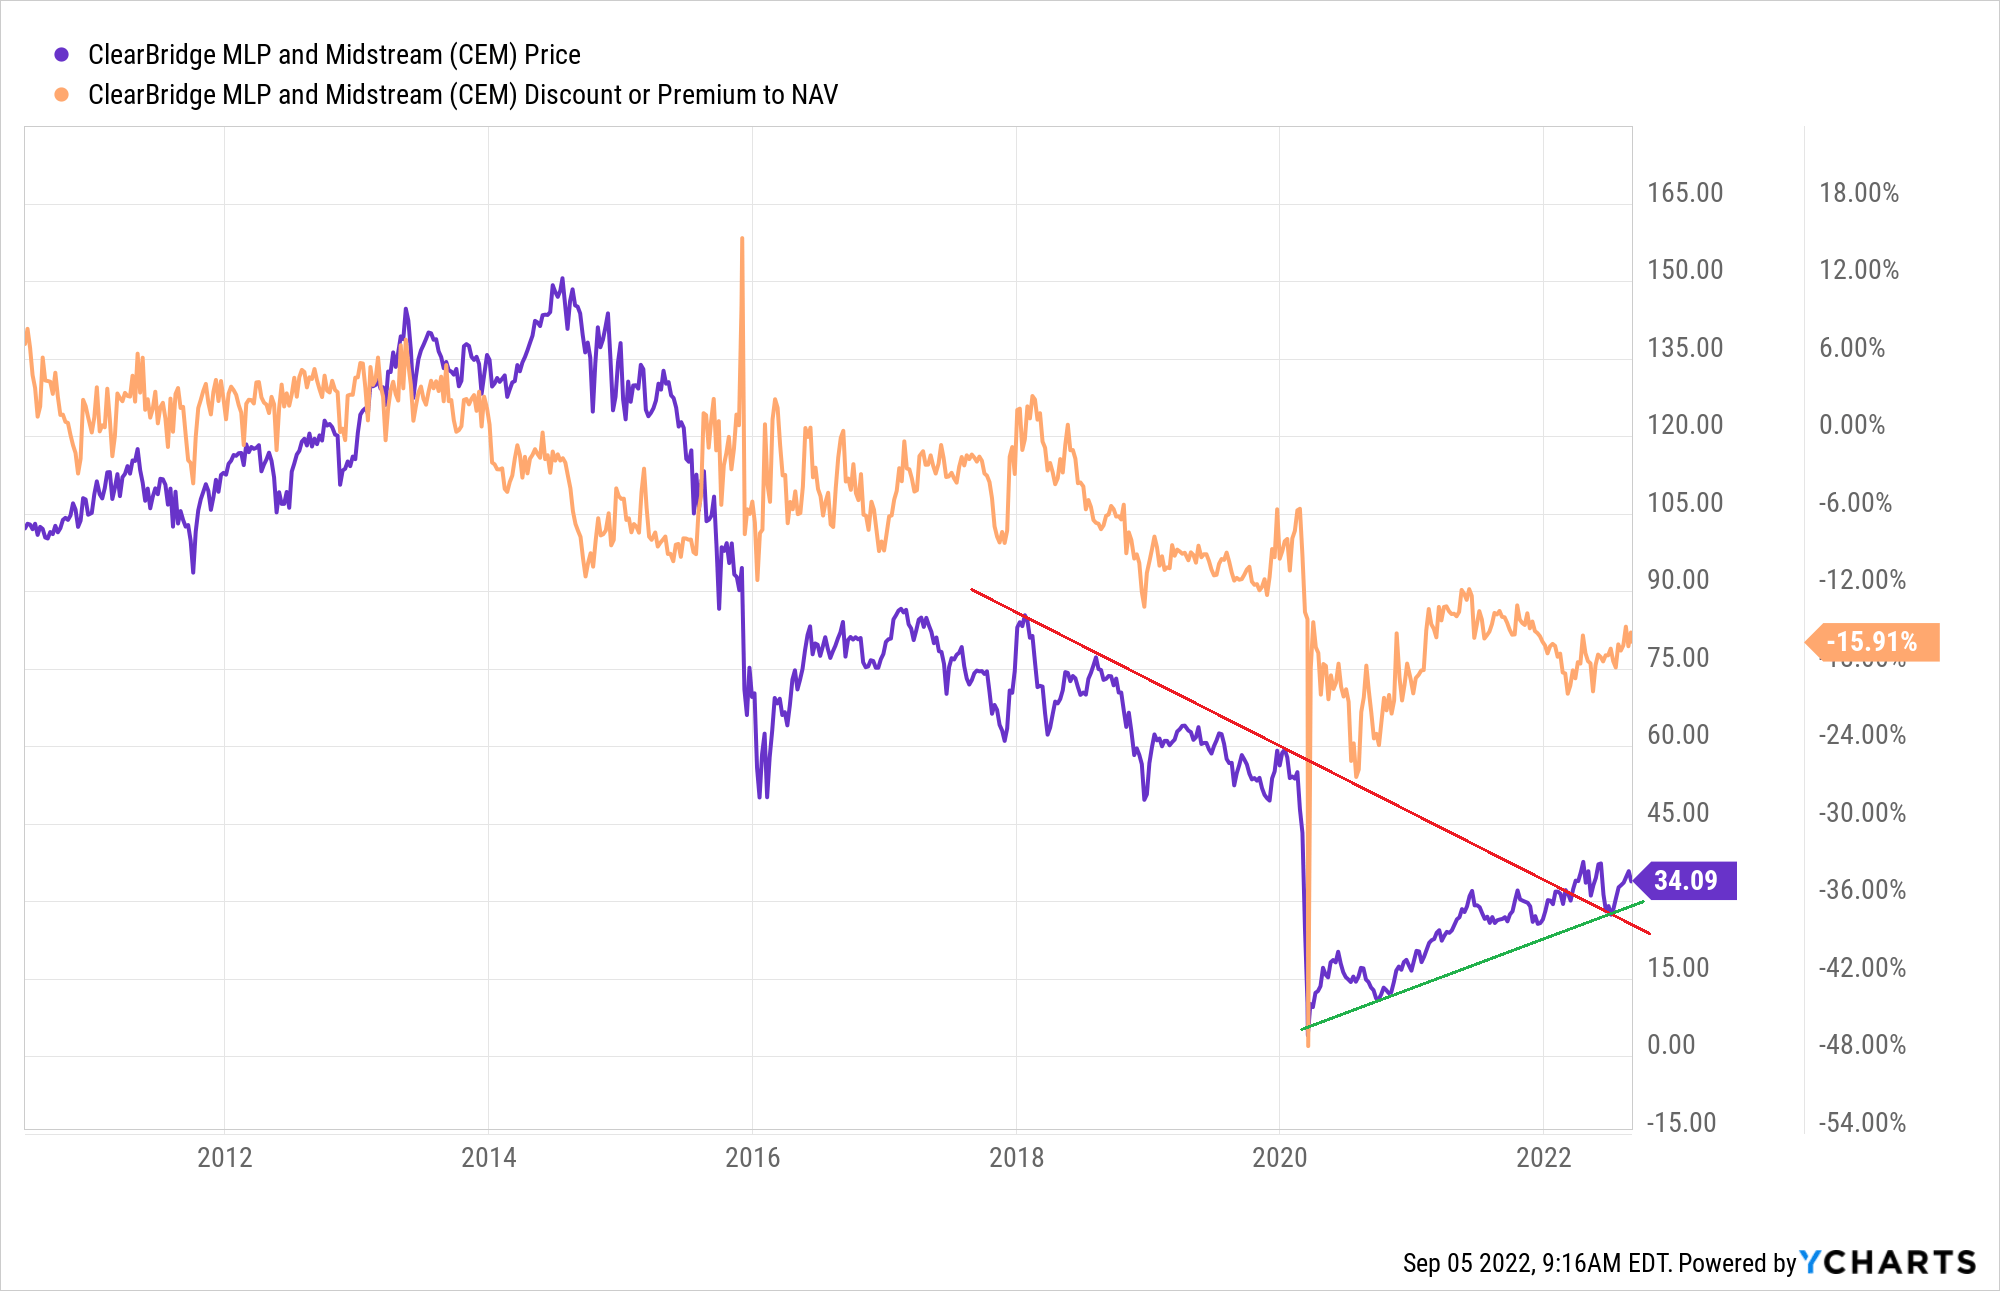
The fund has broken the multi-year declining trend (red line), and the resistance has now turned into support.
Having said that, the price is now somewhat stuck in the middle between 29-30 (where the green line reaches) to ~38 (52-week high; upper orange line).
Y-Charts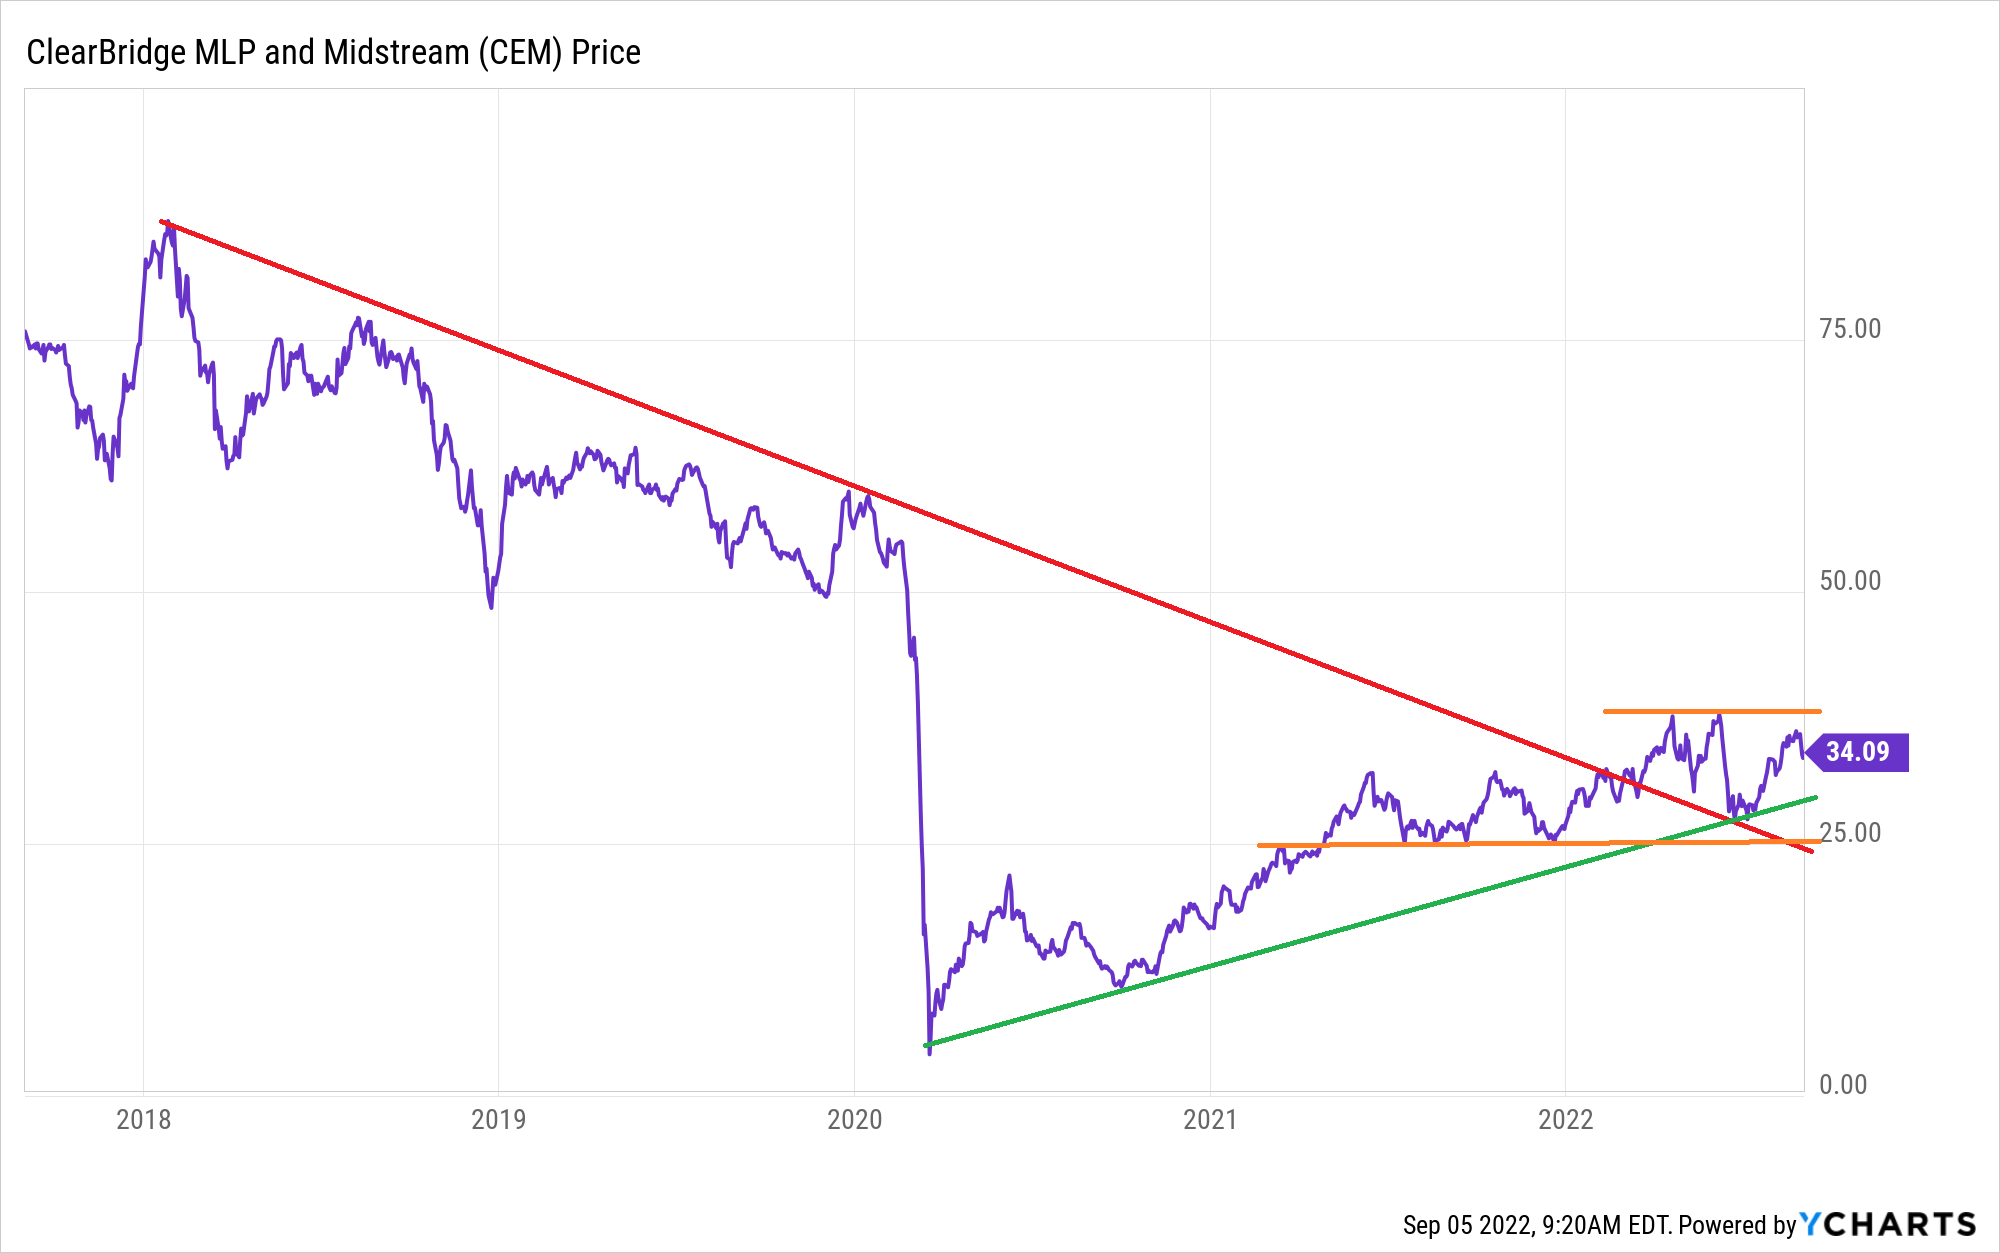
Naturally, CEM will go where its underlying assets will go, and its underlying assets will go where energy prices go.
As always, macro (energy as a whole) trumps micro (a single fund), therefore – if one is bullish on Energy – there’s no reason not to be bullish on CEM, and if one is bearish on Energy – there’s no reason not to be bearish on CEM too.
If the discount to NAV becomes tighter and/or if we decide to keep lightening up our exposure to the Energy sector, CEM might get sold, but for now – we intend to make no change to that position and we expect it to keep adding value to our FMP.
There’s no doubt that most of the bone on the CEM bone is gone already, and one mustn’t expect similar returns from this fund as the past 2-2.5 years have delivered. Still, we expect CEM to be in position to deliver a total return that is greater than its distribution rate, at least for as long as we will keep it.
Be the first to comment