

Darren415
This article was first released to Systematic Income subscribers and free trials on Nov. 19.
Welcome to another installment of our CEF Market Weekly Review where we discuss closed-end fund (“CEF”) market activity from both the bottom-up – highlighting individual fund news and events – as well as the top-down – providing an overview of the broader market. We also try to provide some historical context as well as the relevant themes that look to be driving markets or that investors ought to be mindful of.
This update covers the period through the third week of November. Be sure to check out our other weekly updates covering the business development company (“BDC”) as well as the preferreds/baby bond markets for perspectives across the broader income space.
Market Action
The CEF market was fairly flat this week. Municipal sectors outperformed due to a continued drop in longer-term Treasury yields. The CEF market has posted strong returns so far in November with all sectors up on the month.
Systematic Income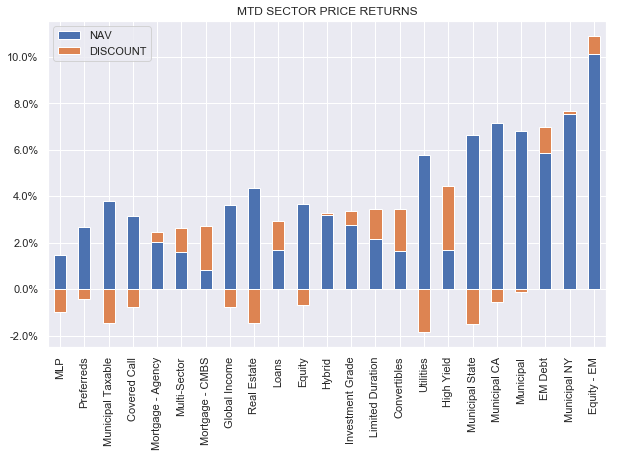
November is shaping up to be the second up month in a row.
Systematic Income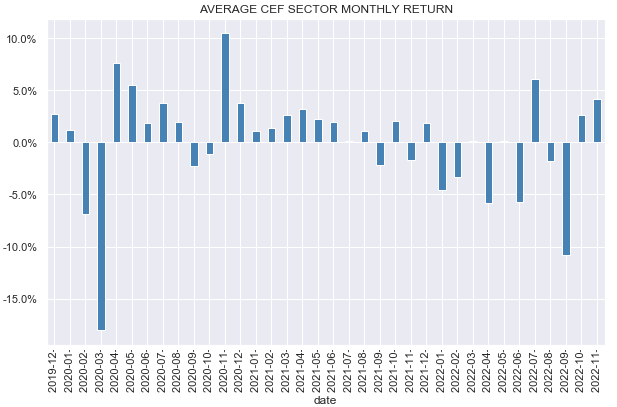
The space has clawed back around 5% off its low and close to half of its most recent drawdown in September.
Systematic Income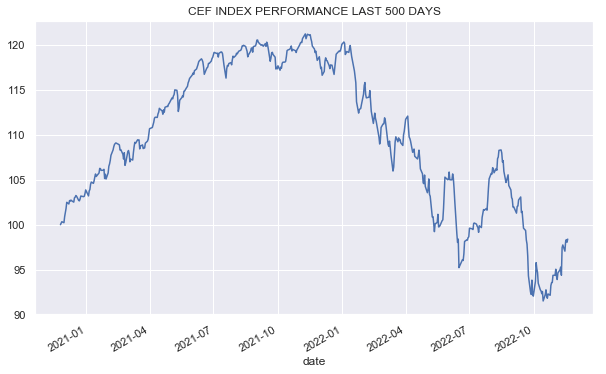
Discounts have continued to range-trade. Fixed-income sector discounts remain reasonably attractive by historical standards, though we are likely to see wider levels if we do enter a recession next year.
Systematic Income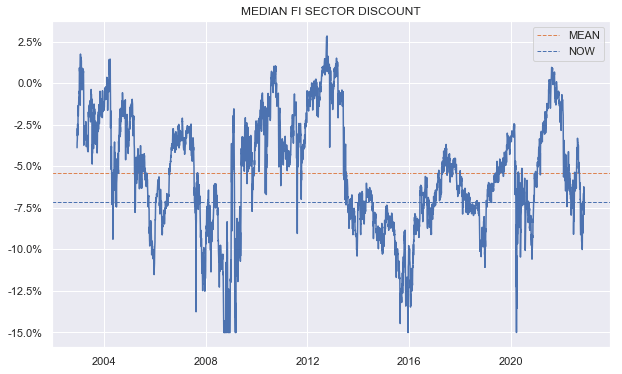
Market Themes
There was a question on the service about gauging the portfolio yield of an unleveraged Muni CEF. Before continuing it’s worth noting that it makes sense to distinguish between three different yields – 1) current yield, also called, distribution rate / yield, 2) net investment income yield and 3) what we call portfolio yield or yield-to-worst.
These three numbers are increasingly useful in the order listed. Current yield is largely at the discretion of the fund manager and so does not really tell us a whole lot about the yield that the fund’s underlying securities generate. Net investment income yield just looks at the coupons received by the fund, ignoring the important yield factor of pull-to-par. The last one tells us exactly what the fund’s underlying securities are yielding, both in terms of their coupon and their pull-to-par which, in our view, makes it by far the most important yield metric of the fund.
The best source for getting a good sense of the portfolio yield of a credit CEF would probably be the fund itself, however as many investors know, few CEF managers bother disclosing their portfolio yields.
BlackRock and First Trust do disclose the numbers although it’s not 100% clear how it’s done – it seems to be on an after-leveraged basis but they don’t make it clear.
The table below is from the First Trust Intermediate Duration Preferred & Income Fund (FPF) website.
First Trust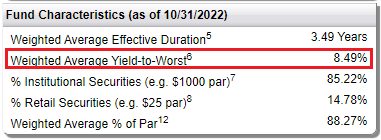
And this table is from the BlackRock Taxable Municipal Bond Trust (BBN) website.
BlackRock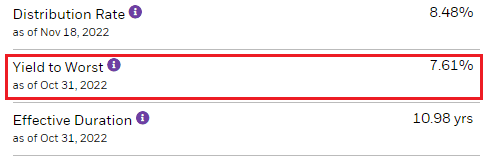
Nuveen used to show yields of individual holdings for each fund which you could easily aggregate, however they stopped posting the numbers for some reason.
For users with access to Bloomberg it’s possible to see the portfolio yield as shown below. Of course, few people do have access to the platform but it’s something.
Bloomberg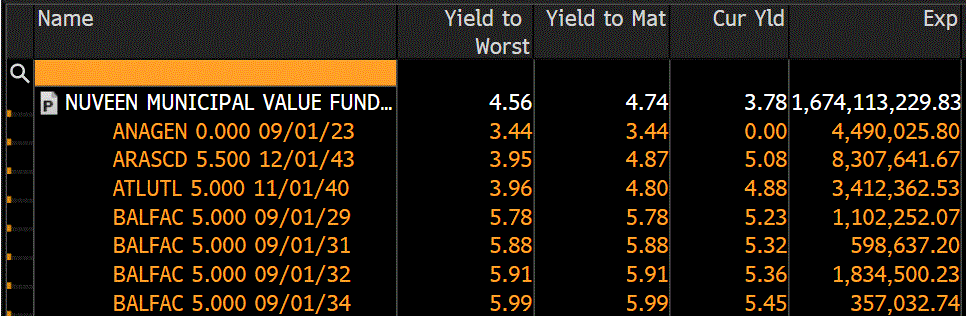
Finally, there are lots of workarounds / proxy estimates that investors can use. For asset classes like HY bonds, it’s possible to just use index yields from FRED for the relevant rating buckets and then do a sumproduct. It’s not going to nail down the number exactly but it’s a good first-order estimate.
Another way to do it is to use the weighted-average coupon, prices and durations that are sometimes published (Nuveen does this as shown below) – i.e. if the weighted-average holding price is $95 and the weighted-average coupon is 5% and duration is 5, then the portfolio yield is going to be around 6.25% (i.e. the 5% coupon on $95 plus the additional 1% per annum in pull-to-par). Again, not ideal but it’s a decent estimate.
Nuveen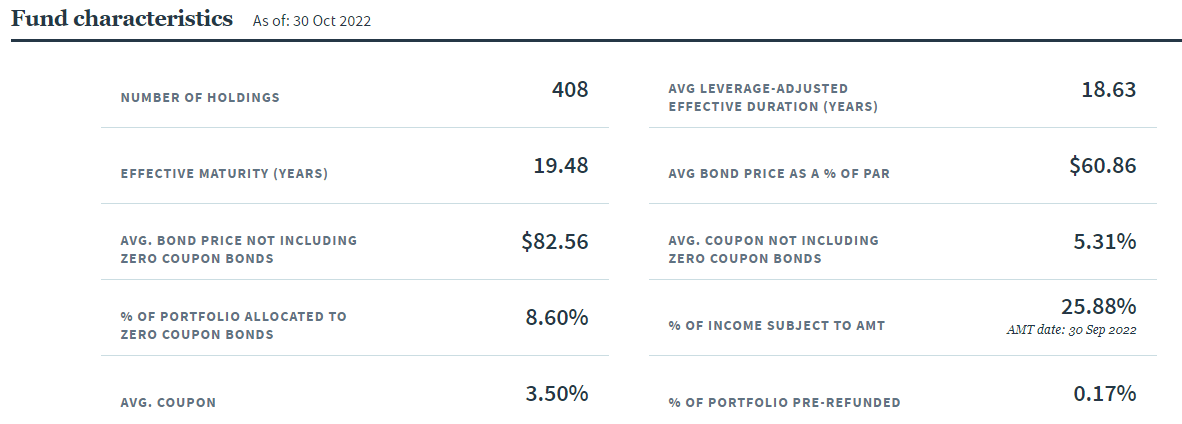
These things are particularly useful to do at price extremes, i.e. where the distribution rate of CEFs bears very little resemblance to the actual underlying portfolio yields. That was the case at the start of the year when bond prices were well above par and during the recent trough when they were well below par.
Market Commentary
With nearly everything having had a nice rally, term CEFs remain pretty attractive. Nuveen Corporate Income 2023 Target Term Fund (JHAA), which is a very short-dated focused HY CEF with an expected termination date at the end of 2023, is trading at a 4.3% discount. That’s on top of a roughly 5% yield on its portfolio of, roughly, 1Y High Yield corporate bonds. Together, that’s a 9+% yield over 1 year which is pretty good, considering 40% of that yield doesn’t require taking credit risk and the rest comes from mostly decent-quality (BBB/BB) short-term bonds.
The Nuveen Preferred and Income Term Fund (JPI) occasionally moves out to a 4-5% discount. At that level the discount amortization to zero equates to a 2-3% annualized yield or a total yield of around 10-11% which is pretty compelling for mostly high-quality financial preferreds. JPI remains a Buy-rated holding in our Income Portfolios.
Be the first to comment