

da-kuk/E+ via Getty Images
This article was first released to Systematic Income subscribers and free trials on Mar. 19
Welcome to another installment of our CEF Market Weekly Review where we discuss CEF market activity from both the bottom-up – highlighting individual fund news and events – as well as top-down – providing an overview of the broader market. We also try to provide some historical context as well as the relevant themes that look to be driving markets or that investors ought to be mindful of.
This update covers the period through the third week of March. Be sure to check out our other weekly updates covering the BDC as well as the preferreds/baby bond markets for perspectives across the broader income space.
Market Action
It was the first positive week for the CEF market in the last six with most sectors clocking in gains. Longer-duration sectors like munis and investment-grade bonds as well as MLPs underperformed on the back of rising Treasury yields and a reversal in energy prices.
Despite this reversal, CEFs are still down for the month of March which makes it the third month in the row of negative aggregate returns.
Systematic Income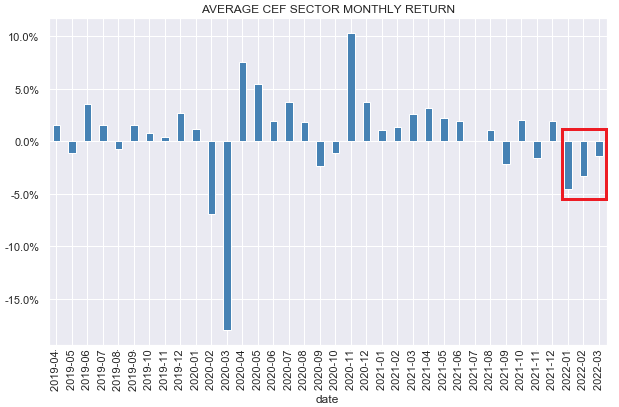
To get a sense of the recent bounce the chart below shows the performance of the CEF total return index. The chart makes it clear that the market has only clawed back a bit more than the last big dip that happened the previous week and remains more than 8% off its level at the start of the year.
Systematic Income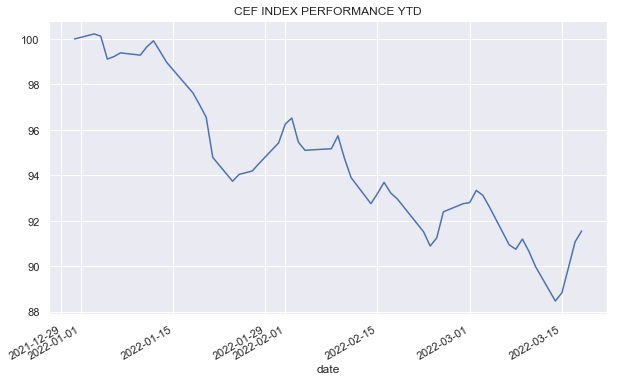
Each recent bounce back in discounts has resulted in a reversal wider – it remains to be seen whether this last bounce will be sustained or follow the trend this year. Overall, discounts are now in the fair-value zone, in our view.
Systematic Income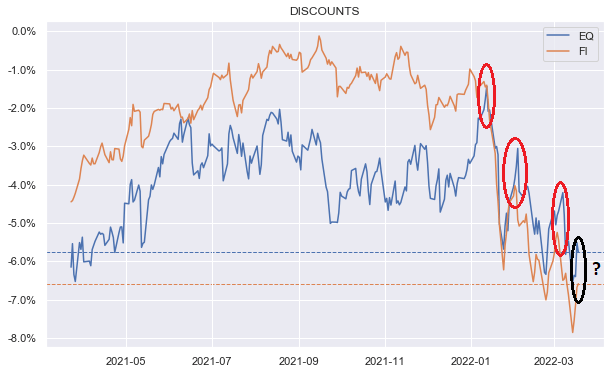
While this most recent respite in CEF performance is a welcome change from the unremitting weakness this year, in our view the CEF market is unlikely to stage a full recovery to levels at which it started the year for two reasons.
First, discounts are unlikely to come back to their earlier levels highlighted in red below. Historically, each time discounts moved off a similar peak it took at least several years to reclaim this elevated level. Another reason we are unlikely to move back to previous rich discount levels is because we expect CEF distributions to start moving lower in response to increased leverage costs. A drop in distributions is typically associated with a widening in the discount.
Systematic Income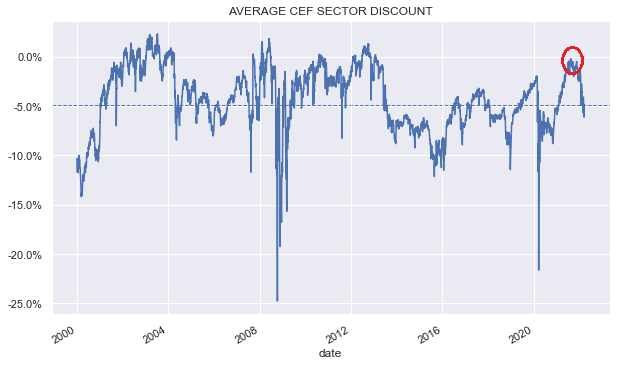
And secondly, longer-term Treasury yields have now reverted to, arguably, a more normal level. This means that some of the NAV losses of fixed-income CEFs are baked in and will not be reversed.
FRED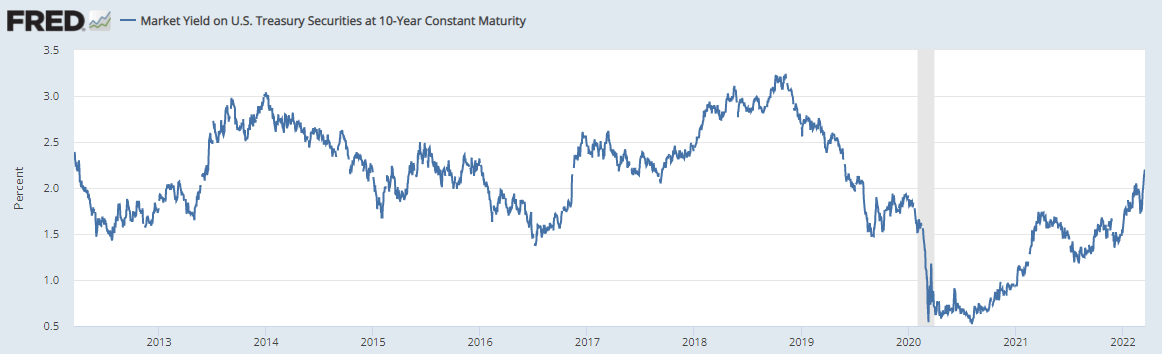
That may sound like a grim prognosis, however, there is a bright side which is that recent price weakness has resulted in higher yields on offer. This means that investors can reinvest their distributions at higher yields than at the start of the year as well as put some dry powder to work at more attractive yields. Ultimately, the sharp rally in CEFs in 2021 was unlikely to be sustained and the latest period of weakness has normalized valuations, leaving the broader market in a more sensible place.
Market Themes
Some investors take the view that they absolutely love CEF drawdowns. because it allows them to reinvest dividends at lower prices and higher yields. And this can make sense. However, there are three issues worth considering that should make investors more cautious in allocating a big chunk of their capital to securities that can exhibit large and regular drawdowns.
First, CEFs can lock in permanent economic losses if the drawdown also features a deleveraging (more likely in the case of a NAV drawdown than just the discount widening). And while it is possible to tilt to CEFs that are less liable to a deleveraging (either due to lower leverage level, more robust leverage instruments or a lack of leverage cap), a big enough drawdown will force all leveraged CEFs to deleverage.
The chart below is just one example of the consequences of a deleveraging that occurred in the Nuveen preferreds funds in 2020. And if investors think that this can’t happen to the “best managers”, the PIMCO Dynamic Credit and Mortgage Income Fund (PCI) – one of the premier fixed-income CEFs prior to its merger – was a significant victim of this dynamic in 2020 as well.
Systematic Income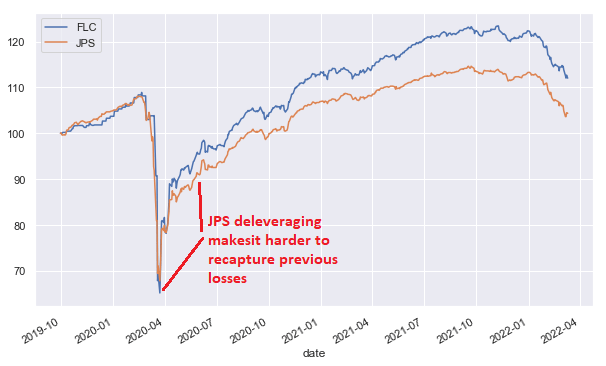
Second, because CEF discounts are pretty highly correlated it usually means that adding additional capital at lower prices means having to sell something else which is also at low prices. In other words, a portfolio that is all or nearly all allocated to higher-volatility CEFs offers fewer opportunities to reallocate to assets during drawdown because CEFs, even those allocated to very high-quality sectors, also tend to suffer significant drawdowns.
It’s a common refrain that CEFs are just a different kind of wrapper – there is nothing special about them. However, this doesn’t recognize the typical discount dynamic when prices underperform NAVs (i.e., discounts widen) during periods of volatility. This exacerbates already sharp CEF NAV drawdowns versus other types of investment vehicles, making it difficult to redeploy assets into attractively valued opportunities elsewhere.
Systematic Income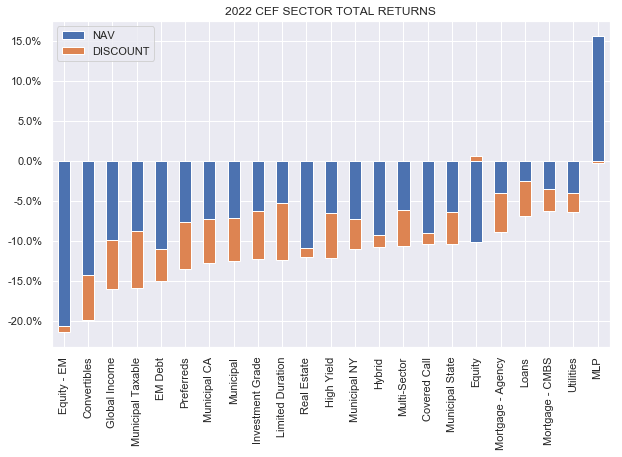
Third, a CEF that has seen its discount widen is no guarantee that it will bounce right back up. The CEF battlefield is littered with corpses of CEFs that now trade at much wider discounts than historically – the valuations of these CEFs are very unlikely to move back to previous elevated levels. In short, not every CEF dip is a buying opportunity.
Systematic Income
Fourth, few investors can “keep calm and carry on” while their portfolios take heavy losses. The bigger the drawdown the less conviction a typical investor will be able to maintain in their portfolios and the more likely they are to get out and sell at low prices. This suggests that investors who are able to maintain some ballast in their portfolios whether it’s through term CEFs, unleveraged CEFs or through non-CEF allocations may avoid locking in economic losses during periods of volatility.
Market Commentary
The PIMCO Access Income Fund (PAXS) is one that is well worth watching in our view. Its price behavior over the preceding weak was pretty messy which is suggestive of recent investors losing confidence in the new fund. Its recent bottom was $17.50 – a steep drop from its $20 IPO just a few weeks ago. Whoever got placed into the fund can’t be but unimpressed.
The fund reached a 9% discount recently – a very attractive level in our view – but this can easily be pushed wider into double-digit territory. The fund is more heavily allocated to CMBS and High-Yield corporate bonds in the suite.
It’s not clear what the fund’s leverage is – the latest monthly release says zero and this would make sense based on the fund’s relatively stable NAV which has outperformed the suite since its IPO. Duration is not shown on the website but is probably on the low side – likely around 3. The NAV of the fund has been the best-behaved since its IPO, particularly during the latest rise in Treasury yields. The fund does boast a relatively low distribution rate, however, we expect its income to be pretty comparable to the other taxable funds.
Systematic Income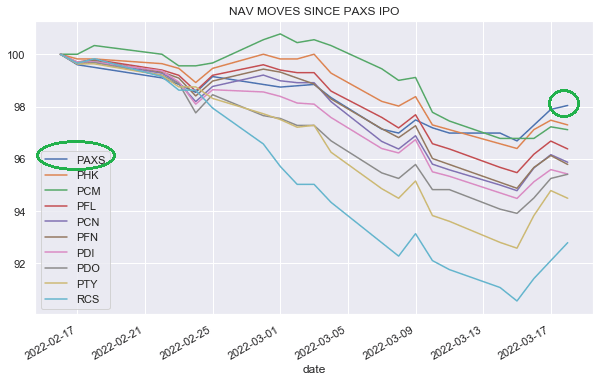
The RiverNorth/DoubleLine Strategic Opportunity Fund (OPP) released its latest shareholder report. It’s an interesting fund to look through for a glimpse of CEF income mechanics. On an annualized basis the fund earned $21.8m in total income and had $4.8m of expenses for $17m of net investment income. Versus an NAV of $13.03 and 19.2m shares ($250m of net assets) that comes out to a NAV NII yield of 6.79% – that’s the yield the NAV earns in income.
That doesn’t seem too bad, however, recall that OPP is financed entirely by preferreds. Series A and B and preferreds dividends are not expenses or interest costs because perpetual preferred stocks are capital just like common stocks are capital. So, just like common distributions are not subtracted from income to calculate NII neither are preferred dividends.
That is probably cold comfort to common stockholders since from a common stockholder perspective there is not a ton of difference from a fund that is leveraged via a credit facility (whose cost would be an expense and would come out of income to calculate NII) or one that is leveraged via a preferred. At the end of the day, both are costs of leverage. So, to get an apple-to-apple comparison we need to subtract preferred dividends out of OPP NII to get a true NII that includes its cost of leverage. The preferreds are paid roughly $5.4m per year out of the fund’s total investment income of $21.8. Once we take this into account the fund’s NAV NII yield comes out to just 4.63%.
That’s pretty low for a fund with a 32% leverage and pretty high management fees and below the yield of the OPP preferreds themselves despite preferreds being rated investment-grade. What’s important to keep in mind is that basically half the fund’s total income goes to pay its fees and preferreds dividends – this might be a decent bargain if the fund had significant upside such as what you see in BDCs but it doesn’t. The fund’s discount is pretty tight also so it doesn’t add much above its NAV NII yield.
In this market you don’t have to look very hard to earn something like 5% – you can easily find an investment-grade rated preferred or a relatively short-duration bond that gives you a higher yield on your capital. Obviously, the fund’s distribution rate of 14% is a million miles away from its real NII yield of sub-5%. However, also consider that the fund’s NAV is now 4% below its bottom during the COVID crash which is pretty bizarre – the price of JNK is 16% above its COVID bottom and SRLN price is 15% above its COVID bottom. This should make it pretty clear that the fund is basically just shoving its NAV out the door in the form of distributions which is certainly one way to run a fund.
Stance And Takeaways
We have been patient over the first two months of this sell-off, mostly staying on the sidelines as the CEF market ground lower. However, over the previous couple of weeks and before the recent bounce we turned more constructive on the market, particularly, as a number of funds we liked started to trade at or near double-digit discounts and as junk bond yields moved north of 6% – a more attractive level than the 4.3% at which we started the year.
The recent further rise in short-term rates and the consequent flattening in the yield curve makes longer-duration funds less attractive since they now offer a smaller yield pickup relative to shorter-duration assets. This is why we would tilt to funds with a shorter-duration profile.
Specifically, we continue to like:
- Western Asset Diversified Income Fund (WDI), trading at a 10.7% discount and an 8.5% distribution rate
- Ares Dynamic Credit Allocation Fund (ARDC), trading at an 8.4% discount and an 8.1% distribution rate
- BNY Mellon Alcentra Global Credit Income 2024 Target Term Fund (DCF)
- Barings Global Short Duration High Yield Fund (BGH), trading at a 9.3% discount and an 8.16% distribution rate
Be the first to comment