

Scott Olson
Cboe Global Markets (BATS:CBOE) is a diversified mainstay in financial markets across the globe. CBOE operates in 6 segments:
- Options – includes index, equity, and ETF options through various subsidiary exchanges
- North America Equities – which includes transaction services for U.S. equity and ETFs.
- Europe and Asia Pacific – includes the European listed equities and derivatives exchanges as well as various commodities.
- Futures – offers proprietary market data, access services, as well as transaction services for VIX futures and other futures products
- Global FX – offers FX trading services primarily for institutional clients as well as the licensing of proprietary market data
- Digital – focuses on digital asset spot and futures markets.
CBOE is a truly diversified intermediary among both products which can be traded as well as global access. With the various acquisitions that have been completed, CBOE now has 26 markets/exchanges which they operate.
CBOE Global Diversification (CBOE Investor Presentation August 2022)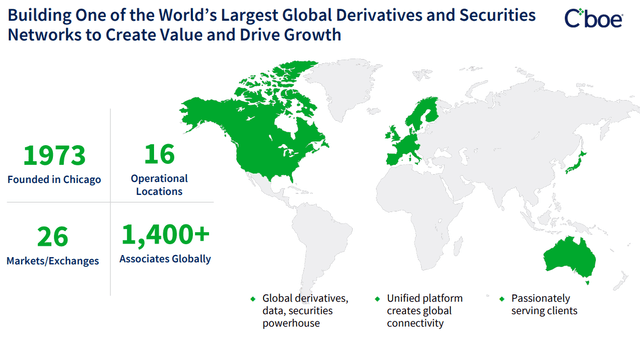
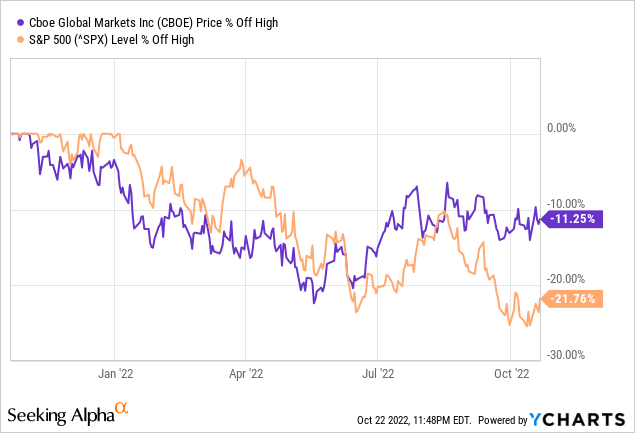
CBOE’s share price has held up better than the general market thus far in 2022. CBOE currently sits around an 11% pullback compared to the S&P 500’s 21% retreat.
Dividend History
When I began investing in individual companies, I decided to primarily focus on dividend growth investing. In practice, I target a variety of different companies across the dividend growth spectrum: from low yielders but fast growers, to mid-yielders and mid-growers, and even some high yielders but slow growers. I believe this helps to give me a balance between income today as well as income tomorrow although I aim for most of my investments to be in the first two of the three subsets.
CBOE Dividend History (CBOE Investor Relations)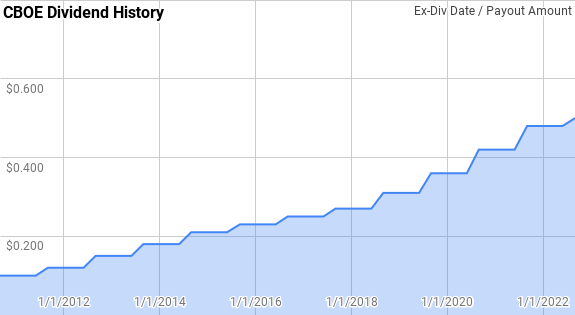
CBOE is a Dividend Contender with 12 consecutive years of dividend growth. CBOE has typically given strong dividend raises; however, the increase announced in August was just a meager 4.2%.
Since CBOE initiated a dividend in 2010, year over year dividend growth has ranged from 8.3% to 22.7% with an average of 14.3% and a median of 14.1%.
There’s been 8 rolling 5-year periods over that time with CBOE’s annualized dividend growth spanning from 11.4% to 17.1% with an average of 13.8% and a median of 13.5%.
The rolling 1-, 3-, 5-, and 10-year annualized dividend growth rates from CBOE since 2010 can be found in the following table.
| Year | Annual Dividend | 1 Year | 3 Year | 5 Year | 10 Year |
| 2010 | $0.40 | ||||
| 2011 | $0.44 | 10.0% | |||
| 2012 | $0.54 | 22.7% | |||
| 2013 | $0.66 | 22.2% | 18.2% | ||
| 2014 | $0.78 | 18.2% | 21.0% | ||
| 2015 | $0.88 | 12.8% | 17.7% | 17.1% | |
| 2016 | $0.96 | 9.1% | 13.3% | 16.9% | |
| 2017 | $1.04 | 8.3% | 10.1% | 14.0% | |
| 2018 | $1.16 | 11.5% | 9.6% | 11.9% | |
| 2019 | $1.34 | 15.5% | 11.8% | 11.4% | |
| 2020 | $1.56 | 16.4% | 14.5% | 12.1% | 14.6% |
| 2021 | $1.80 | 15.4% | 15.8% | 13.4% | 15.1% |
| 2022* | $1.96 | 8.9% | 13.5% | 13.5% | 13.8% |
*Assumes a 4Q payment of $0.50 per share
Source: Author; Data Source: CBOE Global Markets Investor Relations
The payout ratio is one of the quickest ways to judge the safety of a dividend. It’s not foolproof as we are investing today, but results are determined tomorrow and the competitive landscape can change.
CBOE Dividend Payout Ratios (CBOE SEC filings)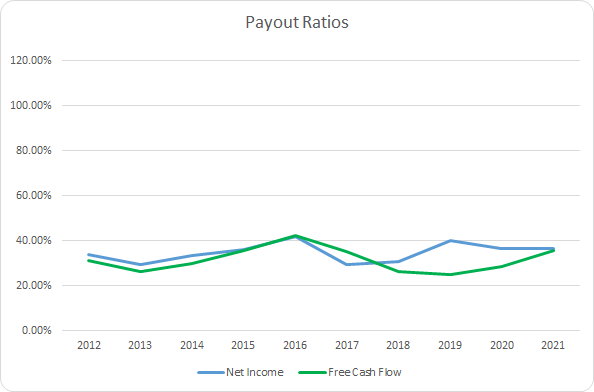
*Payout ratios in FY 2012 and FY 2013 have been adjusted to reflect just the regular dividend and exclude the $0.75 and $0.50 special dividends, respectively
CBOE’s payout ratios appear quite manageable and should allow for CBOE to continue growing their dividend in the future. The 10-year average net income payout ratio is 34.8% with the 5-year average coming to 35.6%. Meanwhile, the average free cash flow payout ratios are 31.5% and 30.0%, respectively.
Quantitative Quality
The key to investing for the long term is to find businesses that you understand and believe have a defensible positioning to keep competitors at bay. Companies that you believe are high quality and can continue to prosper no matter what competitors throw at them.
CBOE Revenue Profits and Cash Flow (CBOE SEC filings)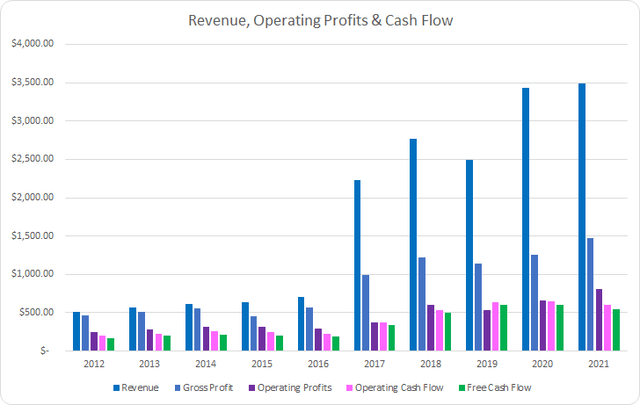
CBOE has seen remarkable growth over the last decade, although much of that was related to the Bats Global Markets acquisition in 2017. Over the last decade, revenues grew by 582% or 23.8% annualized. The average year over year growth excluding FY 2017’s jump is still an impressive 10.9%.
Operating profits increased by 230% over that same time or 14.2% annualized with operating cash flow rising by 198% or 12.9% annualized. Free cash flow improved by 220% or 13.8% annualized between FY 2012 and FY 2021.
I expect to see stable margins and preferably rising ones over time as the business is able to flex its relative strengths. I prefer to see free cash flow margins greater than 10% although the direction of those margins is equally important.
CBOE Margins (CBOE SEC filings)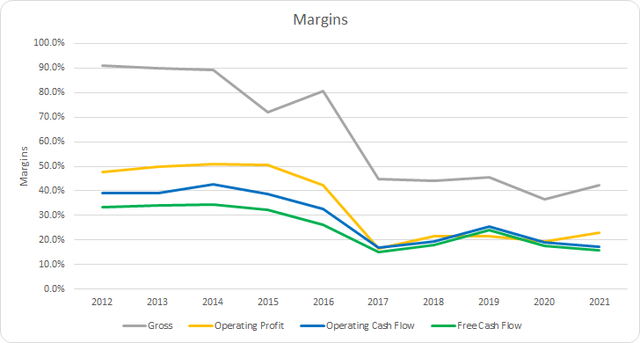
CBOE has handily surpassed the 10% free cash flow margin in each year over the last decade. The 10-year average is an impressive 25.1% although the 5-year average is just 18.0%. CBOE’s margin took a hit with the Bats acquisition; however, they still remain at strong levels.
An alternative measure of profitability is to look at how efficient a business is able to generate cash flow compared to its assets or capital base. Similar to the free cash flow margins, I want to see a free cash flow return on invested capital, FCF ROIC, greater than 10% that is preferably trending higher over time.
CBOE Free Cash Flow Returns (CBOE SEC filings)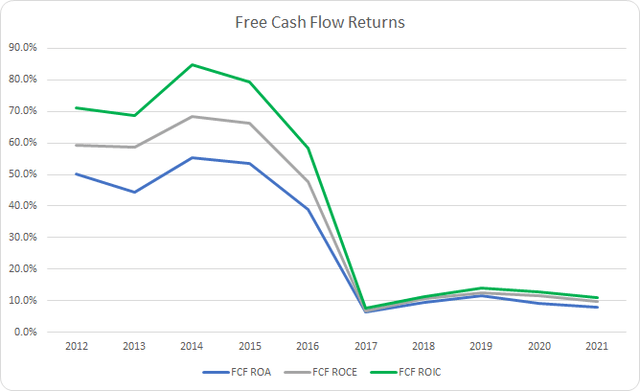
Once again we see a significant decline in FCF ROIC due to the Bats acquisition. That shouldn’t be too surprising as it dinged both free cash flow generation and substantially increased the capital base.
The 10-year average FCF ROIC is 41.9% with the 5-year average coming to 11.3%. Additionally, the 3-year average is showing a slight improvement to 12.5%.
To understand how CBOE uses its free cash flow, I calculate three variations of the metric, defined below:
- Free Cash Flow, FCF: Operating cash flow less capital expenditures
- Free Cash Flow after Dividend, FCFaD: FCF less total cash dividend payments (exclusive of special dividends)
- Free Cash Flow after Dividend and Buybacks, FCFaDB: FCFaD less net cash used in share repurchase activity
CBOE Free Cash Flows (CBOE SEC filings)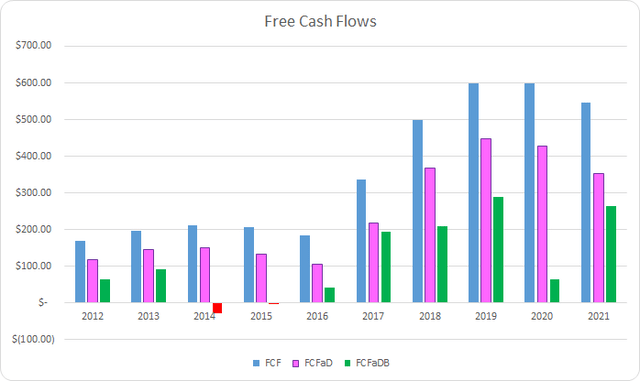
Between FY 2012 and FY 2021 CBOE generated a cumulative total of $3.55 B in FCF. They have sent a total of $1.08 B back to shareholders via dividend payments which brings the cumulative FCFaD to $2.47 B. CBOE has also used a net total of $1.27 B on share repurchases. As such the cumulative FCFaDB for that time frame is $1.19 B.
Excluding the special dividends that CBOE paid in FY 2012 and FY 2013, CBOE has spent roughly $0.85 on dividends for every net $1.00 used on buybacks.
I would prefer to see special dividends rather than buybacks; however, that’s an issue that isn’t likely to change in focus for most corporations. Buybacks, especially when done at opportune valuations, can be a boon to remaining investors as they reap the benefits of the lower share count as well as the difference in intrinsic value.
CBOE Shares Outstanding (CBOE SEC filings)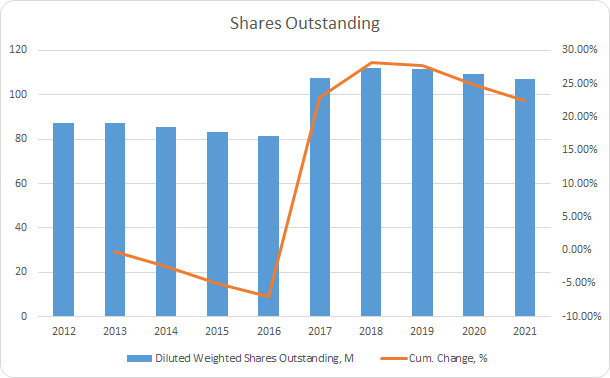
Between FY 2012 and FY 2021 CBOE has seen its share count rise primarily due, once again, to the Bats acquisition. Over that time the share count has risen by 22.5% in total or 2.3% annualized.
Excluding FY 2017 which saw a 32.1% increase in the share count, CBOE’s repurchases have averaged a 0.9% annualized decline.
When I invest my savings into a business, the aim is to be an owner for a period of time measured in years if not forever. With the goal being long-term ownership I want to make sure the balance sheet doesn’t pose any substantial risks to my equity stake due to excessive leverage.
CBOE Debt to Capitalization (CBOE SEC filings)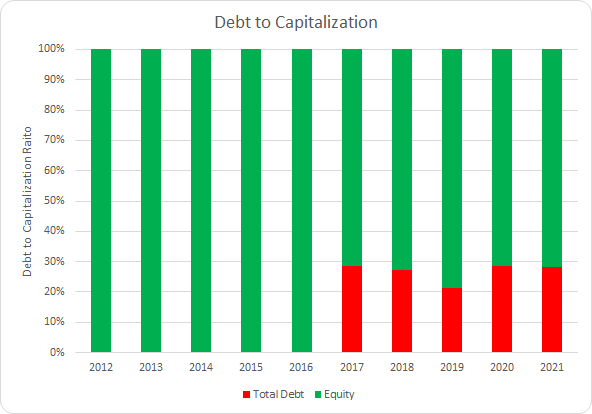
From a debt to capitalization standpoint, CBOE has seen an increase in their debt related to the Bats acquisition; however, it still appears relatively strong and best of all stable.
The 10-year average debt-to-capitalization ratio for CBOE comes to 13% with the 5-year average at 27%.
I place more emphasis on the net debt ratios when determining how much leverage is placed upon the business. In essence, the net debt ratios let you know how quickly the entire debt load could be reduced if the interest rate environment were to change as it has thus far in 2020.
CBOE Debt Ratios (CBOE SEC filings)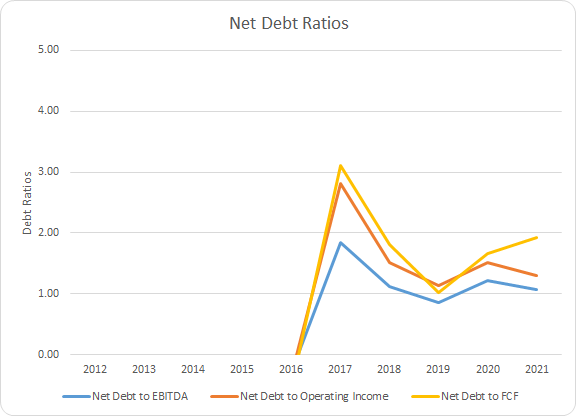
Prior to FY 2017, CBOE carried a net cash position; however since then their net debt ratios have risen. While they are technically worse than having the net cash position, they still appear in strong shape. The 5-year average net debt-to-EBITDA, net debt-to-operating income, and net debt-to-FCF ratios are 1.1x, 1.4x, and 1.6x, respectively.
How Did We Get Here?
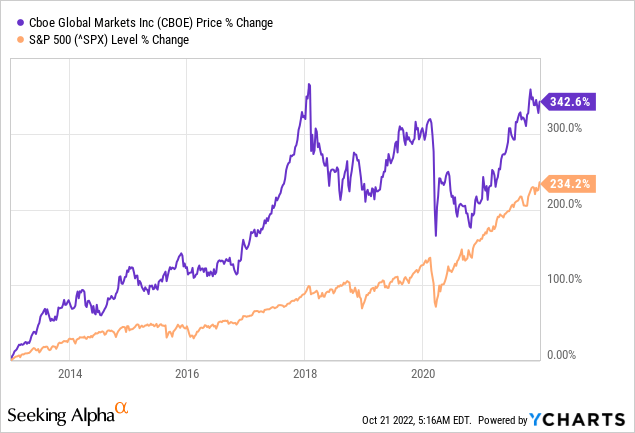
Between December 31, 2012 and December 31, 2021 CBOE’s share price rose 342.6%. That works out to a rather impressive 16.0% annualized increase. Add in the 1.8% dividend yield that CBOE shares offered and investors that have held on have earned around a 17.9% CAGR. CBOE’s share price has handily bested the S&P 500 which rose 234.2% over that same time frame or 14.3% annualized.
Over the long term, stock price performance should match the underlying business performance. However, over shorter periods of time, returns can be heavily influenced by changes in sentiment.
I’ve broken down the returns for the period between December 31, 2012 and December 31, 2021 to see what the drivers of the performance for CBOE has been.
- Business Returns: Measured by annualized change in revenue growth and net profit margin
- Capital Allocation Returns: Measured by dividend yield and annualized change in share count
- Sentiment Change: Measured by annualized change in beginning and ending P/E multiple
CBOE has shown strong revenue growth totaling 582.2% during that time due in large part to acquisitions. Unfortunately, that acquisition also weighed on net profit margin which declined from 30.7% to 15.1%. Combined the business justified returns for CBOE came to +13.8%.
Additionally, the acquisition led to an increase in the shares outstanding. Over that period, the share count rose by 22.5% in total which works out to a -1.9% annual return contribution. That brings the annual return contribution for capital allocation to -0.1%.
CBOE’s P/E multiple rose from a relatively meager 16.4x up to an arguably expensive 26.4x during that period. That’s a 61.4% total increase due to multiple expansion which puts the annualized return contribution for sentiment change at +4.2%.
| Annualized Returns | % of Returns | |
| Business Returns | 13.8% | 77% |
| Capital Allocation Returns | -0.1% | -1% |
| Sentiment Change | 4.2% | 23% |
| Total Annualized Returns | 17.9% |
Roughly 77% of the returns over that period was supported by the underlying business. Granted much of the increase in revenues and decline in profit margin was due to the acquisition which should fall under capital allocation. Combined with the capital allocation returns, we see a 76% supported return. That leaves the remaining 23% due to sentiment change.
CBOE Return Breakdown (CBOE SEC filings)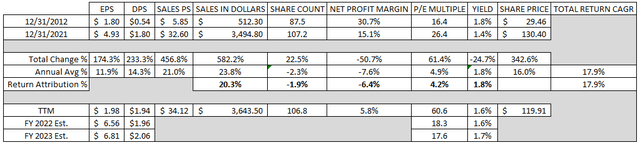
Valuation
The goal when investing is to purchase shares at intrinsic value or lower. While that’s easy in theory, it proves difficult in practice. Given the large number of uncertainties regarding the future, I try to focus on businesses that I believe are high quality and use three valuation methods to home in on a fair value range.
Dividend yield theory is simple valuation methodology based on the concept of reversion to the mean. It operates under the assumption that over time investors will value a business such that it offers a dividend yield around a typical level. For CBOE, I’ll use the 3-year average forward dividend yield as a proxy for fair value.
CBOE Dividend Yield Theory (CBOE Investor Relations and Google Finance)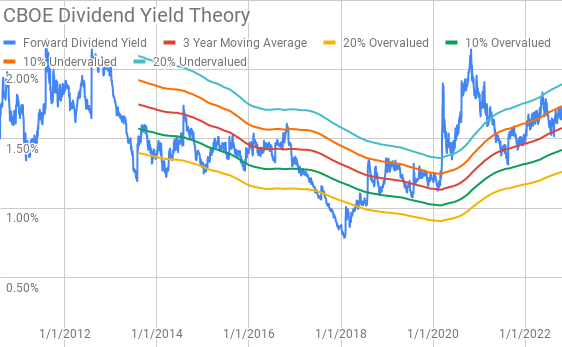
CBOE currently offers a forward dividend yield of 1.67% compared to the 3-year average forward dividend yield of 1.58%.
A reverse discounted cash flow model can be used to figure out what expectations are built into the current market valuation. In other words, by starting with the current market valuation, you can work backwards to figure out what kind of growth and margins the business must achieve in order to generate the returns that you target.
I use a simplified DCF model based on net revenue growth, an initial free cash flow margin versus net revenues of 30.0% that improves to 35.0% during the forecast period and a terminal growth rate estimated at 3.5%.
For the discount rate, I’ve used an estimated after tax cost of debt of 2.5% with a cost of equity of 10% and 8%. That yields a discount rate of 9.2% for the 10% cost of equity and 7.4% for the 8% cost of equity.
With the 10% cost of equity/9.2% discount rate scenario, CBOE needs to grow net revenues 8.7% annually during the forecast period in order to generate the cash flows that would support the current market valuation. The 8% cost of equity/7.4% discount rate scenario lowers the required net revenue growth to 3.1% annually across the forecast period.
A MARR analysis requires you to forecast the future earnings and dividends that a business will produce. You then apply a terminal or exit multiple on those future earnings at some future point to determine what the share price might trade at. If the expected return is greater than your minimum return for investment, then you can feel free to invest in the business.
Analysts expect CBOE to report FY 2022 EPS of $6.56 and FY 2023 EPS of $6.81. They also expect CBOE to be able to grow earnings at a 5.0% annualized rate during the next 5 years. I then assumed that CBOE would be able to maintain 5.0% annual earnings growth for the following 5 years. Dividends are assumed to be taken in cash.
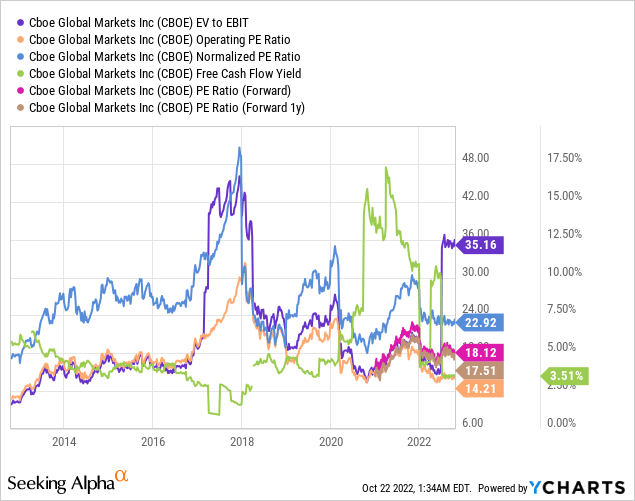
During the last decade, CBOE has typically been valued in the market between ~17x and ~30x TTM EPS. For the MARR analysis, I’ll examine terminal multiples spanning that range.
The following table shows the potential internal rates of return that an investment in CBOE could generate if the assumptions laid out above prove to be reasonable estimates of how the future plays out. Returns assume that dividends are paid and increased along the timeline that CBOE has typically followed and that dividends are taken in cash. Returns also assume shares are purchased at $119.91, Friday’s closing price.
| IRR | ||
| P/E Level | 5 Year | 10 Year |
| 30 | 16.6% | 11.5% |
| 25 | 12.7% | 9.6% |
| 22.5 | 10.5% | 8.6% |
| 20 | 8.1% | 7.4% |
| 17.5 | 5.5% | 6.1% |
| 15 | 2.6% | 4.7% |
Source: Author
Additionally I use the MARR analysis structure to reverse the process and determine what price I could pay for shares today based on the varying future terminal multiples. My base hurdle rate is a 10% IRR and for CBOE I’ll also examine 12% and 8% return thresholds.
| Purchase Price Targets | ||||||
| 10% Return Target | 12% Return Target | 8% Return Target | ||||
| P/E Level | 5 Year | 10 Year | 5 Year | 10 Year | 5 Year | 10 Year |
| 30 | $162 | $137 | $148 | $116 | $178 | $163 |
| 25 | $137 | $117 | $125 | $99 | $150 | $139 |
| 22.5 | $124 | $107 | $114 | $91 | $136 | $127 |
| 20 | $111 | $97 | $102 | $82 | $122 | $115 |
| 17.5 | $99 | $87 | $90 | $74 | $108 | $103 |
| 15 | $86 | $77 | $79 | $65 | $94 | $91 |
Source: Author
Conclusion
CBOE has managed to show strong growth over the last decade albeit aided by acquisitions. Unfortunately, that did put a hit on their margins; however, overall it was a solid tradeoff as it expanded their offerings and made the business stronger.
CBOE carries modest levels of debt which is proving to be a smart decision as the pace and trajectory of interest rates so far in 2022 increased the risk level for heavily indebted businesses. Especially those with near term debt that must be refinanced and potentially done so at much higher interest rates crimping down their cash flows as interest obligations rise.
Dividend yield theory puts the fair value range for CBOE between $115 and $141 suggesting that shares are trading towards the lower end of fair value.
Additionally, the reverse DCF analysis suggests that 10% returns could be hard to come by for investors at current levels, but 8% returns should be quite achievable as there’s very modest growth required.
However, the reverse DCF does not account for share repurchases which would reduce the required growth accordingly. CBOE currently has $552.2 M remaining on its existing repurchase authorizations. Based on the average FCFaD from the last 3 years, CBOE could repurchase ~2.9% of outstanding shares based on the current market capitalization of $12.6 B.
The MARR analysis based on 10% IRR targets 5 years out and a terminal P/E ratio between 17.5x and 22.5x puts the fair value range between $99 and $124. Although with 8% IRR targets, the fair value range rises to $108 to $136. However, the fair value range drops to just $90 to $114 with a 12% IRR target.
Another quick valuation method is the Graham Number which attempts to value the business while incorporating the effect of interest rates on valuation. The Graham Number method suggests a fair P/E for CBOE given the modest growth expectations closer to 14x given the rise in interest rates.
CBOE needs very little capital to grow as evidenced by its relatively meager CAPEX needs. Over the last decade, CAPEX as a percent of sales has averaged just 3.9%.
The base CBOE business should continue to show steady growth overtime at least in the mid-single digit range. Management is forecasting for 5-7% organic revenue growth over the medium-term which doesn’t appear overly optimistic unless trading activity grinds to a halt.
CBOE Growth Priorities (CBOE Investor Presentation August 2022)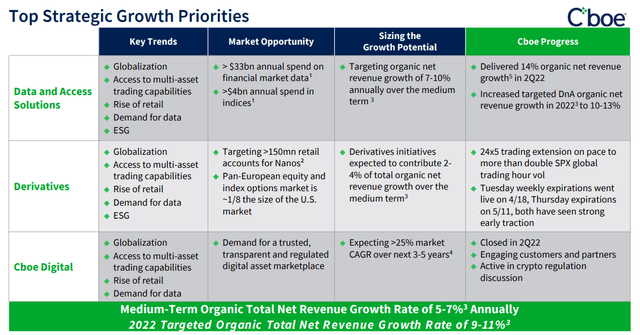
I fully expect CBOE to continue to explore M&A opportunities which will continue to strengthen the core CBOE business by expanding into new markets or assets.
I’d prefer to purchase additional shares in the $110 area; however, in my opinion CBOE is likely trading within the range of fair value and should offer investors solid returns over time. Their capital light business model has little CAPEX needs which means nearly all cash flow that CBOE generates can accrue on investors’ behalf through continued dividend growth, debt reduction, share repurchases, or M&A.
Be the first to comment