

Pgiam/iStock via Getty Images
Investment Thesis Summary
There are numerous selective opportunities on sale within the broad healthcare segment at present. Starting valuations in many names are now far more respectable, and various short-term volatility drivers have opened up the gates for allocation in our opinion. Here we turn to Catalent, Inc (NYSE:CTLT) after its selloff at the back end of 2022. It’s worth noting that CTLT also caught attention after Glasshouse Research published a short thesis on the company. In that report, Glasshouse attempt to unpick CTLT’s free cash flow position, however, have failed to make any mention to the correlation to return on invested capital. Moreover, the recent selloff is in-line with the broad equity selloff in 2022 [Exhibit 1]. It was also cleared from the FDA’s form 483 reports based on the company’s Belgium and Bloomington facilities back in November.
Here, I’ll demonstrate our findings on the same, and note how the free cash outflows are more than acceptable given the cash is being allocated to generate substantially high return on investments that outpaces the WACC hurdle. This is more important than ever in the current macroeconomic climate. Net-net, we rate CTLT a buy with a starting price objective of $56 or 19.7x forward P/E.
Exhibit 1. CTLT selloff across 2022 in-line with broad equity market selloff
Data: Updata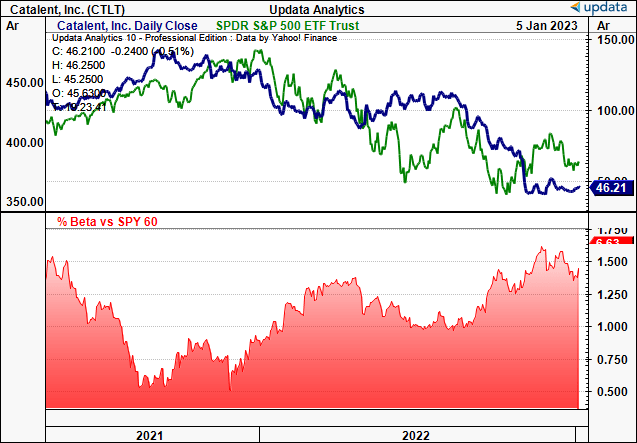
Q1 FY23′ numbers a reasonable springboard to bounce from
It was a big period for CTLT with plenty of data to digest. I believe this highlights where the company is demonstrating its operating strengths and weaknesses. I’ll just point out as well that Q3 FY22 corresponded with CLTL’s Q1 FY23′, and will therefore be talking in these terms from hereon in.
Firstly, we noted CLTL’s 1st quarter revenue of $1.02Bn, which remained unchanged on a reported basis, but a 400bps YoY increase in cross currency (“cc”) terms. It clipped this top-line result on adjusted EBITDA contraction of 26% to $187mm, representing 18.3% of turnover. This was primarily due to a decrease in COVID-related activity. It pulled this down to adjusted net income of $61mm or $0.34 per diluted share. This is a marked downstep from the $0.71 in diluted EPS reported same time last year.
Exhibit 2. CTLT long-term quarterly revenue, core EBITDA recognition
Data: HBI, Refinitiv Eikon, Koyfin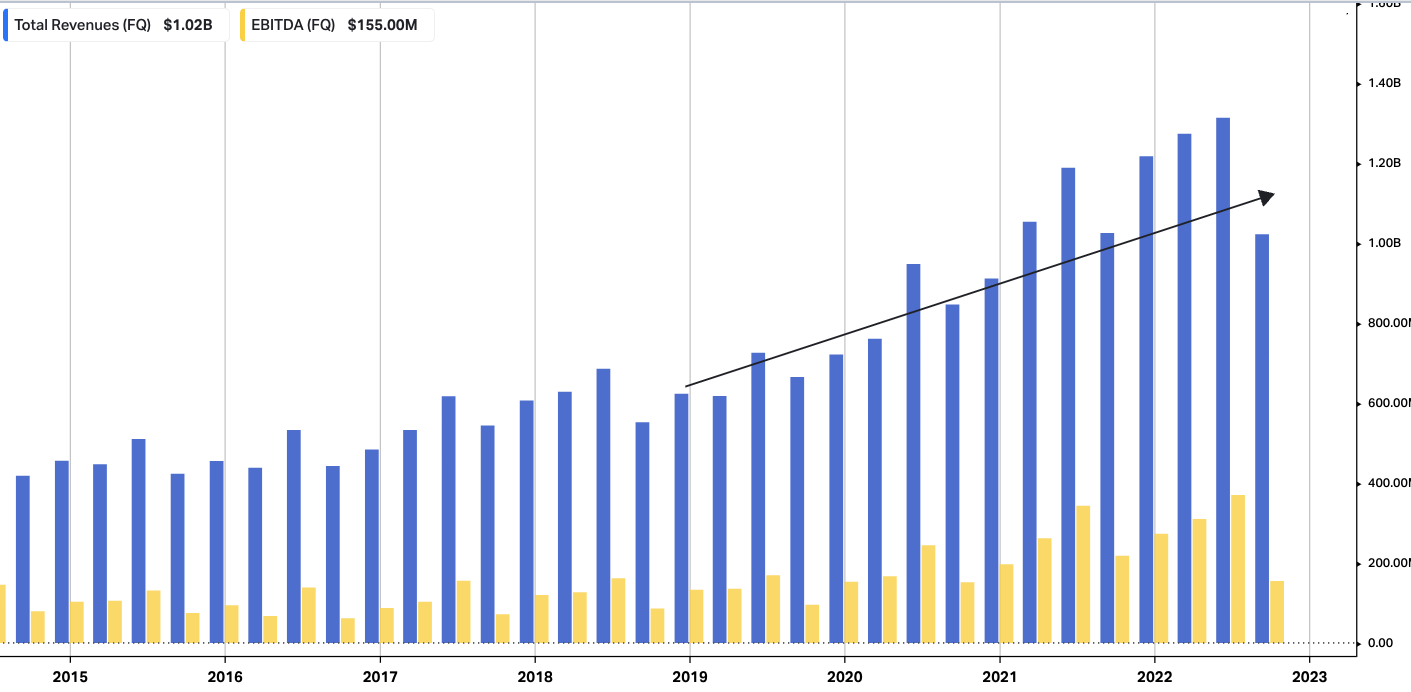
Importantly, by the end of its Q1 FY23′, CTLT’s contract asset balance amounted to $461mm, a sequential increase of $20mm compared to June 30, 2022. The majority of this increase can be attributed to large development programs. In particular, we feel it’s important to highlight that a bulk of the upside was driven from the biologics business. Why this is important, is that CTLT booked its quarterly revenue based on a percentage of completion, rather than on receipt of payment. To us, this addresses a portion of the claims listed short report discussed earlier.
Now turning to the company’s non-COVID-19 operations. Organic growth of non-COVID offerings exceeded 20% in cc terms. This growth was underscored by the cell and gene therapy enterprise within the biologics segment, helped by the clinical development services in the pharmaceutical and consumer health segment that clipped $499mm in quarterly revenue, up 11% YoY. Management noted these divisions are starting to “benefit from commercial synergies under the new organizational structure.”
It’s also worth pointing out that biologics segment’s turnover for the first quarter pulled in to $523mm, a decrease of 200bps YoY. This wind-back revolved around CTLT’s take-or-pay contracts for a COVID vaccine that was not booked as revenue in Q1, but had been expected to previously. However, this could be a near-term tailwind, as the company expects to recognize the stalled revenue after fulfilling performance obligation for the respective client in Q2 FY23′ [corresponding to Q4 CY2022′].
Management was adamant that should this amount be included to the top-line, this would have offset the decrease in revenue from COVID-19 sources. Still, EBITDA margin for the biologics segment 21.5%, a decrease of contracted 900bps YoY 21.5%. Margin compression was primarily due to underutilized capacity, as well as ongoing remediation activity in Brussels and negative carry related to its Princeton and Oxford facilities.
CTLT fair view of fundamentals
Peeling back the layers further on the company’s fundamental drivers is where the value is seen in CTLT. The decline in its bottom-line estimates is well noted, but we think this could already be priced in from the last earnings.
For those looking at Exhibit 3, you’ll note that CTLT has continued to generate sequential upsides in return on invested capital (“ROIC”) these past 2 years. It realized a c.10% trailing ROIC in the last quarter, above the term average over this time.
Meanwhile, you’ll also note that it has printed a series of free cash outflows during the testing period. We’re happy with this setup, as a negative FCF is more than acceptable if the ROIC is lifting, and comfortably outpaces the WACC hurdle. This evidences that CTLT can sufficiently fund its own growth initiatives looking further down the line, which is integral in turning its share price around.
Exhibit 3. CTLT quarterly ROIC, FCF and NOPAT generation continuing to demonstrate idiosyncratic strength
Data: Author, CTLT SEC Filings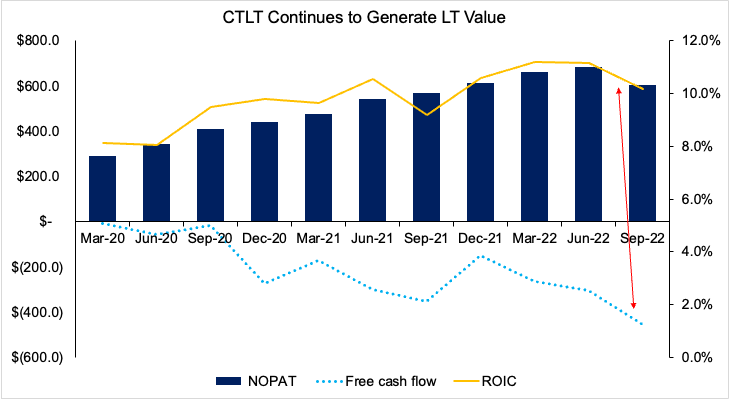
To examine this, we performed the calculus in determining CTLT’s economic value added (“EVA”) since September CY2021. You’ll note in Exhibit 4 that management have generated substantial EVA over this period, realizing $42.8mm in the last quarter in spite of all the COVID-revenue challenges.
Moreover, you’ll also see that the spread above the cost of capital is of statistical significant as well [Exhibit 5]. This is essential in the CTLT investment debate, and demonstrates that it can unlock mid-term value for equity holders downstream.
Exhibit 4. EVA creation for the past 12 months has been a standout feature in our investment findings for CTLT
Data: Author, CTLT SEC Filings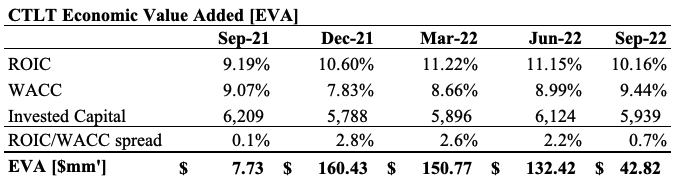
Exhibit 5. Despite a pullback from previous highs, CTLT is still generating ROIC above the cost of capital. To us, this signals value creation further down the line.
Data: Author, CTLT SEC Filings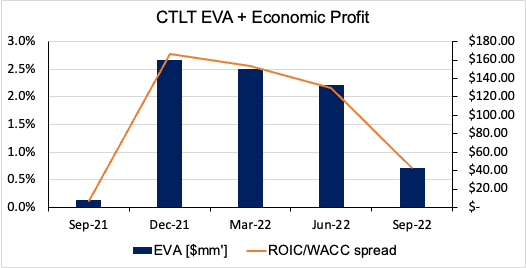
CTLT expects to see full year net revenue in the range of $4.625 billion to $4.875 billion, representing a decline of 4% at the low end of the range. The negative impact of foreign exchange (“FX”) on both revenue and adjusted EBITDA is expected to be ~100bps more than previously anticipated.
It is worth noting that the guidance provided in August already included a negative FX impact of approximately 300-400bps on CTLT’s revenue and adjusted EBITDA growth. Management also projects adjusted EBITDA of $1.22 billion to $1.30 billion, representing a decline of 5% at the low end. It expects to pull this down to adjusted net income of $567mm-$648mm, reflecting a YoY decline of 18%.
CTLT technical picture
You can see the impact from the CTLT selloff during 2022 in the chart below. A substantial portion of equity value was wiped from the slate during the selloff. It now trades well below the 50DMA and 250DMA’s, with the gap widening at current market levels.
The question really is if all the ‘bad news’ has been priced in, and it CTLT has found a bottom. Presuming it has in one scenario, and tracing the fibonacci levels down from the last high, the stock has already tested the 21% level and been rejected. These are weekly bars, so the stock has closed higher for the past 2 weeks to the time of writing.
However, it needs to push above this level in order to restart a new rally. Hence, the next targets would be $52 then $60, otherwise 38% of the full retracement. To this note, there’s been good volume support exhibited over these past 3 weeks which could instate this.
Exhibit 6. Fibonacci retracement from former high, CTLT needs to push back above the $51 mark to restart a new rally.
Data: Updata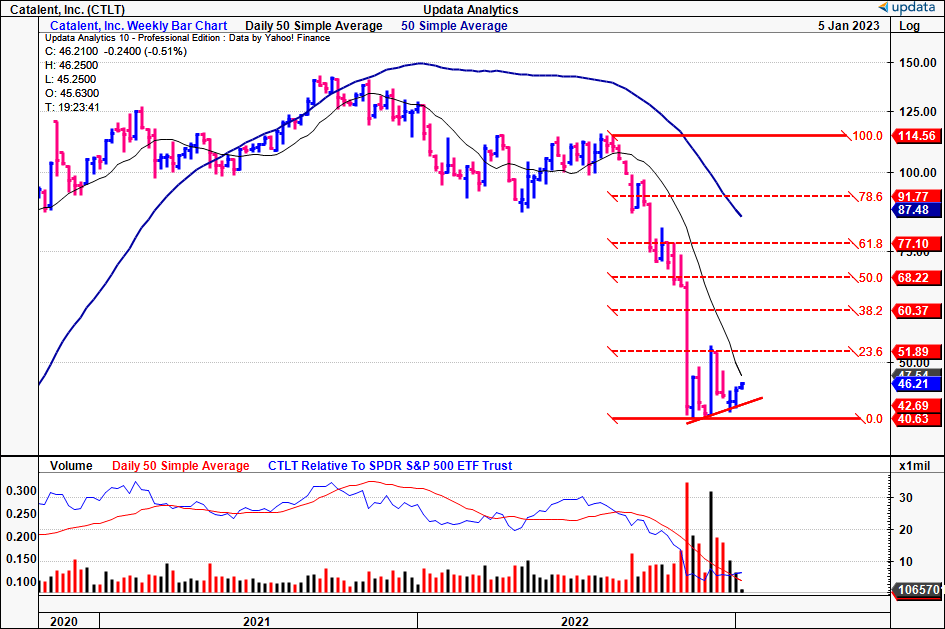
At the same time, there’s plenty of upside support from our point and figure studies. We have upside targets to $73, despite a $31 downside targets. If we take the arithmetic mean of this breadth, it lands to $52. Hence, a breadth of $73 to $31, with a mean of $52.
Exhibit 7. Multiple target ranges with upside skew from $52-$73
Data: Updata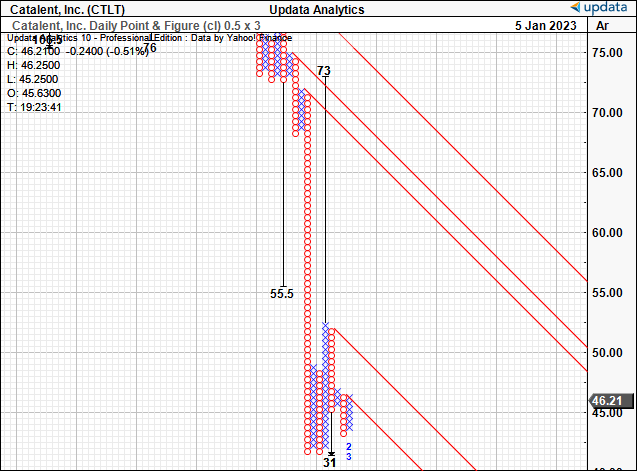
Valuation and conclusion
The starting valuations with CTLT are incredibly important in justifying opening a buy position. We’d note it trades at 1.8x book value, on a trailing ROE of 9.38%. Therefore, the investor ROE at this multiple is 5.2%.
It also trades at 19.8x trailing earnings and 20.4x forward P/E, both 21% and 18.6% below the sector median, respectively, and more than 64.6% and 57% off its 5-year averages, respectively. Using non-GAAP EPS, CTLT is 13.4x trailing EPS.
We’ve also got the stock priced at 10x forward EBITDA, more than 46% below its historical averages. To us, these are incredibly attractive multiples that offer potential valuation upside looking ahead.
Moreover, using consensus’ $2.84 full-year EPS estimate, we see CTLT at a fair forward P/E of 19.7x. Assigning this multiple to the $2.84 derives a price target of $55.95, in-line with ranges described above. Hence, our first price objective is set to $56.
Exhibit 8. Fair forward P/E 19.7x $2.84 EPS estimate = ~$56
Data: Author estimates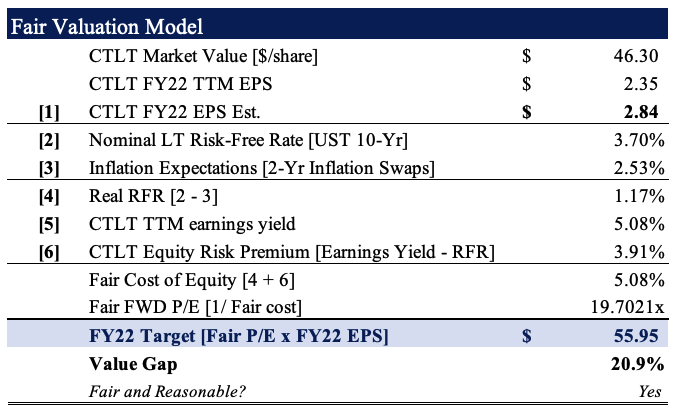
Net-net, we believe there’s enough evidence to suggest CTLT is a buy after its recent selloff. Starting valuations of 13x non-GAAP trailing EPS are attractive and offer potential for valuation upside looking ahead. Furthermore, the company’s ROIC and NOPAT generation are a standout, whilst it continues to unlock economic value for shareholders. We believe this has scope to remain in situ looking down the line. Rate CTLT a buy, first price objective to $56.
Be the first to comment