

onurdongel
Carrier Global (NYSE:CARR) operates in attractive and growing end markets. The company sees opportunities in the growing middle class in Asia, digitalization opportunities, and in serving the wellness market. But, the company had a huge run over the past three months, and its momentum may be slowing. The company offers a low dividend and carries a high debt load, but most of the debt is due after 2026. The company’s profit margins have suffered due to cost inflation. Price increases have bolstered sales, but the market may not take any more price increases in this interest rate environment. The company’s inventory has increased substantially, signaling a slowdown in sales. A discounted cash flow model indicates that the company may be overvalued at current prices. Investors holding the stock may be better off owning the stock for the long term. New investors may be better off waiting for a pullback in the stock.
Margins take a hit in a high-inflation environment
The company has grown annual revenue by 4% on average since 2017 (Exhibit 1). During the pandemic, the company’s quarterly revenue growth rate improved to 10% on average (Exhibit 2), but revenue growth decelerated in 2022.
Exhibit 1:
Carrier Annual Revenue & Growth Rate (Seeking Alpha, Author Calculation)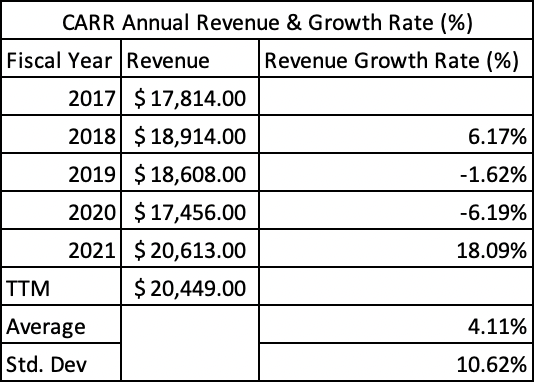
In Q2 2022, the company saw organic revenue growth of 7%. But, a strong dollar was a headwind for the company, which reduced revenue by 3%. The company also saw a decline in revenue due to divestitures. The company saw organic sales growth of 8% in Q3 2022, but the strong dollar continued to be a headwind. Strong pricing was the biggest driver of revenue growth.
Exhibit 2:
Carrier Quarterly Revenue & Growth Rate [Mar 2020 – Sept 2022] (Seeking Alpha, Author Calculation)![Carrier Quarterly Revenue & Growth Rate [Mar 2020 - Sept 2022]](https://static.seekingalpha.com/uploads/2023/1/16/saupload_-8qKZHMgv7enY9LE-vkyNXtmKube0jS1V-2IXurS353syVIZgbVLs2UNq02GcGX7wkYv0c_68x9iBBDdFJudce6Y6wlKasYJVp_VCZ1cjzXR-5UoPSOQcDsRzSGLH5M-2idNWUZpuXUsw8jJijI3m4EbrN1iBoi1oAiWuLRXFNi6SHoz3pIeosYLFFTnMg.png)
Since 2017, the company’s gross margin has averaged 29.3%. But cost increases and the impact of divestitures were a headwind to margin in 2022, with the quarterly gross margin dropping to 27.1% in September. Since March 2020, the quarterly average operating margin has fallen from an annual average of 13.7% to 12.3%.
High inventory levels are a concern
Consumer staples and industrial companies have seen an increase in inventory over the past year as cost inflation coupled with cooling demand has dampened sales and increased the inventory on hand. In 2020 and 2021, the company’s inventory increased by over 20% (Exhibit 3). In the trailing twelve months of data, inventory has increased by 35%, and the company had 65 days’ worth of sales in inventory compared to its average of 43 days. With interest rates continuing to increase, the company may see lower sales and not have the pricing power it previously had.
Exhibit 3:
Carrier Day’s Sales in Inventory (Seeking Alpha, Author Calculations)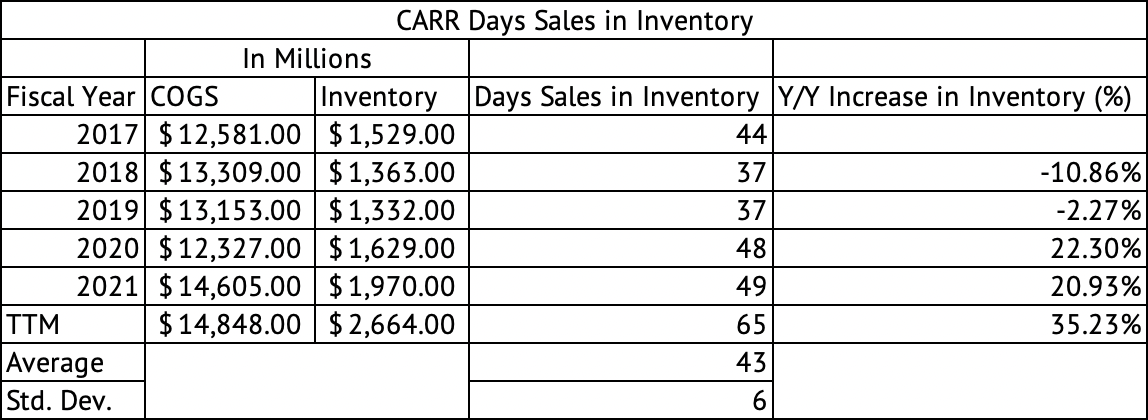
Unattractive dividend
The company has a dividend yield of 1.6%, low compared to the risk-free 2-year US Treasury yield of 4.22%. The company has a conservative dividend payout ratio of 15%. The company paid $488 million in total dividends in the trailing twelve months. The company had a $1.5 billion operating cash flow during the same period. Over the trailing twelve months, the company spent $1.5 billion in share repurchases, which reduced total diluted outstanding shares by 19.9 million to 870.4 million. The company’s dividend yield is too low in this interest rate environment. Dividend income seekers may be better off waiting for a better yield.
The company has a high debt load with total debt of $8.8 billion and a debt-to-EBITDA ratio of 3.2. The company has a manageable $2 billion debt coming due by 2026. The company has good short-term liquidity measured by the current and quick ratios.
Overvalued based on the discounted cash flow model
A discounted cash flow [DCF] model shows that Carrier may be overvalued by 21% (Exhibit 4). The DCF model assumes a short-term and long-term growth rate of 5% and a free cash flow [operating cash flow – capex] margin of 9%. The DCF model yields an equity value of $37 compared to the current $45.87.
Exhibit 4:
Carrier Discounted Cash Flow Model (Seeking Alpha, Author Calculations)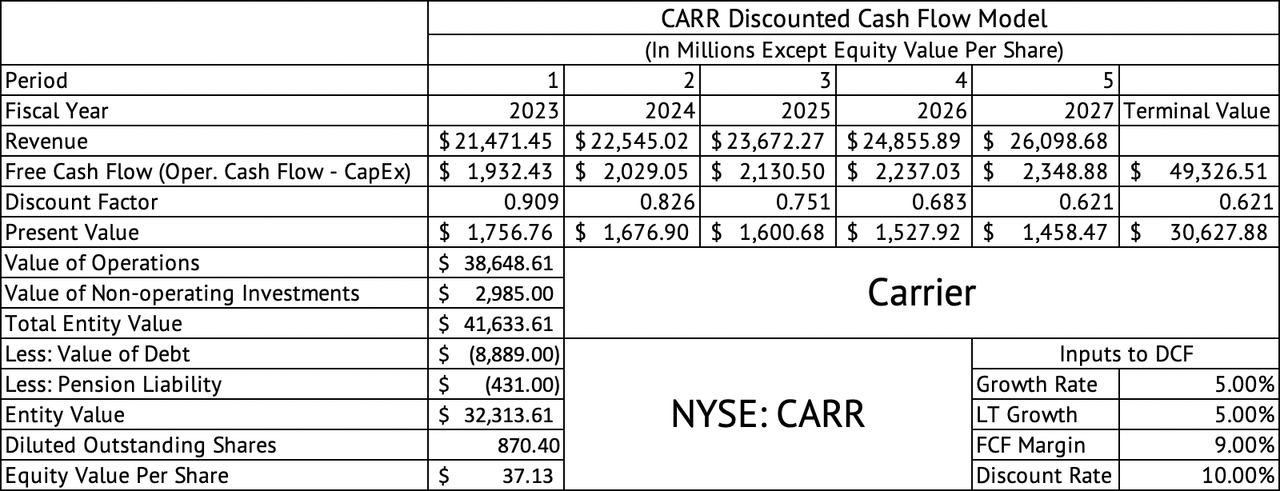
For the upcoming quarter, fourteen analysts have revised earnings down, while four have revised up. A similar number of analysts have revised revenue estimates down. The company is trading at a trailing and forward GAAP PE of 11x. The company looks reasonably valued based on the PE ratio, but the EPS and revenue downgrades cause concern.
Price momentum
The stock had good price momentum over the past three months returning 29%. The company has produced a negative 12% over the past year compared to a negative 14% for the S&P 500. The company’s current rally looks stretched, with the MFI and RSI technical indicators approaching overbought levels (Exhibit 5). The markets have had a solid start to 2023, with the S&P 500 Index rising by 4.5% in the year’s first two weeks. This market rally may be short-lived if the job market stays strong, inflation continues to be a challenge, and rates continue rising. Carrier has a much higher volatility than the market, with a beta of 1.16. Given this beta, the stock is expected to change by 1.16% on average for every 1% change in the monthly return of the S&P 500 Index. The stock will amplify the upside and downside movements of the market.
Exhibit 5:
Carrier Global RSI & MFI Technical Indicators (Seeking Alpha)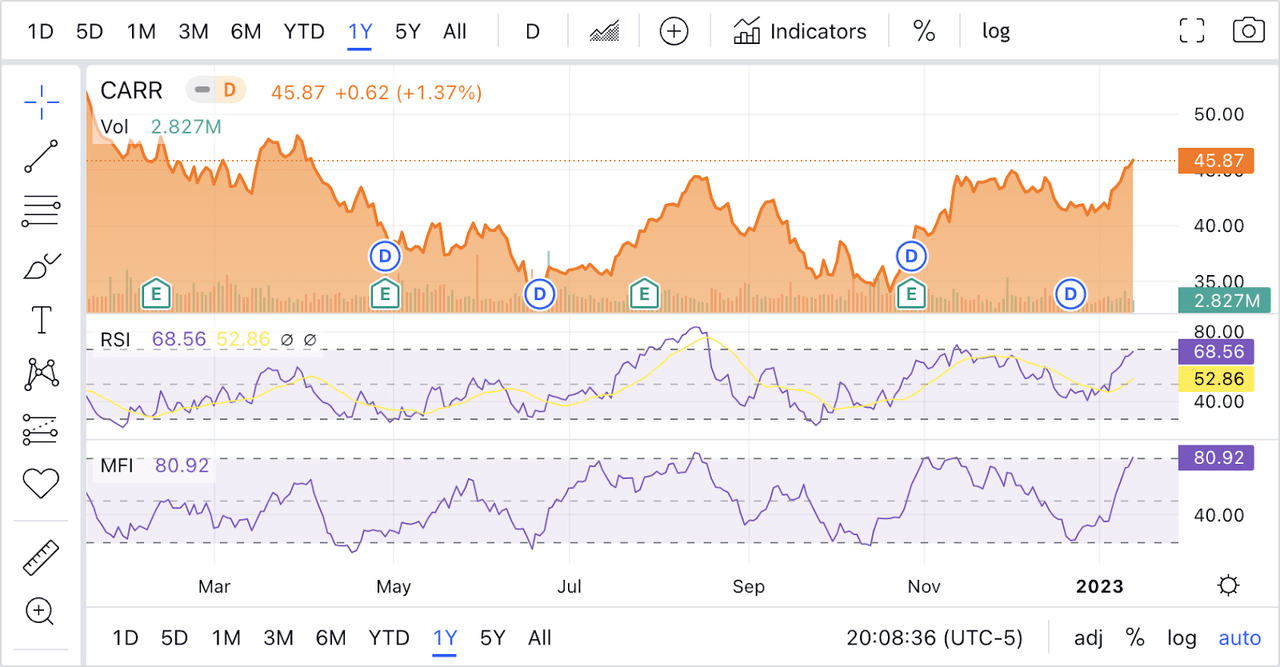
Carrier Global is an excellent long-term stock if bought at a reasonable valuation. The company is facing margin pressure and is carrying high inventory. The elevated inventory levels may pressure margins in the coming quarters. The company needs to offer a better dividend yield for income seekers. The high-interest rates are beginning to put a damper on demand. The stock has shown impressive positive momentum in the past three months and looks overbought. It is best to wait for a pullback in Carrier Global.
Be the first to comment