

Wolterk
Most investors probably overlook this little real estate investment trust (“REIT”). So, I don’t blame you if you never heard of it. The analyst coverage on the stock is minimal. However, the 4 analysts who do cover the stock have a “Strong Buy” rating on the Canadian REIT.
Seeking Alpha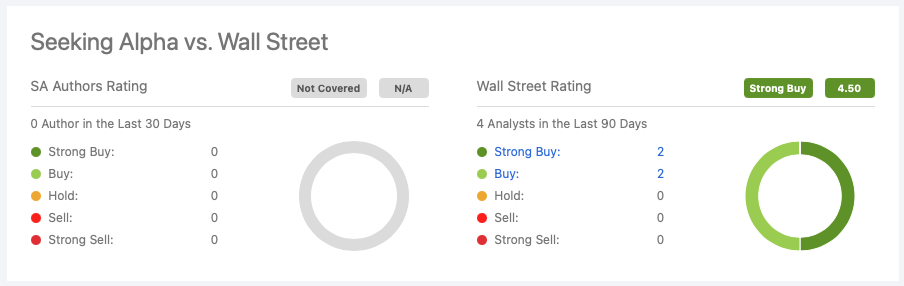
Investors should pay attention indeed, as the little REIT has been growing its funds from operations (“FFO”) per unit at an above-average rate for years. Additionally, it also pays out a decent cash distribution yield even in today’s high inflation and rising interest rate environment.
Canadian Net Real Estate Investment Trust (TSXV:NET.UN:CA) trades on the TSX Venture Exchange, so even Canadian investors may not know about it. Some investors might recall its previous name of Fronsac REIT, which it changed to the present name in June 2021 to better reflect what it actually does.
[Canadian Net REIT reports in Canadian dollars, so the figures below are also in C$ unless otherwise noted.]
What Canadian Net REIT does
Canadian Net REIT is an internally-managed open-ended REIT that acquires and owns high quality triple net and management-free commercial real estate properties.
This type of lease setup implies that tenants take up costs like property insurance, property taxes, and property maintenance. Ultimately, it means that the REIT is able to generate high quality cash flow that’s relatively stable and predictable.
It targets properties that are credit-rated national tenants and well-located with high traffic. Some of its properties with exceptional locations are even leased to AAA tenants. They fall into four groups: retailers, national service-station and convenience store chains, quick-service restaurant chains, and others.
Corporate Fact Sheet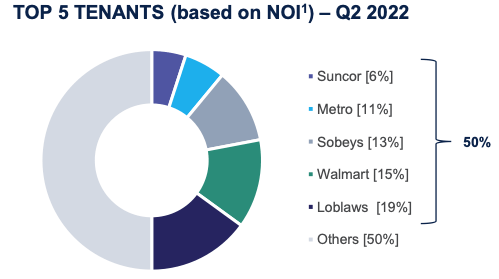
Its top tenants include Loblaw (OTCPK:LBLCF)(L:CA), Walmart (WMT), Sobeys (whose parent company is Empire (OTCPK:EMLAF)(EMP.A:CA)), Metro (OTCPK:MTRAF)(MRU:CA), and Suncor (SU)(SU:CA) that together contributed about 50% of net operating income (“NOI”) for the most recent quarter.
Canadian Net REIT’s growth drivers include acquisitions and developments. The REIT is just the right size to close deals that are “under the radar of large REITs and institutions but too large for individual investors,” as highlighted in its Q2 2022 Investor Fact Sheet.
For example, in 2021, it completed 17 acquisitions, including eight joint ventures. As of the end of Q2, its portfolio has grown to 101 properties in Eastern Canada with a high occupancy of approximately 99%.
By gross leasable area, its portfolio is 60% in Quebec, 27% in Ontario, and 13% in Nova Scotia. It has built-in lease escalations and an average remaining lease term of just over 7 years, which supports the generation of stable and predictable cash flow.
Track Record of Growth
Canadian Net REIT is proudly a Canadian Dividend Aristocrat that has paid a growing cash distribution since 2012. Its 10-year cash distribution growth rate is 10.5%, which is an above-average and healthy increase, as it raised its FFO per unit at a higher rate in the period. Its 2021 FFO payout ratio was absolutely sustainable at 52%.
Corporate Fact Sheet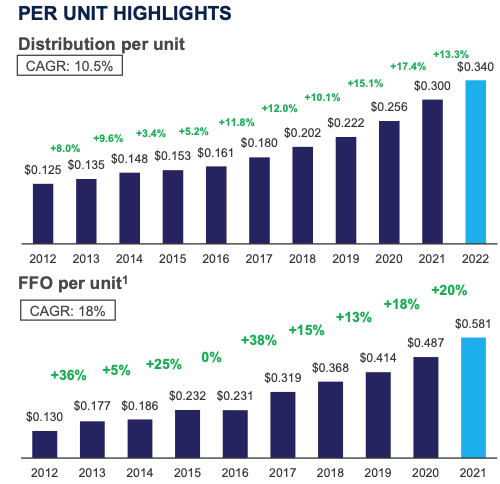
Recent Results
Here are some highlights from Canadian Net REIT’s summarized financial results in the first half of the year. Notably, it has grown its portfolio meaningfully year over year, resulting in:
- Property rental income growth of 24% to C$11.31 million,
- NOI growth of 30% to C$8.72 million, and
- Adjusted EBITDA growth of C$8.75 million.
Its investment property portfolio also grew 36% to C$284.9 million. As well, it increased its FFO per unit by 8% to C$0.311, which represents an FFO payout ratio of 55%.
Its weighted average interest rate increased by 11 basis points to 3.52%, but its debt is still manageable with an interest coverage ratio of 3.0x and debt service coverage ratio of 1.7x.
Corporate Fact Sheet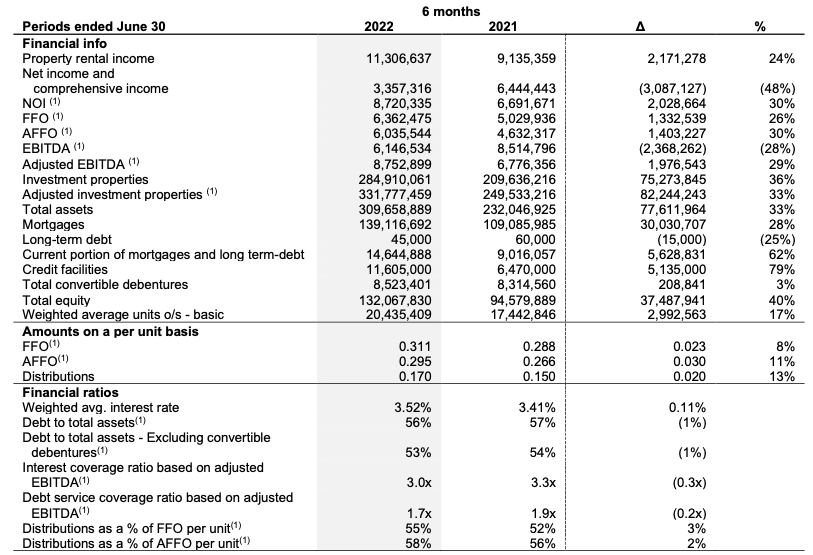
Cheap Valuation & Conclusion
Rising interest rates haven’t been kind to REITs, as they generally increase their borrowing costs because of the mortgage-heavy balance sheets.
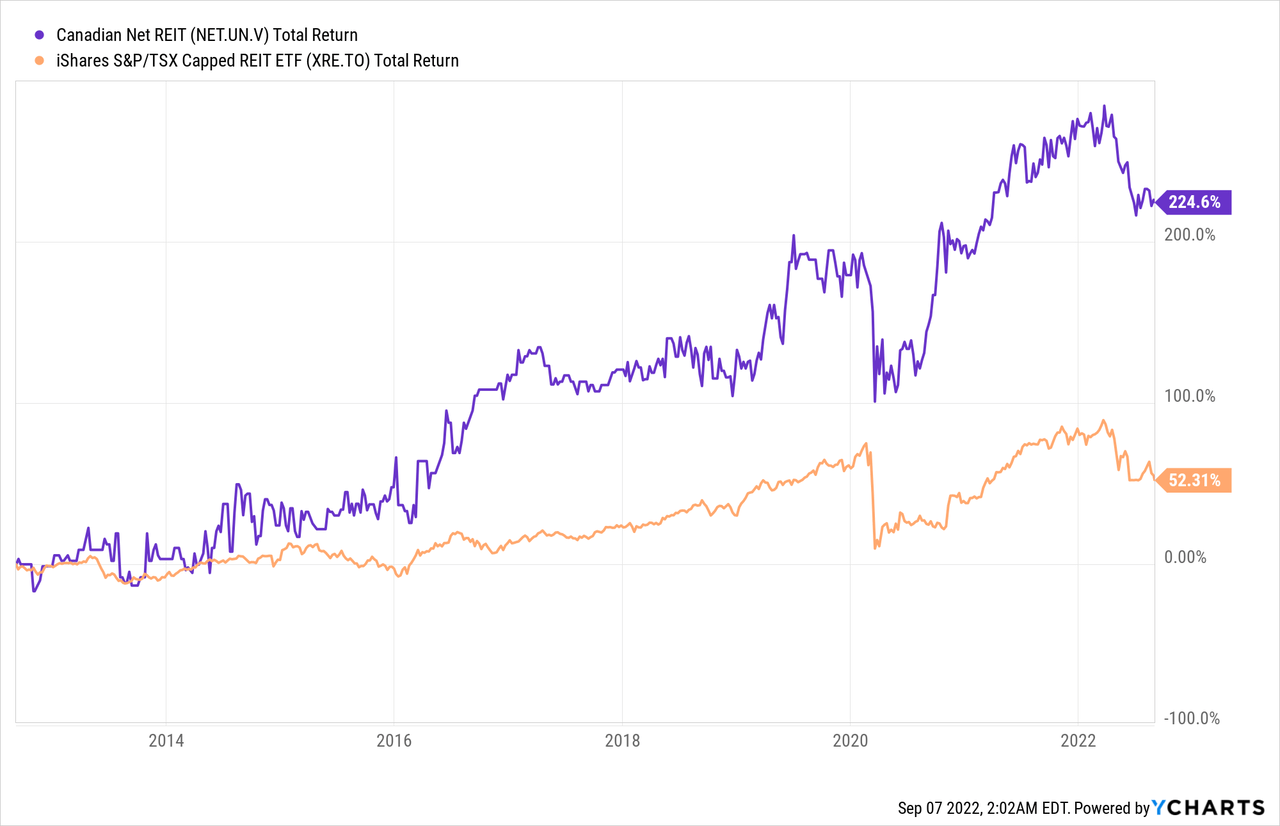
Canadian Net REIT’s total return is about -12% year-to-date but has outperformed the industry, using iShares S&P/TSX Capped REIT Index ETF (XRE:CA) as a proxy, by almost 6%.
In the last one, three, five and 10 years, the hidden gem has also outperformed. This is not surprising because we already knew that it provided above-average growth.
We believe now is an attractive entry point in the little REIT as it trades at a low multiple to its long-term normal valuation. It’s 10-year normal P/FFO is about 17. Assuming a fair P/FFO of 15, the stock is still discounted meaningfully by about 25%. It also offers a yield that’s approaching 5.0%.
F.A.S.T. Graphs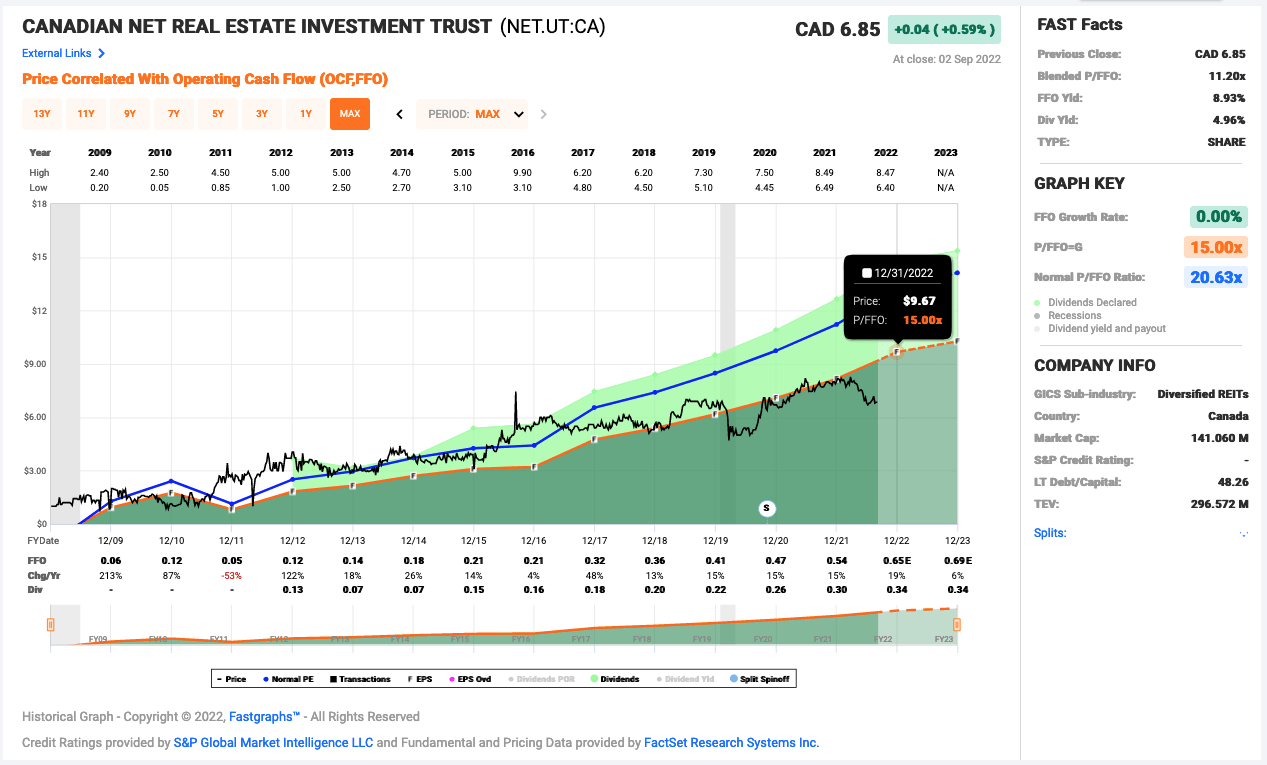
The REIT’s average trading volume is 6,785, which might too low for investors’ liking. After all, one favorable trait of common stocks is their liquidity, and this little stock is not liquid at all.
Related to its low volume is its small market cap of approximately C$142 million and enterprise value of close to C$300 million that may be too small to come up on many investors’ radar. So, it’s likely to remain a hidden gem.
Be the first to comment