

Canadian Dollar, USD/CAD Talking Points:
- USD/CAD put in a big breakout last week on the heels of Canadian inflation data and FOMC meeting minutes from the July rate decision.
- The breakout ran all the way to 1.2950, after which a reversal began to show in the short-term trend. Now, three trading days and almost 400 pips later, USD/CAD is in a precarious spot on the chart.
- The analysis contained in article relies on price action and chart formations. To learn more about price action or chart patterns, check out our DailyFX Education section.
It’s been a busy past week in USD/CAD.
Last Tuesday I had warned of a potential breakout in the pair as USD/CAD had moved up to a key spot of resistance with two really big drivers on the horizon for the following Wednesday. Canadian inflation was due that morning, and FOMC meeting minutes were scheduled for release later that day. The one-two punch of those releases not only brought a breakout beyond the 1.2621-1.2652 zone that I had talked about; but also a breakout beyond the six-month-high of 1.2800 as bulls
Prices in USD/CAD ran all the way up to the 1.2950 level, just shy of the 1.3000 psychological level to set a fresh nine-month-high in the pair. But that’s when the proverbial music stopped, as a reversal began on Friday that has continued to evaporate those breakout gains through this week’s open.
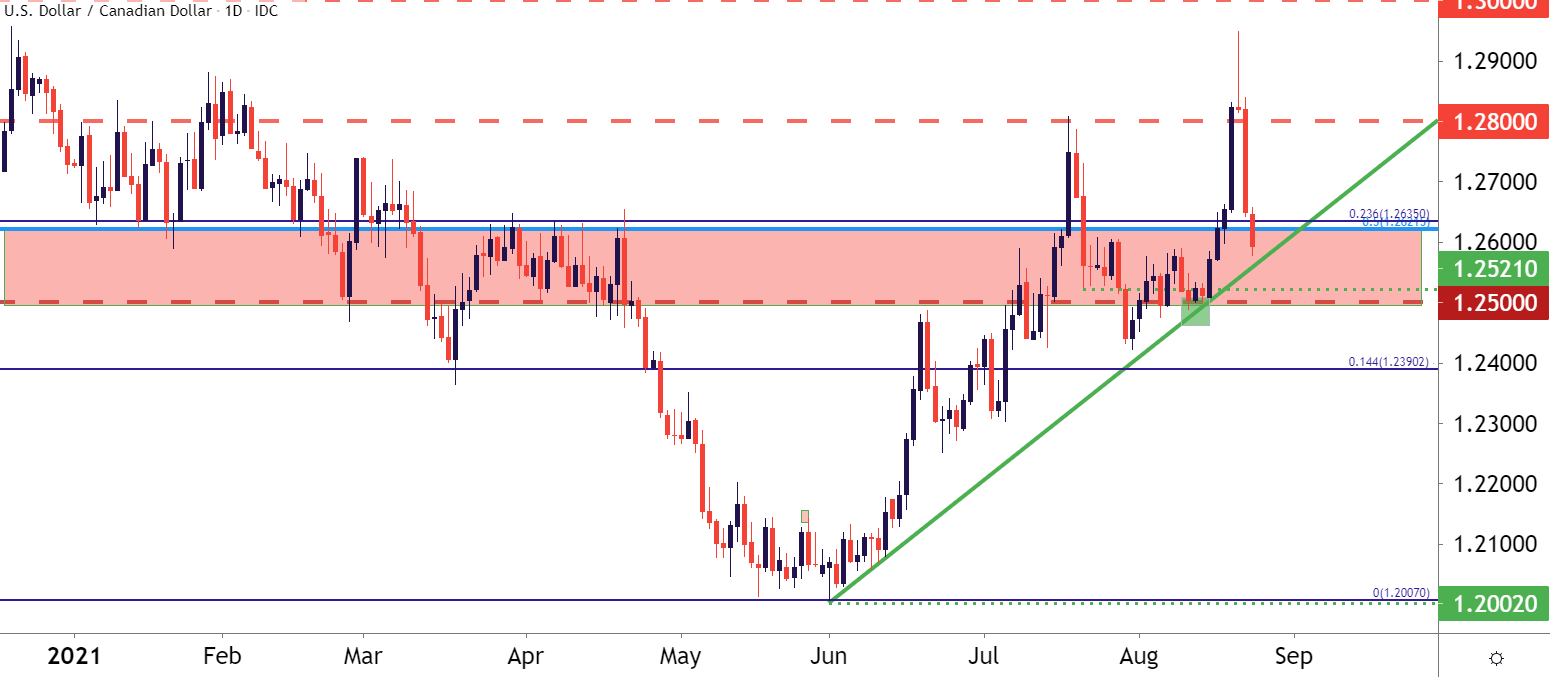
This backdrop is accented with some interesting observations on the chart. That Friday candle where sellers came rushing into the market ended as a gravestone doji, and the bearish follow through on Monday completed an evening star formation, often followed with the aim of bearish continuation. So far during Tuesday trade that theme has continued, with prices pushing back down to the bullish trendline that’s held the lows in the pair since early-June.
To learn more about the gravestone doji or the evening star formation, check out DailyFX Education
USD/CAD Daily Price Chart
Chart prepared by James Stanley; USDCAD on Tradingview
USD/CAD Macro Factors
There are a couple of key macro factors at play in USD/CAD at the moment, with the most obvious of those being performance in the US Dollar. The USD rushed higher last week after those FOMC minutes indicated that the Fed may be closer to tapering than initially thought, and that’s what helped both USD and USD/CAD to jump up to those fresh near-term-highs.
But, that theme has been coming off lately as the USD has sunk to support and USD/CAD following along, but there’s another factor of importance in USD/CAD and that’s oil prices. Oil was in a heavy sell-off last week, helping the Canadian Dollar to further weaken. But, with oil prices coming back to life this week, so has CAD strength and when combined with a weak USD, that’s made for a strong short-term trend in USD/CAD.
At this point, USD/CAD is nearing a big spot of support on the chart, taken from the trendline projection that’s so far guided the lows in the pair since June. There’s also a bit of support playing out at prior short-term resistance, taken from a swing at around 1.2588. This can keep the door open for bullish scenarios in the pair with a focus on the upcoming Jackson Hole Economic Symposium. Below the trendline projection is secondary support potential in the 1.2500-1.2521 zone.
USD/CAD Four-Hour Price Chart
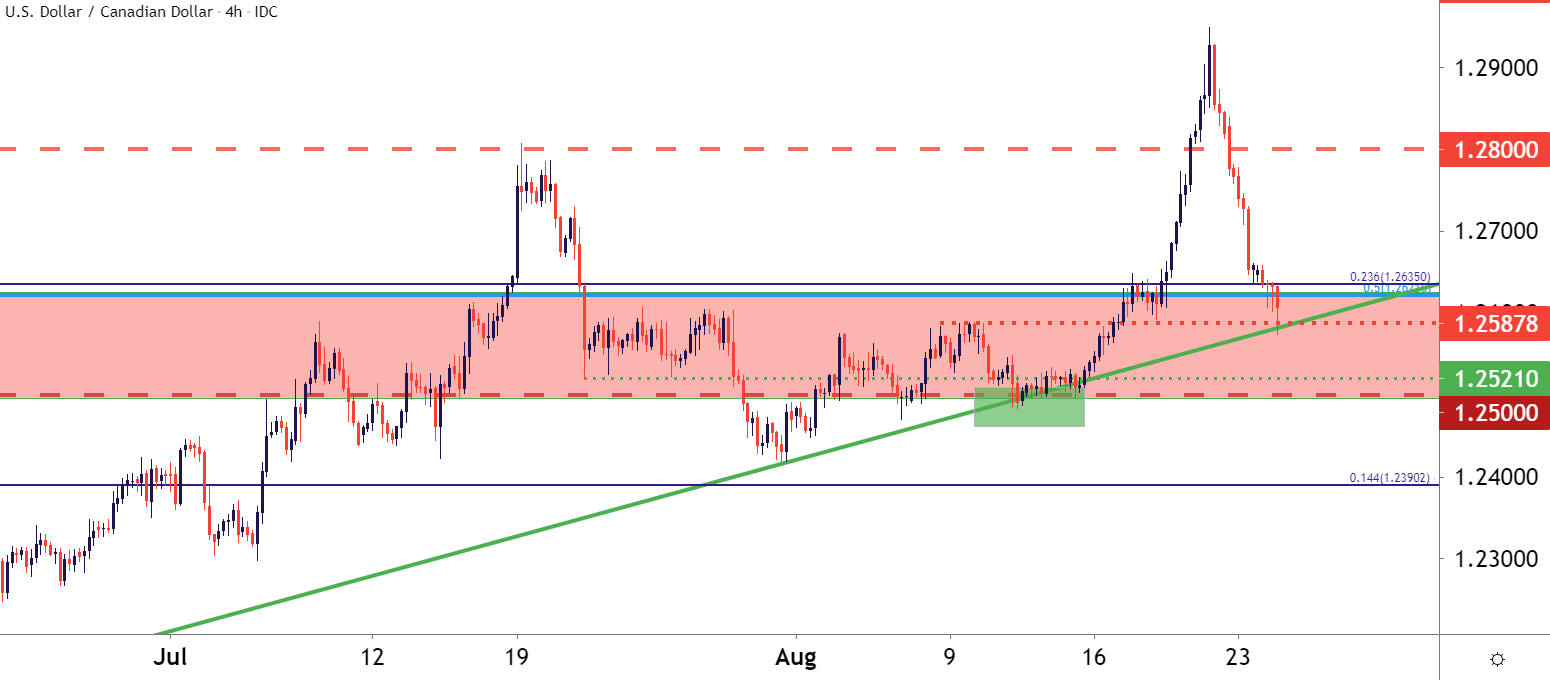
Chart prepared by James Stanley; USDCAD on Tradingview
— Written by James Stanley, Senior Strategist for DailyFX.com
Contact and follow James on Twitter: @JStanleyFX
Be the first to comment