

imaginima/E+ via Getty Images
A guest post by Ovi
The EIA has reported that their site experienced technical problems last week and that they have not been able to update their weekly and monthly data. Since we do not know when they will publish the April U.S. oil production report, this short different post will fill the gap.
The answer to the above question is clearly No. However that does not prohibit one from doing some exploratory analysis.
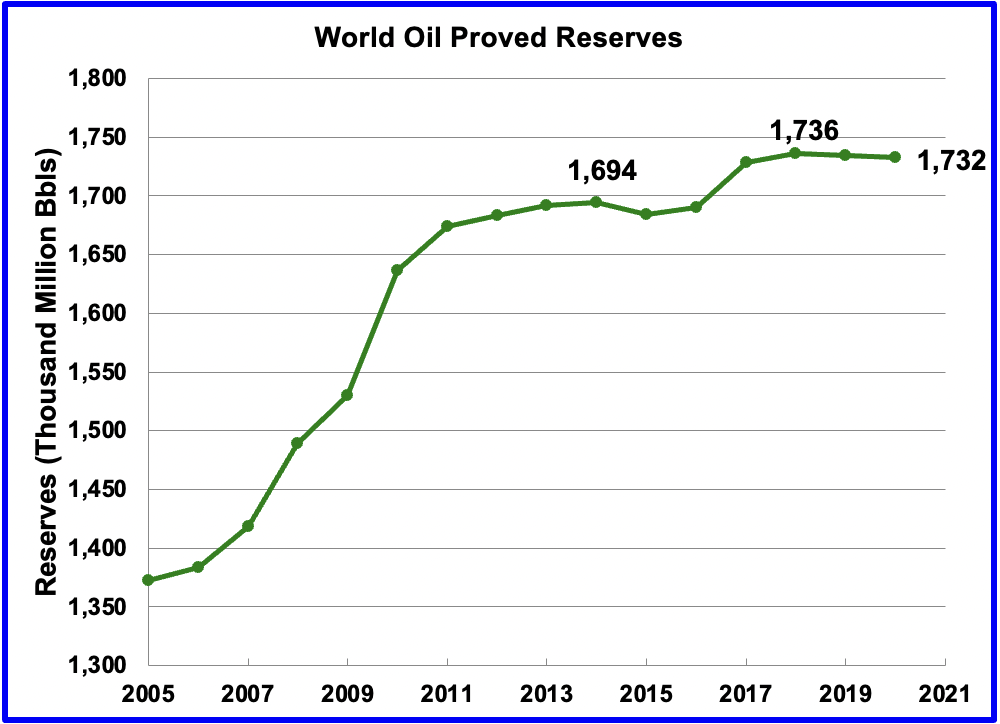
Recently BP (BP) issued their annual Statistical Review. While most of it was updated to 2021, the world oil reserves were not and the same 2020 reserves were reported again. The following note was provided to explain why the reserves were not updated: “Please note that due to process improvements for the Statistical Review these reserves tables have not been updated this year.”
Looking at the last two years of the BP reserves data, one can see the reserves have not increased and could possibly be in decline.
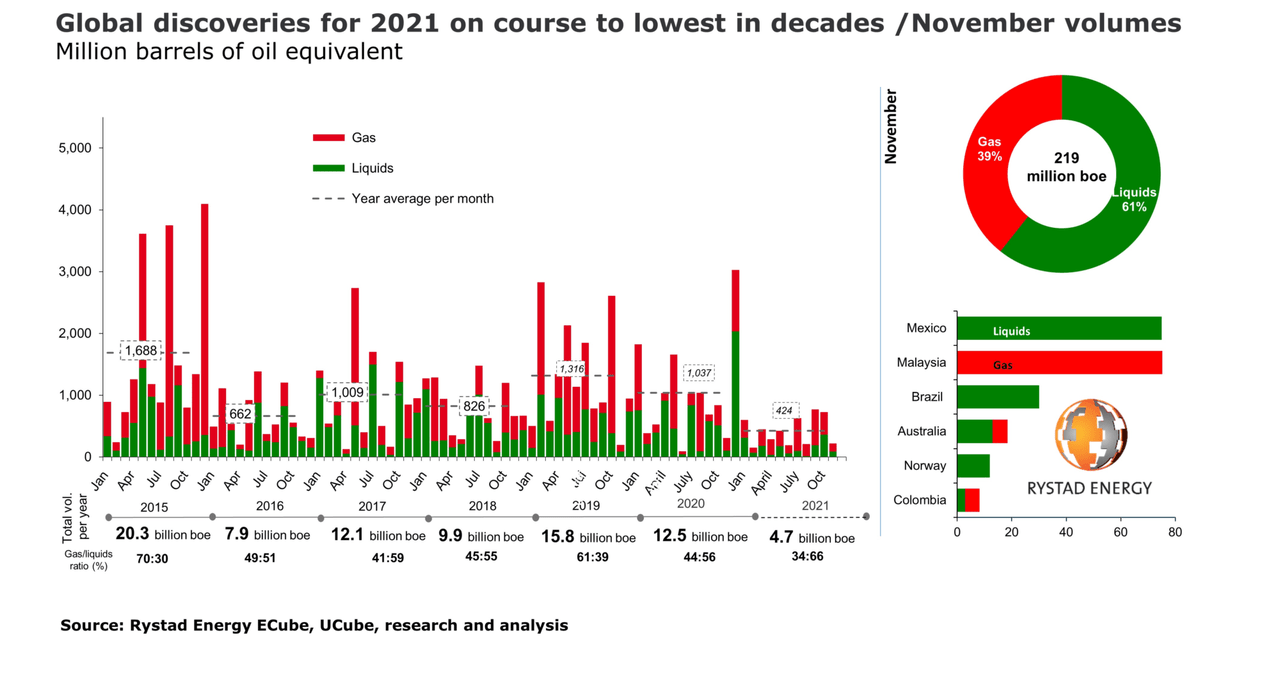
In late 2021, Rystad released the oil discoveries for 2021. Only 3.1 B barrels of liquids were discovered up to the third week of December 2021. While oil reserves in some countries were updated during the year, Rystad has revised their estimates and published a report indicating that reserves are nine percent lower than previously thought. This could also explain why BP did not update the reserves in their report.
This led to the thought that generated this post, “Can we use past production to explore future production since the likelihood of a major new field being found is low?”
Below are charts that use the logistic function to model past production to estimate future scenarios.
The logistic function for cumulative production is given by:
Q(t) = Q0 / (1 + exp(-a(t – Tp))) (1)
Where:
Q(t) = Cumulative production to the year t
Q0 = URR or ultimate recoverable reserves
a = constant affecting the height to width ratio of the logistic function
t = calendar year
Tp= peak year, production peak for each individual logistic function
exp = the exponential function
The annual production rate P is the differential of (1) and is given by
P = dQ(t)/dt = a*Q0* exp(-a(t – Tp) / (1 + exp(-a(t – Tp)))^2
Two sets of data were used to model future production.
OPEC recently published their updated yearly World Crude production for the years 1960 to 2021. Only data up to 2019 was used since 2020 and 2021 are atypical.
The EIA yearly crude plus condensate world production for the years 1960 to 2019 was used for the second analysis.
Each of the data sets was modeled using two and three logistic functions to assess how the production outlook changed as the third logistic function was added.
OPEC Crude World Production Data
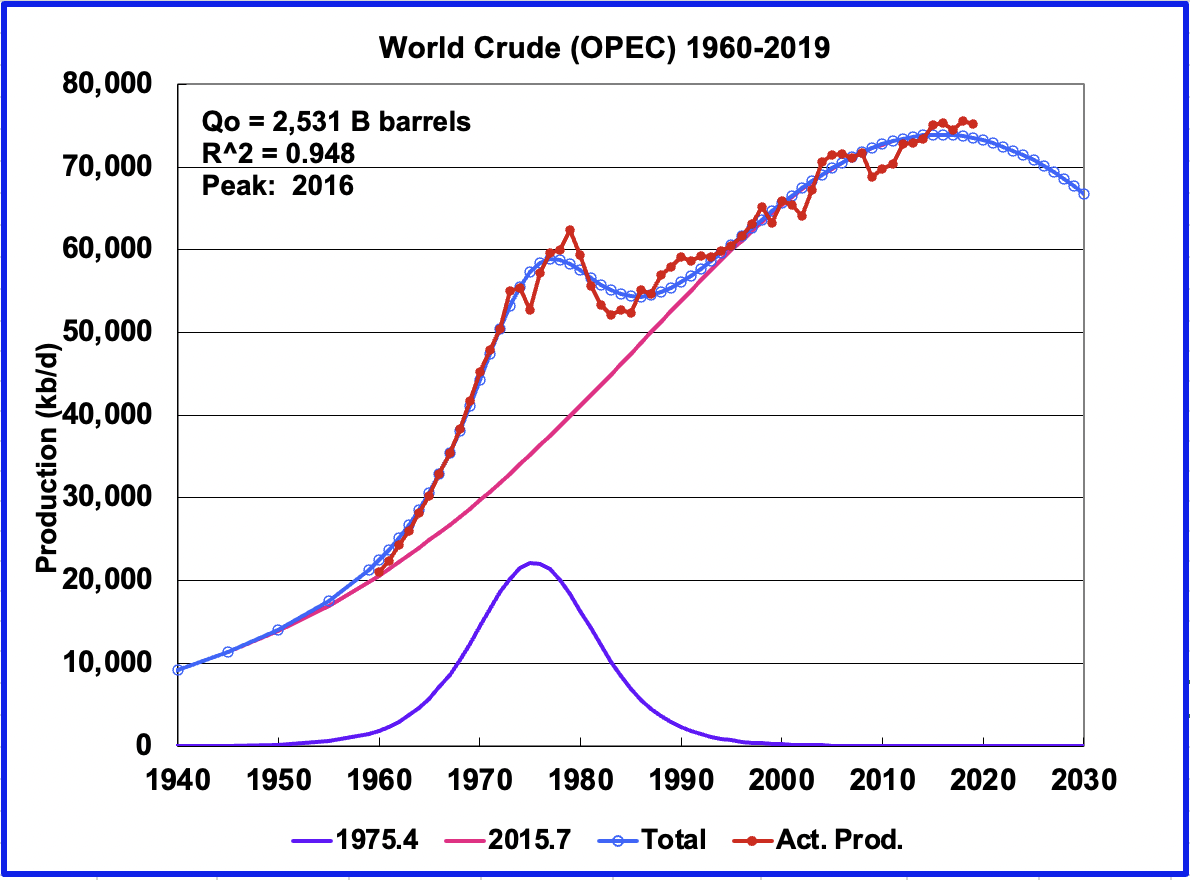
This is the OPEC crude data modelled using two logistic functions. The smaller one has a 1975 peak while the main one peaks in 2015. The overall peak is in the rear view mirror, 2016.
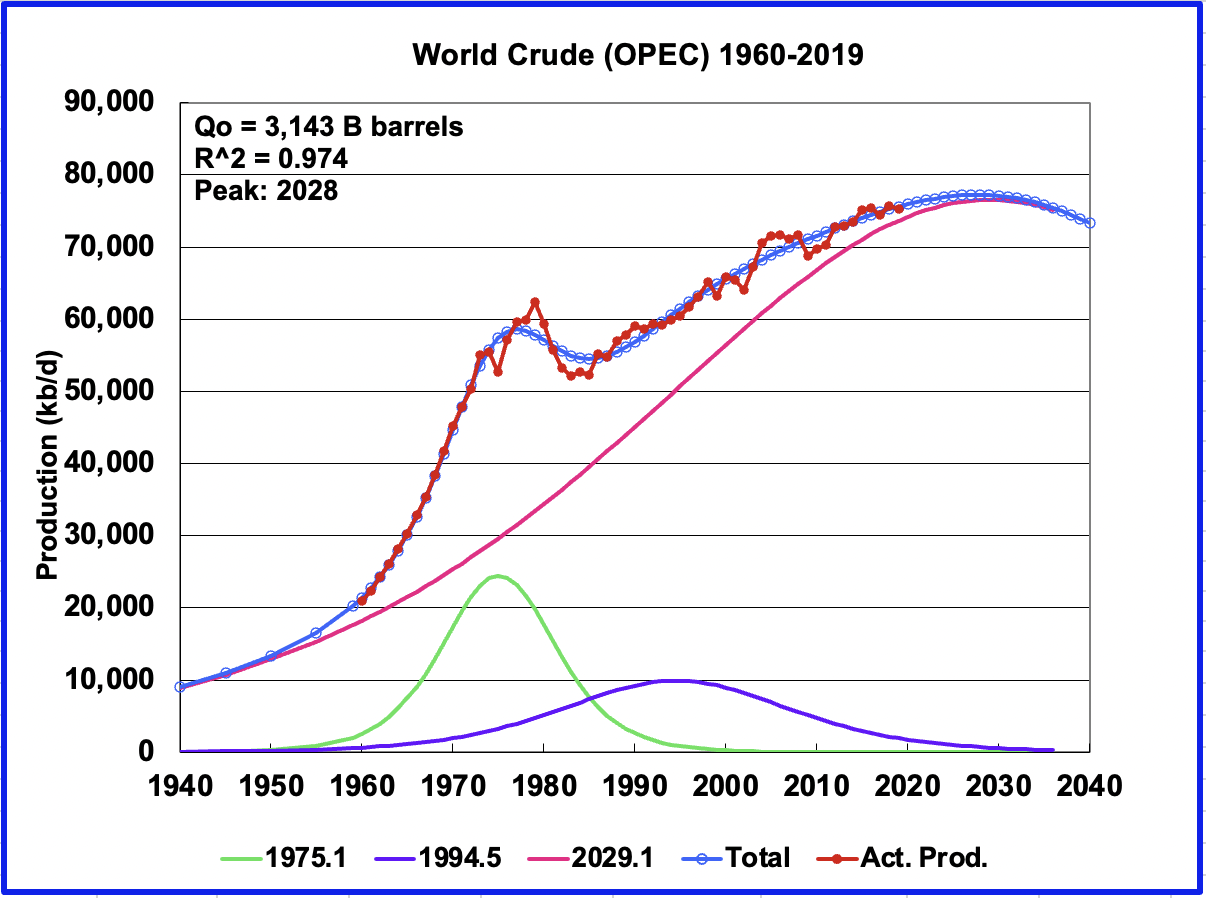
To improve the model over the years 1980 to 2000, a third logistic was added. This model forecasts the World could potentially add an additional 2,000 kb/d over the 2019 production of 75,243 kb/d. Peak production of Crude is projected to be 77,214 kb/d in 2028.
EIA Crude plus Condensate Production
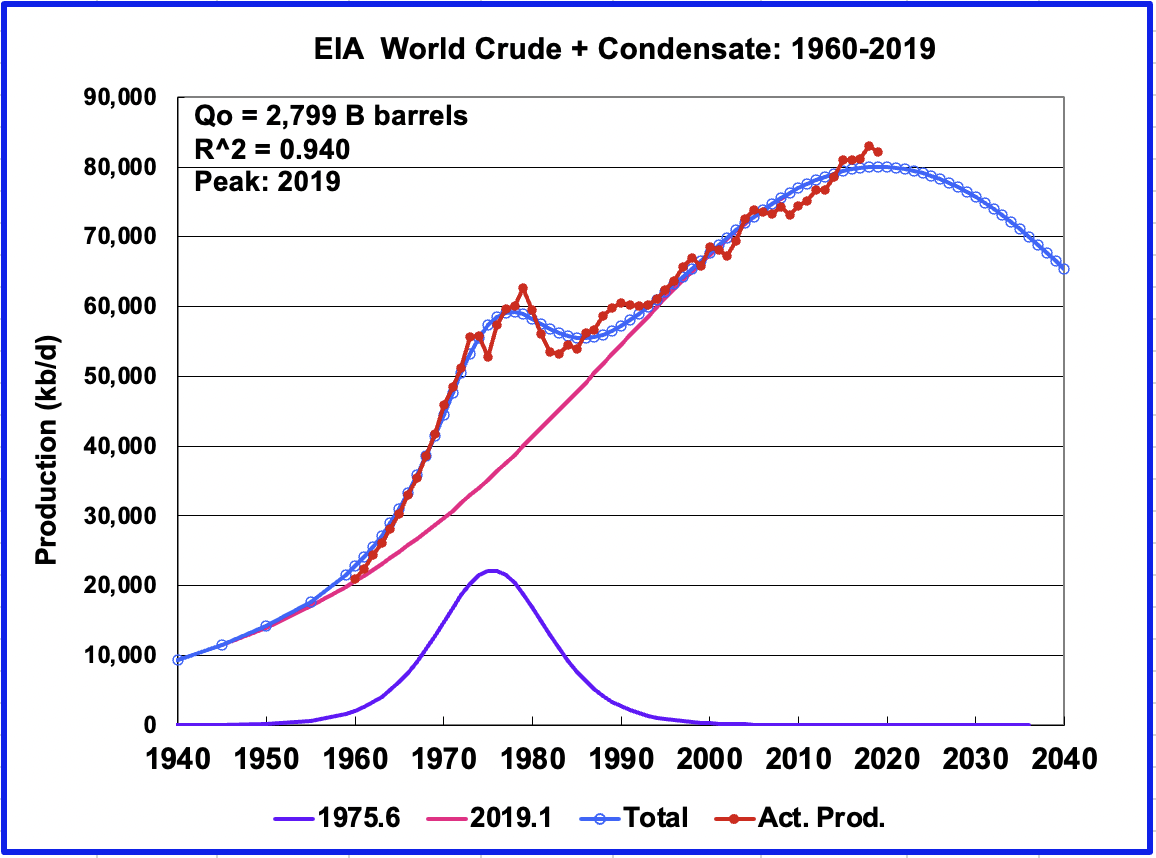
This is the EIA Crude plus Condensate data modelled using two logistic functions. The smaller one has a 1975 peak while the main one has a 2019 peak. Again the overall peak is in the rear view mirror, 2019.
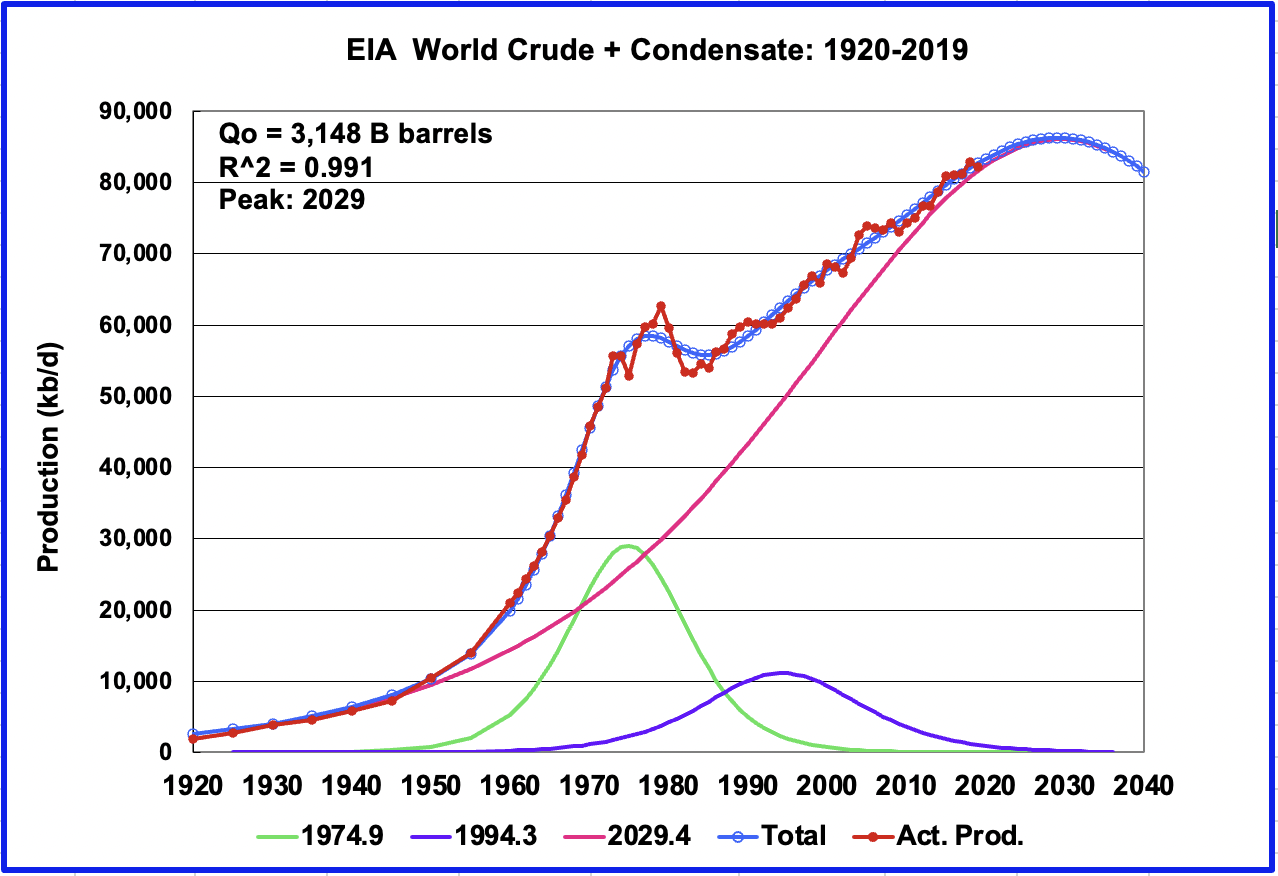
Adding a third logistic to the EIA data has the same effect to production as occurred with the OPEC data. Also the data range was expanded from 1920 to 2019. While actual production peaked in 2018 at an average rate of 82,952 kb/d, the model forecasts that peak production will occur in 2029 at 86,056 kb/d, an additional 3,100 kb/d over the 2018 rate.
My thoughts on this analysis are two fold. I think the peak is in the past as indicated by the two function charts. I also think the three model charts are correct in saying that modestly higher production could be coming over the next few years and that the second peak oil is close.
Rigs and Fracs
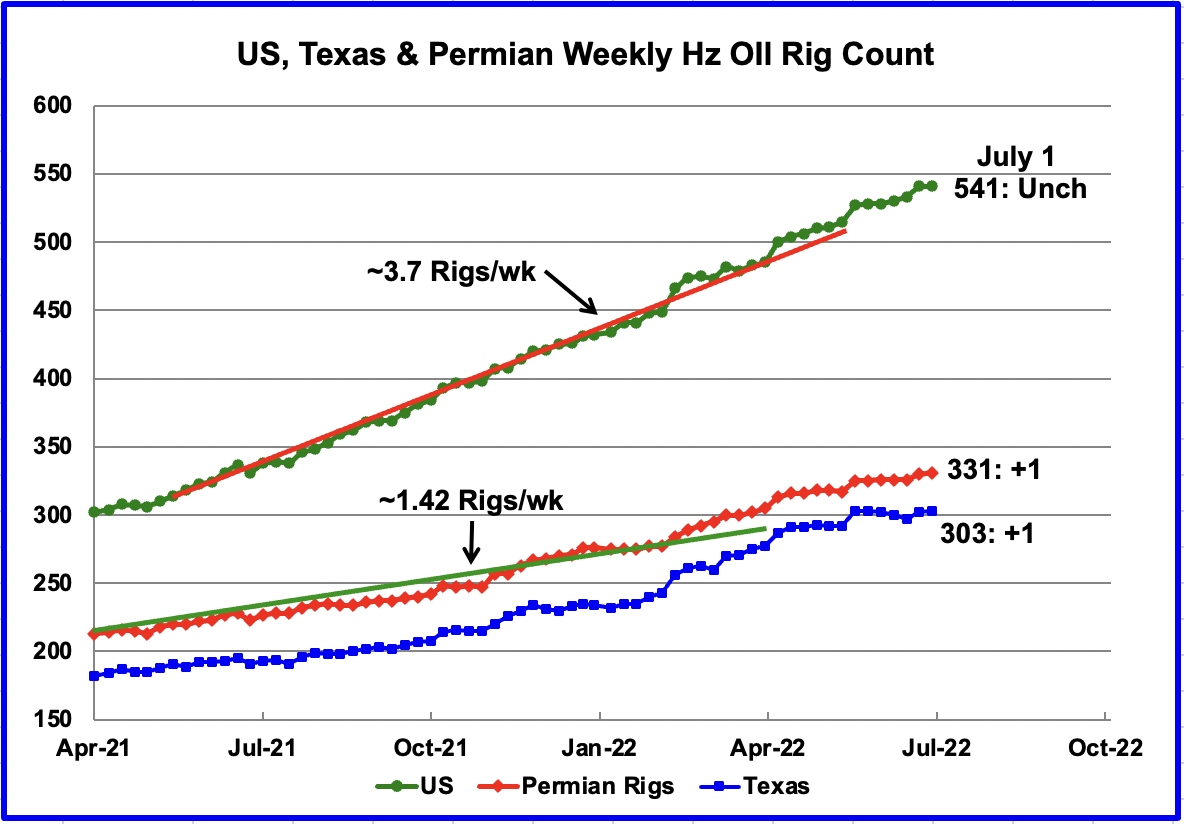
For the week ending July 1, 2022, the number of horizontal oil rigs was unchanged at 541. One was added in the Permian and one in Texas.

The New Mexico Permian added 1 Horizontal rig in the week ending July 1.
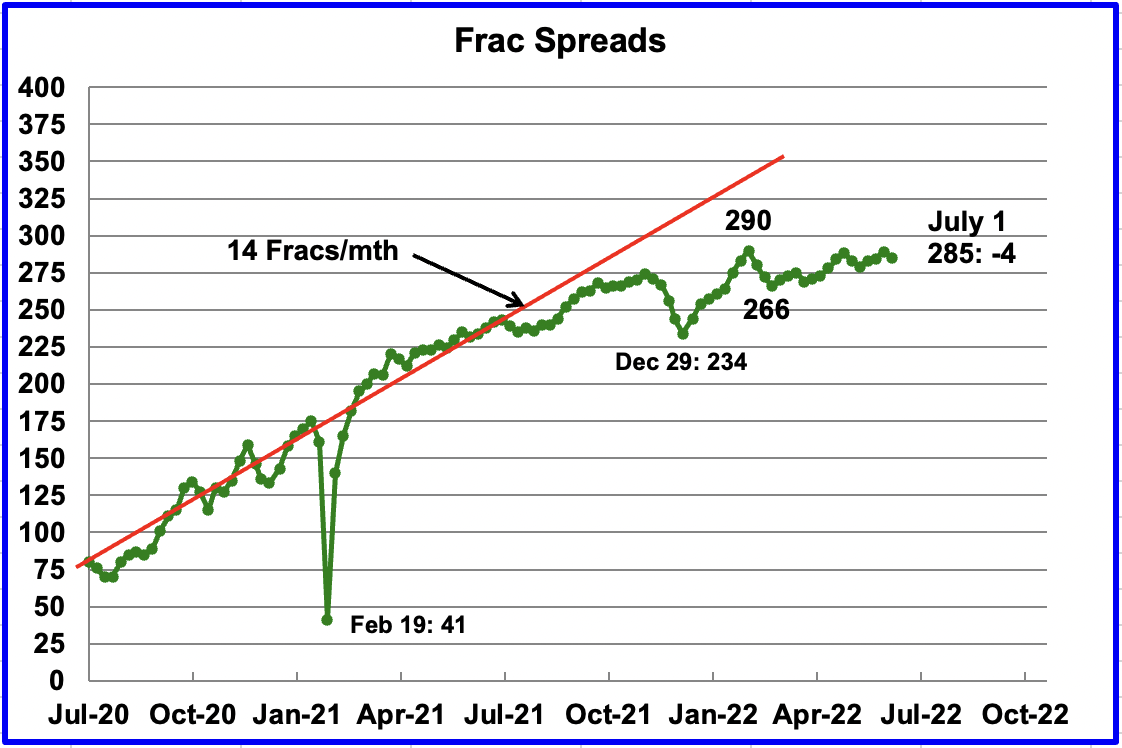
Frac spreads dropped by 4 in the week ending July 1. Frac spreads typically drop on long holiday weekends.
An article in Reuters reports that “U.S. shale oil producers are returning to existing wells and giving them a second, high-pressure blast to lift output for a fraction of the cost of finishing a new well.”
“Re-fracing can be something of a booster shot for producers – a quick increase in output for smaller investment than a new well. While some producers have dabbled in re-fracturing wells in the past, the technique is winning broader adoption as technology improves, aging oilfields erode output, and companies try to do more with less.”
“Shortages of steel, diesel, frac sand and workers have doubled oilfield inflation since January, making this discount method of boosting output even more attractive.”
“A re-frac can be up to 40% cheaper than a new well, according to experts. More importantly, it can double or triple oil flows from aging wells, said Garrett Fowler, Chief Operating Officer for ResFrac, which helps producers optimize the technique.”
I wonder if this accounts for the STEO’s optimistic increase in US production, reported in the previous post, for the upcoming year.
How big an issue is this for the drillers of new wells. Will this result in more frac spreads being assembled or will their assembly be limited by personnel and equipment? Also this could result in an increase in the DUCs’ inventory as opposed to the current decline.
Editor’s Note: The summary bullets for this article were chosen by Seeking Alpha editors.
Be the first to comment