

Sundry Photography
Cadence Design Systems, Inc (NASDAQ:CDNS) is an application software company that specializes in EDA software, used in the high-demand semiconductor industry. We analyzed the company’s growth based on its segment breakdown. We then examined its R&D capabilities against competitors based on the number of patents. Lastly, we analyzed the sustainability of its profitability moving forward.
Company Data, Khaveen Investments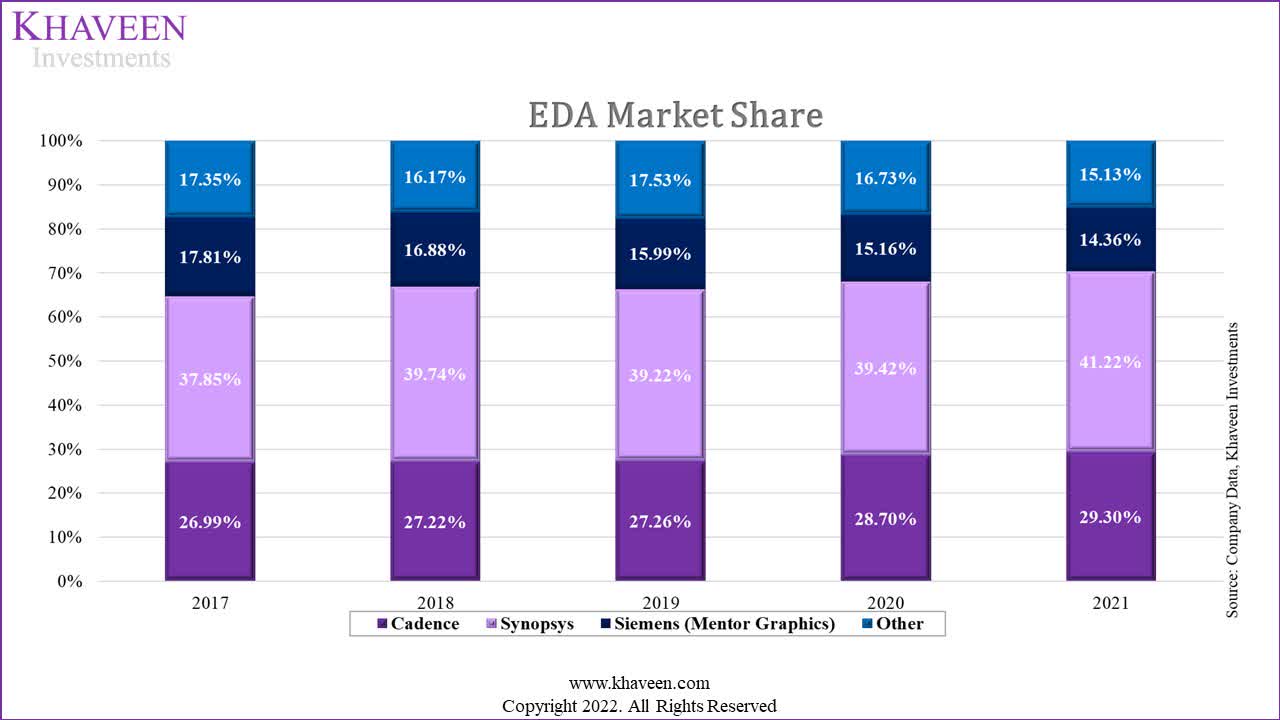
Generally, the cost of development for software applications is relatively low for companies (around $125,000), which results in low barriers to entry within the market and highly competitive rivalry. However, the EDA market is concentrated with just 3 companies accounting for the majority of the market share: Cadence, Synopsys (SNPS) and Siemens (OTCPK:SIEGY). According to SemiWiki data, Cadence had almost a quarter of the market share since 1993 but was outpaced by faster-growing competitors such as Synopsys which overtook its lead as the market leader but cemented its positioning in second place behind Synopsys.
Growth Driven by IP and System Design Segments
The EDA market consists of chip design and verification solutions and has expanded over the years with solutions such as PCB and Semiconductor Intellectual Property (SIP). Based on the company’s annual report, the company has segmented its revenues into 5 main segments. We analyzed the company’s segment revenue breakdown and identified its product application based on its annual report in the table below to determine which segments were its key growth drivers.
|
Cadence Revenue Breakdown by Segment ($ mln) |
2015 |
2016 |
2017 |
2018 |
2019 |
2020 |
2021 |
Average |
|
Custom IC Design and Simulation (Analog & Memory) |
442.55 |
454.03 |
524.61 |
555.88 |
584.08 |
670.73 |
687.29 |
|
|
Growth % |
3.68% |
2.59% |
15.55% |
5.96% |
5.07% |
14.84% |
2.47% |
8.08% |
|
Digital IC Design and Signoff (Logic) |
476.59 |
526.67 |
563.47 |
620.02 |
700.89 |
778.04 |
866.58 |
|
|
Growth % |
3.95% |
10.51% |
6.99% |
10.04% |
13.04% |
11.01% |
11.38% |
8.31% |
|
Functional Verification, including Emulation and Prototyping Hardware (FPGA) |
391.48 |
454.03 |
427.46 |
491.74 |
560.71 |
590.24 |
657.40 |
|
|
Growth % |
12.56% |
15.98% |
-5.85% |
15.04% |
14.03% |
5.27% |
11.38% |
7.70% |
|
IP (Analog & Memory) |
204.25 |
199.77 |
233.16 |
256.56 |
303.72 |
375.61 |
418.35 |
|
|
Growth % |
17.45% |
-2.19% |
16.71% |
10.04% |
18.38% |
23.67% |
11.38% |
18.81% |
|
System Design and Analysis (PCB & Advanced Packaging) |
187.23 |
181.61 |
194.30 |
192.42 |
210.27 |
268.29 |
298.82 |
|
|
Growth % |
7.67% |
-3.00% |
6.99% |
-0.97% |
9.28% |
27.59% |
11.38% |
11.31% |
|
Total |
1,702 |
1,816 |
1,943 |
2,117 |
2,360 |
2,683 |
2,928 |
|
|
Growth % |
7.67% |
6.70% |
6.99% |
8.94% |
11.48% |
13.70% |
9.15% |
9.22% |
Source: Cadence, Khaveen Investments
Based on the table, among the company’s 5 segments, its IP segment had been its fastest-growing segment with the highest average growth rate of 18.81%. Though, the segment only accounted for 11% of its total revenues.
According to its annual report, its IP segment offers…
pre-verified, customizable functional blocks, which customers integrate into their ICs to accelerate the development process and to reduce the risk of errors in the design process.
Moreover, the company announced its partnership with TSMC (TSM), the largest foundry with a market share of 53.6% in Q1 2022, to incorporate the company’s design IP solutions with TSMC’s N5 process for a range of ethernet controller chips. Thus, we expect its design IP segment to continue driving the company’s growth.
Followed by that, its System Design and Analysis segment had the second-highest growth rate at an average of 11.31%. This segment represented only 10% of its total revenues in 2021, the company’s smallest segment. Only 2 segments had higher revenue growth than its total average of 9.22%. Its 3 largest segments had below-average growth rates.
|
Cadence Revenue Breakdown by Segment ($ mln) |
2021 |
2022F |
2023F |
2024F |
2025F |
2026F |
|
Custom IC Design and Simulation (Analog & Memory) |
687.29 |
742.84 |
802.88 |
867.77 |
937.91 |
1013.72 |
|
Growth % |
2.47% |
8.08% |
8.08% |
8.08% |
8.08% |
8.08% |
|
Digital IC Design and Signoff (Logic) |
866.58 |
938.58 |
1016.57 |
1101.03 |
1192.52 |
1291.60 |
|
Growth % |
11.38% |
8.31% |
8.31% |
8.31% |
8.31% |
8.31% |
|
Functional Verification, including Emulation and Prototyping Hardware (FPGA) |
657.40 |
708.05 |
762.60 |
821.36 |
884.63 |
952.79 |
|
Growth % |
11.38% |
7.70% |
7.70% |
7.70% |
7.70% |
7.70% |
|
IP (Analog & Memory) |
418.35 |
497.05 |
590.55 |
701.64 |
833.63 |
990.45 |
|
Growth % |
11.38% |
18.81% |
18.81% |
18.81% |
18.81% |
18.81% |
|
System Design and Analysis (PCB & Advanced Packaging) |
298.82 |
332.60 |
370.21 |
412.06 |
458.64 |
510.50 |
|
Growth % |
11.38% |
11.31% |
11.31% |
11.31% |
11.31% |
11.31% |
|
Total |
2,928 |
3,219 |
3,543 |
3,904 |
4,307 |
4,759 |
|
Growth % |
9.15% |
9.93% |
10.05% |
10.19% |
10.34% |
10.49% |
Source: Cadence, Khaveen Investments
From the table above, we forecasted the company’s revenue growth for its 5 segments based on its historical average 9-year growth for each segment. In total, we expect the company’s revenue growth to have a 5-year forward average of 10.2% through 2026 driven by its IP and System Design and Analysis segments. All in all, Cadence derives revenues from a wide range of EDA solutions from chip design and verification to design IP and PCB & advanced packaging. We believe its strong breadth of products could also be a factor that explains its firm grip on the EDA market. Furthermore, the company has partnerships with key customers such as TSMC, which we believe results in high switching costs with the integrated semicon supply chains and supports the company’s EDA market position.
Focus on R&D with High Spending
Moreover, with the increasing chip intensity with continuous product development in the semicon market, we believe R&D is another key factor for EDA companies’ competitiveness. We compared the company against its competitors below based on their revenue, 5-year CAGR and the number of patent publications.
|
Companies |
Revenue ($ mln) TTM |
Revenue CAGR (5 years) |
Number of Patent Publications (2021) |
R&D as a % of Revenue (5 years) |
|
Cadence |
3,283 |
12.09% |
103 |
39.86% |
|
Synopsys |
4,950 |
13.75% |
284 |
34.49% |
|
Siemens |
1,424 |
10.40% |
1 |
7.49% |
|
Average |
2,843 |
13.32% |
127.33 |
11.28% |
Source: Company Data, Global Data, Khaveen Investments
Based on the table, Cadence is ranked second in 3 metrics (revenues, CAGR and number of patent publications). Cadence’s patent publications had decreased from 238 in 2012 for its total publications compared to 103 in 2021 based on Global Data. In contrast, Synopsys, the market leader, was the highest in these metrics and was ranked first. This is followed by Siemens (Mentor Graphics) with the lowest revenue CAGR and number of patent publications.
Moreover, Cadence has a lower R&D spending as a % of revenue than Synopsys. However, compared to the software industry, Cadence and Synopsys have higher R&D spending as a % of revenue at 39.86% and 34.49% respectively. According to RingStone, the average R&D spending as a % of revenue is 23% for SaaS software companies. Thus, although Cadence has a lower R&D spending as a % of revenue than Synopsys, it is still higher than the software industry average, we believe this highlights the high level of R&D intensity within the EDA market and supports its market position.
Overall, we believe that the company’s R&D capabilities could be a factor in its competitiveness within the EDA market. This is as its higher R&D spending as a % revenue compared to the average software industry indicates that it focuses strongly on developing and enhancing its strong breadth of EDA solutions. Though, we believe that Synopsys has a stronger R&D capability than Cadence despite having a lower R&D spending as a % of revenue than Synopsys with its higher patent publications and could be a factor for Synopsys’s strong market share gains to cement itself as the market leader.
Superior Margins than Competitors
Furthermore, besides product breadth and innovation, we also analyzed the company’s profitability. We compared the company against its competitors in terms of profitability margins.
|
Companies |
Revenue ($ mln) TTM |
Gross Margins (5 years) |
Net Margins (5 years) |
FCF Margin (5 years) |
|
Cadence |
3,283 |
88.45% |
23.57% |
23.60% |
|
Synopsys |
4,950 |
79.65% |
14.76% |
19.60% |
|
Siemens |
1,424 |
32.34% |
7.23% |
4.83% |
|
Average |
3,219 |
66.81% |
15.19% |
16.01% |
Source: Company Data, Global Data, Khaveen Investments
As seen in the table, Cadence’s gross, net and FCF margins are all higher than its competitors despite it having a lower revenue than Synopsys. Whereas Synopsys is second with the second highest margins followed by Siemens. To analyze the company’s profitability, we examine the expense analysis chart below.
Source: Cadence, Khaveen Investments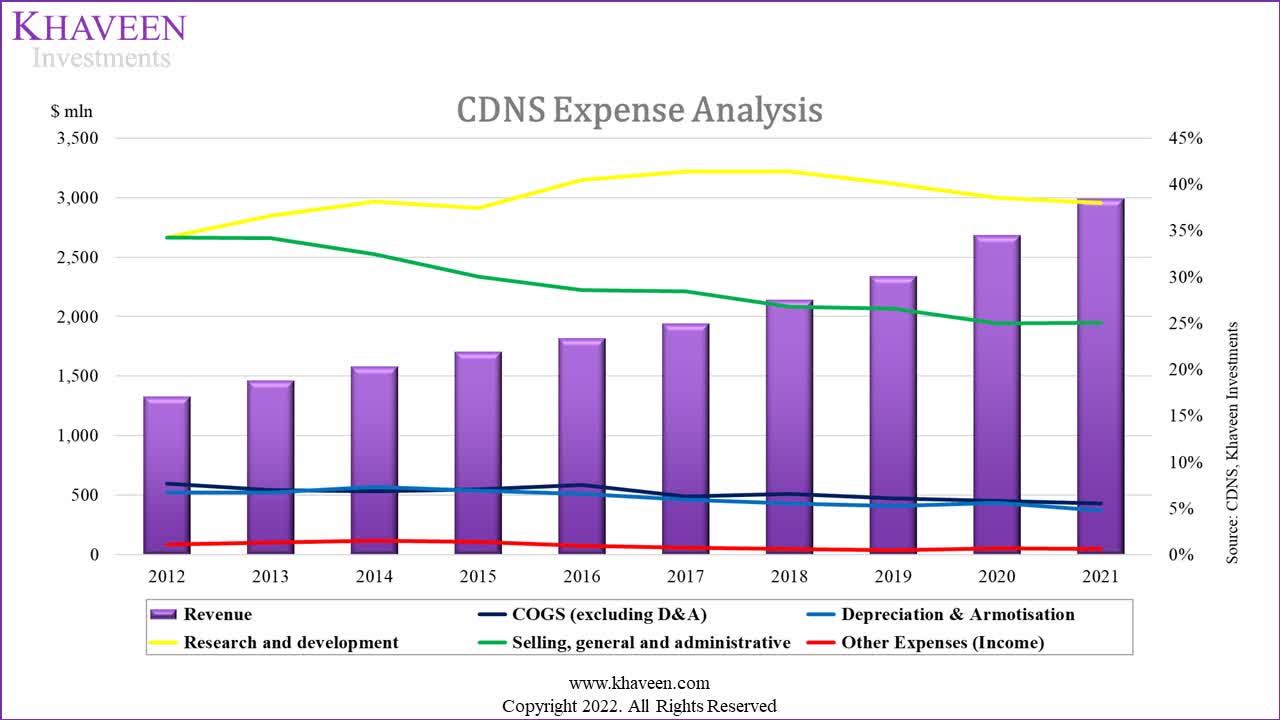
Based on the chart, the company’s highest expense is R&D which represented 38% of revenue in 2021 followed by SG&A expenses. Its SG&A expenses had declined as a % of revenue over the past 10 years. Additionally, R&D expenses as a % of revenue increase through 2017 and declined beyond that year until 2021.
Cadence, Khaveen Investments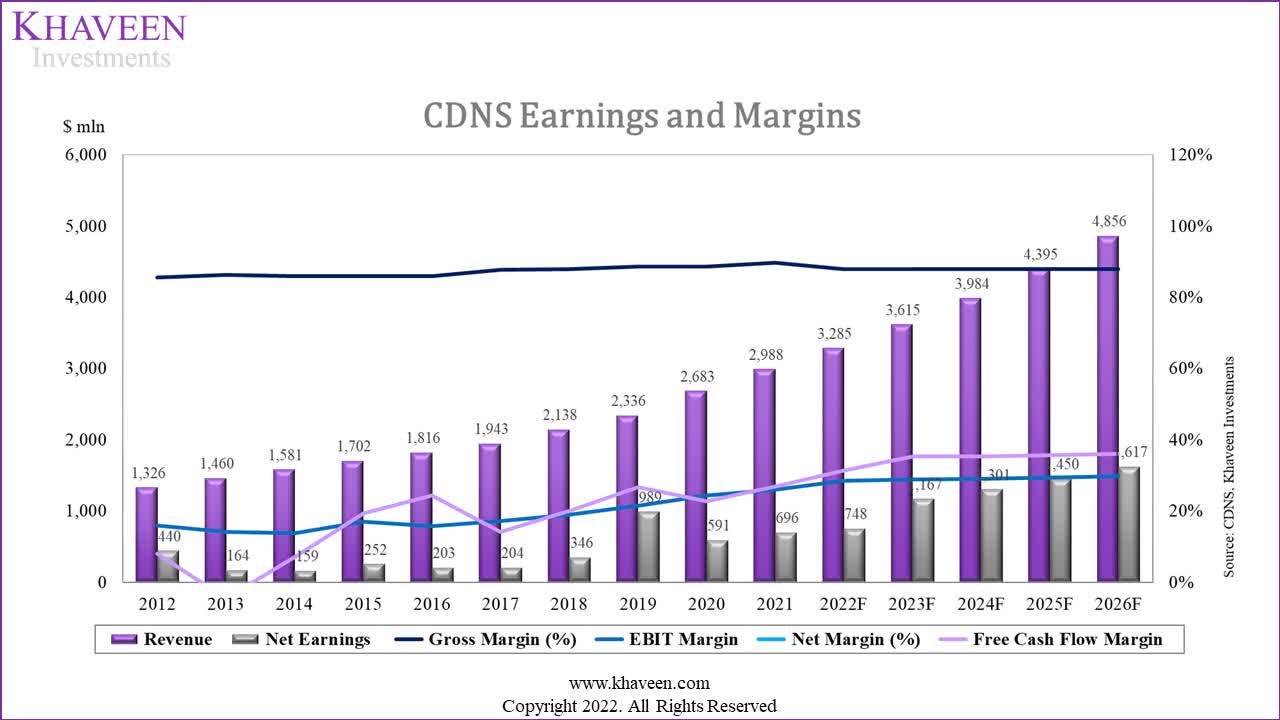
We forecasted the company’s SG&A as a % of revenue to decline based on its 10-year average of -3.37% as a software company with a scalable business model and its recurring nature of revenues as explained in the quote below.
In any fiscal year, between 85% and 90% of revenue is characterized as recurring revenue – Cadence Annual Report
Moreover, we forecasted its R&D spending as a % of revenue to increase based on its 10-year average of 1.24% as it continues to focus on the development of EDA solutions based on its annual report. In total, we forecasted its net margins to increase to 33.31% by 2026. Overall, we expect R&D to remain its largest operating expense as it focuses on product development to maintain its competitiveness but we believe its SG&A expenses to decrease as a % of revenue with its solid market reputation and integration in the semicon supply chain owing to its relationships with key customers and high switching costs.
Risk: IP Protection
The company highlighted in its annual report that it depends on IP and highlighted the threat to its competitive positioning if it fails to defend its IP. As discussed, we believe Synopsys is a major competitive threat to Cadence due to its higher number of patent publications despite lower R&D spending as a % of revenue.
Cadence
Verdict
To conclude, we believe Cadence is a top EDA software company with a market share of 29.3% in 2021. One of the factors which we attributed to its firm grip in the market is its wide product breadth of chip design and verification, design IP and PCB & advanced packaging for various chip types. We forecasted the company with a 5-year forward average of 10.2% through 2026 driven by strong design IP supported by its partnerships with key customers such as TSMC which highlights its strong integration in the semicon supply chain.
Moreover, we believe its strong R&D capabilities with its high R&D spending as a % of revenue compared to the software industry highlights its commitment towards product development to maintain its market position. Lastly, we forecasted its net margins to increase to 33.31% by 2026 with declining SG&A expense as a % of revenue which had declined at a 10-year average of -3.37% with its firm position in the EDA market. Overall, the company has an average analyst price target of $187.76 with an upside of 24%, thus we rate the company as a Buy.
Be the first to comment