

SouthWorks/iStock via Getty Images
Investment thesis
In this article, I describe the results of my efforts to adjust Seeking Alpha’s Quant Ranking System outputs for the Automobile Manufacturers industry, intending to identify potential winners and losers in the coming months.
Based on my analysis, I conclude that buying Tesla stock (NASDAQ:TSLA) and shorting Lucid Group stock (NASDAQ:LCID) could generate abnormal returns over the medium term.
Why am I trying to adjust SA’s Quant Ranking System?
The quant system that Seeking Alpha offers is unique in my opinion – just following it over a long haul can give a potential active/semi-passive investor a massive advantage over the broader market:
Seeking Alpha’s Quant Performance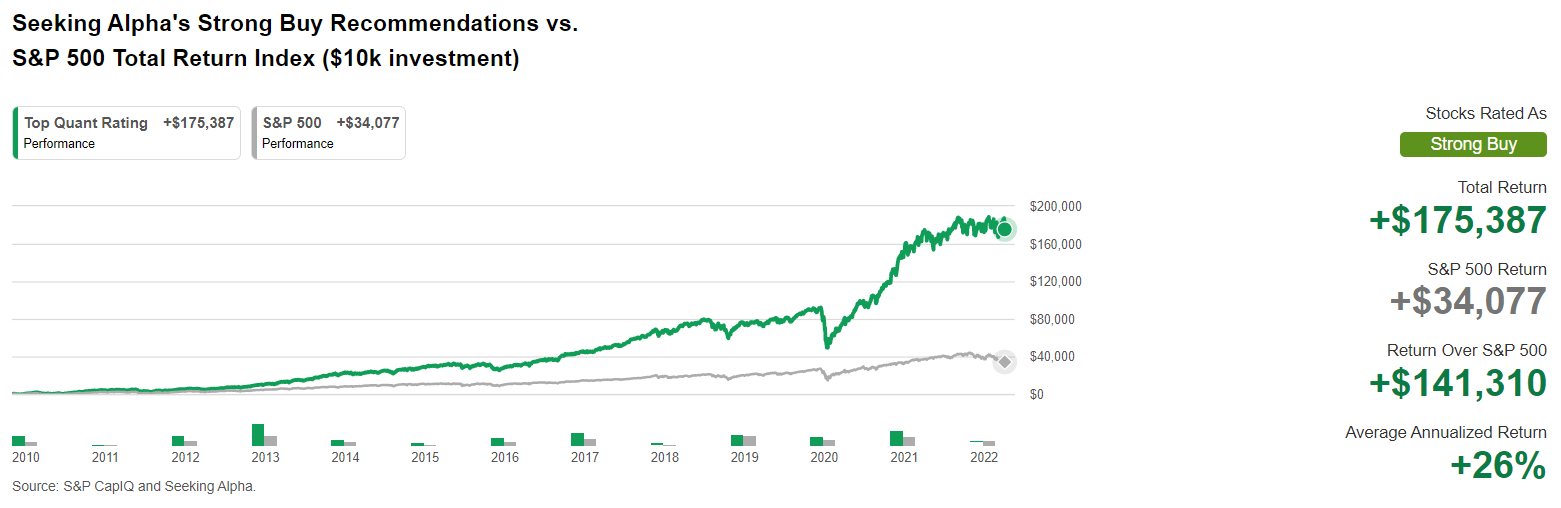
In my opinion, however, there is no limit to perfection – we should always be thinking about how we can improve and optimize the existing system to achieve even greater returns in the long term.
In my bearish article on Beyond Meat (BYND), I have already written that the Quant Ranking System of SA can be modified by narrowing the sample. If we are faced with the task of analyzing the 5 key characteristics of a company from, say, the oil and gas exploration and production industry (74 companies in the sample), we have to understand that the existing system compares them with the entire energy sector (250 companies), and since it includes many other industries that are not similar in terms of business cyclicity, fundamentals, etc., we may come to false conclusions. Therefore, while comparing the indicators of individual companies with the corresponding indicators of the entire sectors is useful, I think it can be improved if we use the industries of these companies instead of the sectors.
Adjusting the automobile manufacturers industry
The Automobile Manufacturers industry includes 31 companies and belongs to the Consumer Discretionary sector (518 companies). That is, if we go to the home page of, say, Ford (F) on Seeking Alpha, we see an assessment of its 5 key metrics over the last 6 months, as well as the company’s ranking within the industry and sector based on the quality of those metrics:
Ford’s main page on Seeking Alpha, author’s notes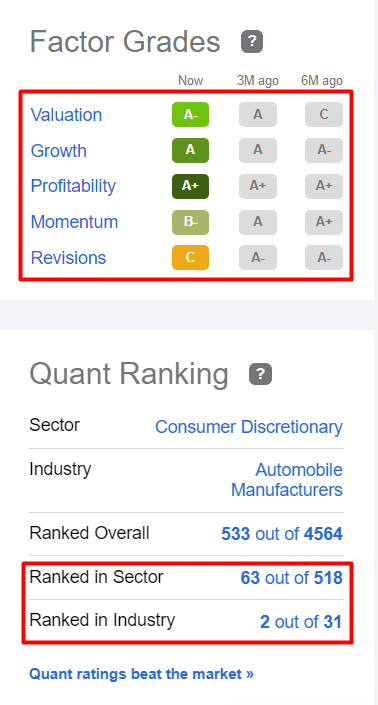
I have uploaded all the financial indicators and market multiples of companies in this industry that I believe are essential – as you can see, many values are simply missing:
Seeking Alpha’s data, author’s work in Excel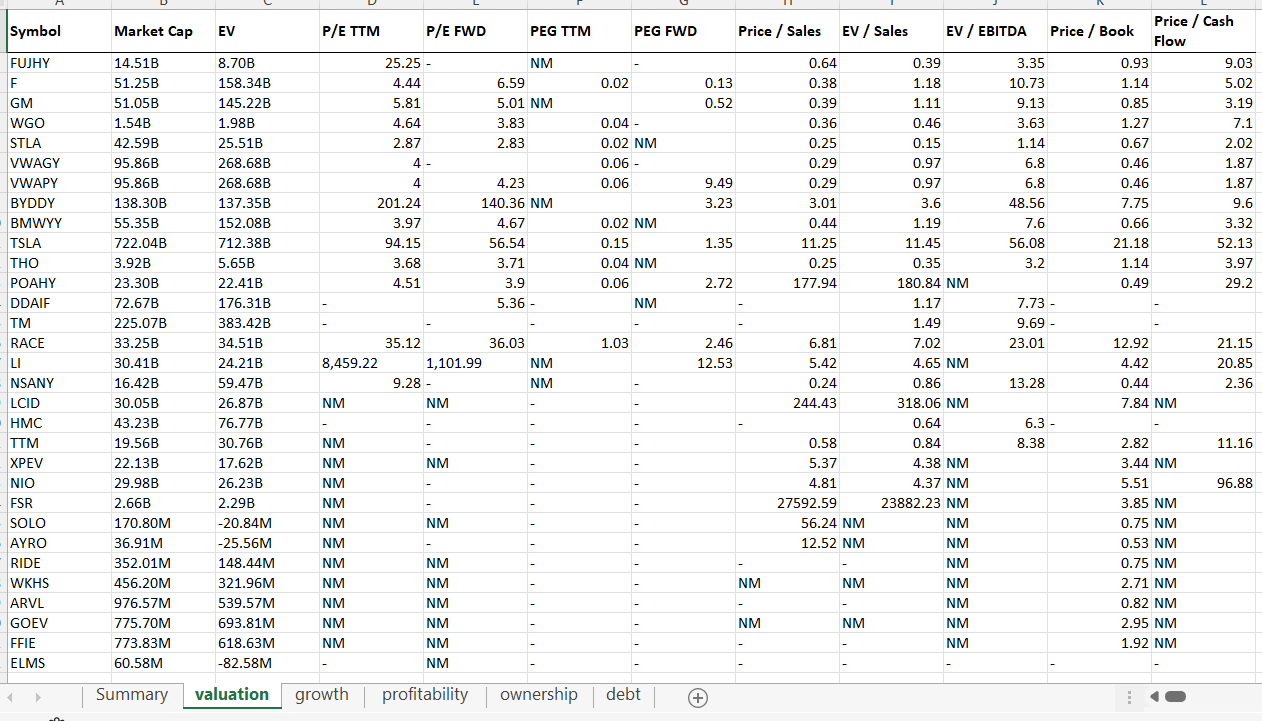
The lack of data is because companies do not have relevant indicators – it is impossible to calculate a positive price-to-earnings ratio if a company does not make a profit; the same applies to the price-to-sales ratios of companies such as Lordstown Motors (RIDE) or Canoo (GOEV).
Today, when the real interest rate is below -6%, I think it is irrational to buy capital-intensive companies that have not even started to generate revenue – it goes against common sense. Such companies should only be considered as short-ideas in the current macroeconomic environment where monetary easing is a thing of the past – I will come back to this thesis a bit later. For now, I want to focus on finding the most undervalued, profitable, and fastest-growing player in the industry that has the best chance of outperforming the market in the coming months.
As with the original Quant Ranking System, I compare all the companies’ metrics, but only with the median values for the industry – this is what the processed data sets look like:
The Valuation table of the sample The Growth table of the sample The Profitability table of the sample The Debt table of the sample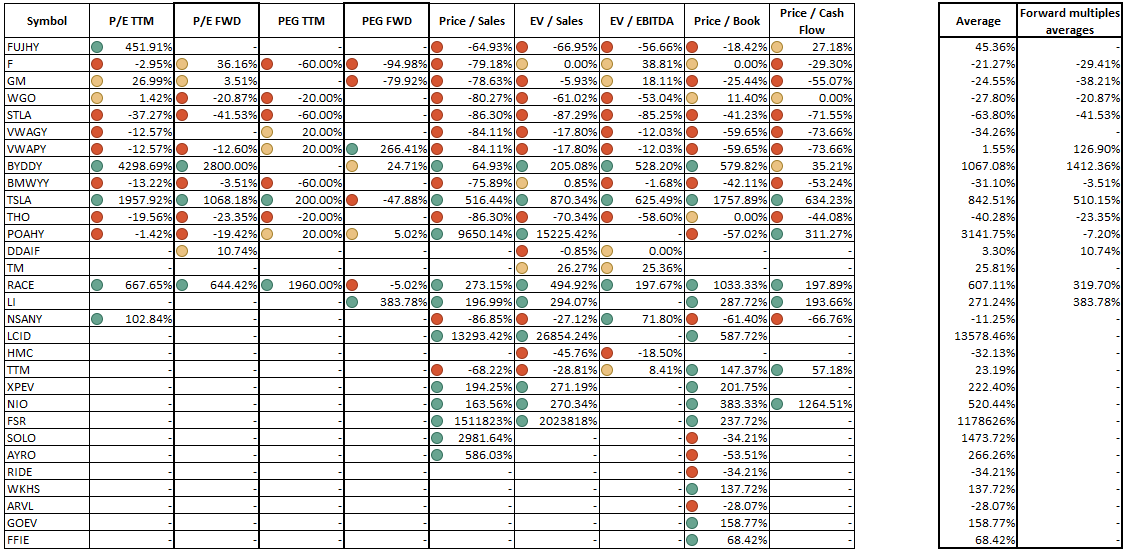
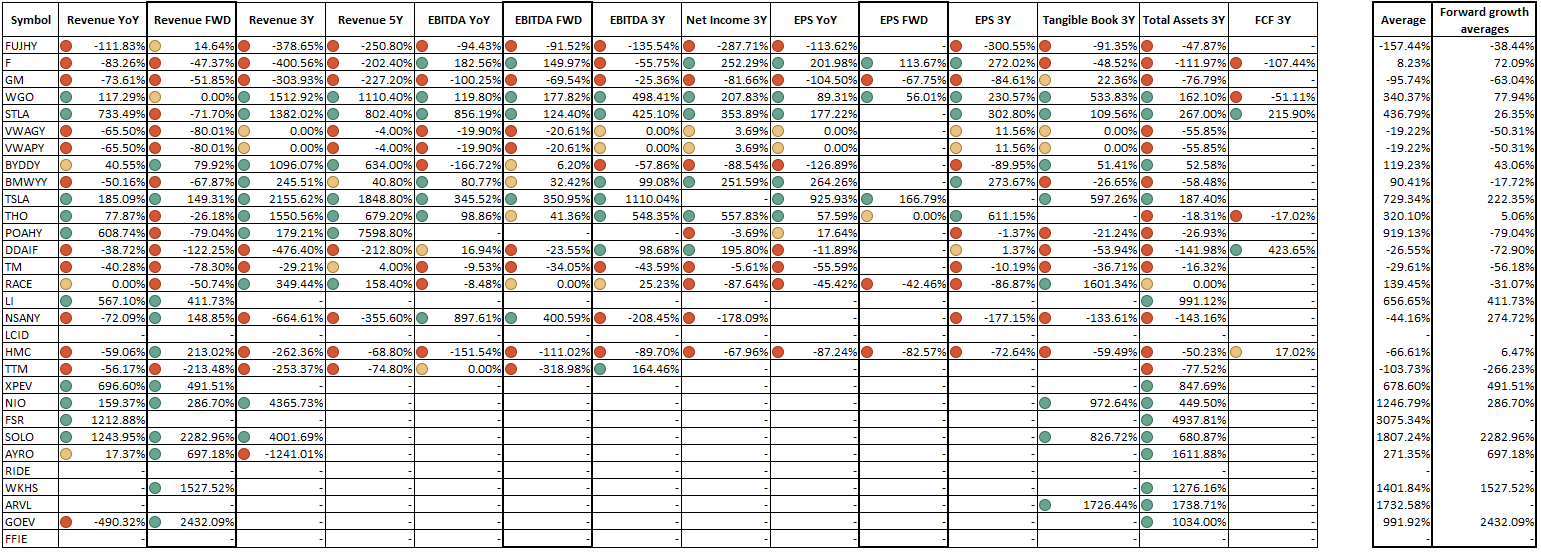
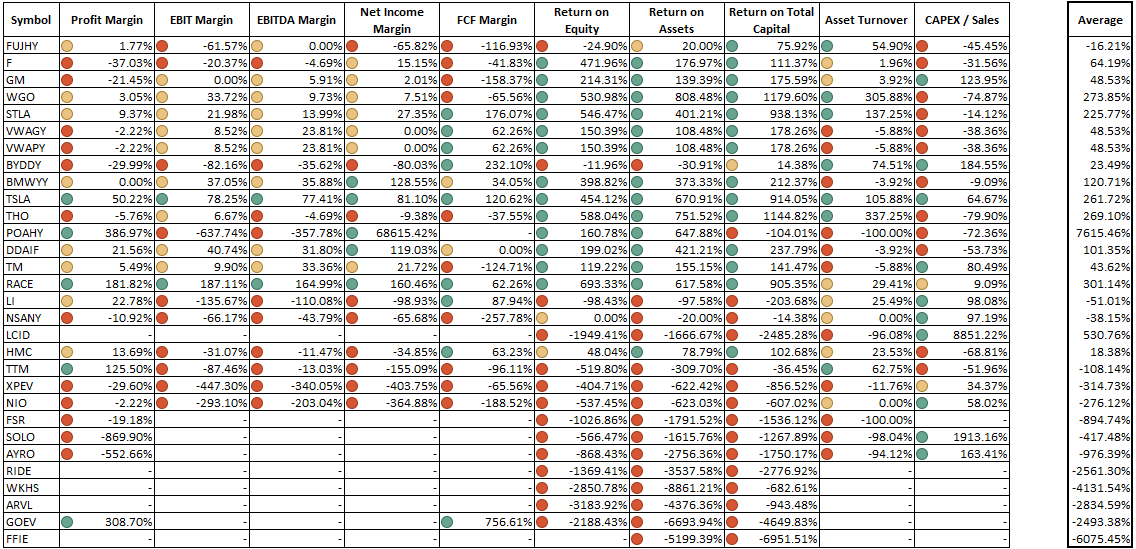
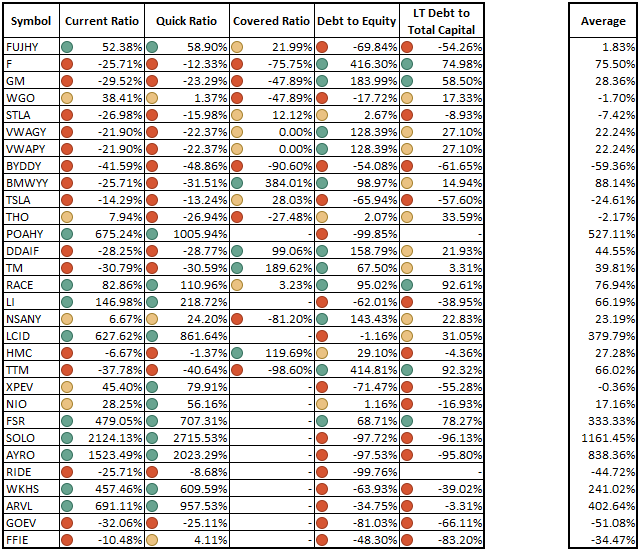
Author’s note: The dots mark the deviations from the median values. If the deviation is above 50%, the color is green. If the deviation is in the range of 0% to 50%, the color is yellow. Negative deviations are marked in red. The rightmost columns are the averages for each company’s data rows.
Of course, we can not do a full comparative analysis because we lack data on the companies at the bottom of the tables – even within the same industry, business cycles are very different. But we can still draw certain conclusions:
- Companies that are in the early stages of development (at the bottom of the tables) will not be profitable in the coming year – analysts’ forecasts indicate strong revenue growth, but there is no forecast for EPS (and even EBITDA) numbers. The profitability of these companies is terrible – this is obvious because they are burning a huge amount of cash for both working capital and CAPEX;
- European and Japanese companies – Subaru Corporation (OTCPK:FUJHY), Stellantis (STLA), Volkswagen (OTCPK:VWAGY), Toyota (TM), Nissan (OTCPK:NSANY), etc. – appear undervalued by most TTM valuation metrics. However, this is due to difficulties in operational growth (or at least in maintaining operational stability) – supply problems, chips shortages, a high share of sales in Russia, which must be abandoned, as well as the supply of raw materials (the dependence of these companies on the production of ICE is still high, and catalysts for this type of engines require a lot of palladium, 40% of whose market is controlled by Russia);
- The Chinese market represented by (NIO), (XPEV), (LI), and (BYD) looks interesting and diverse, but in my opinion, is overvalued. Yes, the addressable market in China is huge – growing demand allows projections for sales growth many times higher than the median of the sample. But at the same time, Nio and XPeng, for example, are increasing their operating losses, so we see that their forward multiples and the TTM coefficients are many times higher than the global industry medians (especially in terms of revenue growth). Monetary policy in China is very different than in the U.S. – to the benefit of these companies. However, we cannot hide the political risks – who knows when the party will ask them to delist, as was the case with DiDi Global (OTC:DIDIY). Therefore, I will not consider Chinese companies as an investment in this article (but if there was such a task, I would choose BYD – according to the above screener, the company looks the best on key metrics);
- Recreational vehicle manufacturers – Thor Industries (THO) and Winnebago Industries (WGO) – look very cheap and can be compared to the hype giants of the industry in terms of TTM margins and business growth. However, against a backdrop of rising gasoline prices in the U.S., this niche could take a serious hit – if it becomes cheaper to stay in a hotel than in a van while vacationing somewhere near the Great Canyon, investors will most likely take markdowns on valuations. There is already some concern that demand may have already collapsed. As a result, despite low multiples and high growth rates in the past, I would so far refrain from investing in the RV sector.
Of all the companies, Tesla, Ford Motor (F), and General Motors (GM) seem to me to be the most interesting picks, while Fisker (FSR), Canoo, and Lucid Auto are obvious short candidates. Why?
Seeking the winner
Now I’d like to discuss in general terms the specifics of the potential industry winners I have selected, which can provide today’s investors with exceptional returns over several years.
- Ford Motor Company’s TTM valuation multiples are on average 19% below the median values of the analyzed sample, while the forwarding PEG ratio is ~0.13X – that’s 79.18% below the median. Yes, according to analysts’ forecasts, revenue will suffer next year (see the earnings revisions). However, both EBITDA and EPS numbers are set to increase significantly – presumably, the company will reduce operating costs and continue to expand its EV segment (Mustang Mach-E). The liquidity and debt service ratios also show the company’s superiority to the industry – against a backdrop of fast-growing companies spending a lot of money on infrastructure expansion, Ford already has the necessary production capacity – so the company spends less CAPEX, and despite declining margins, Ford’s business generates a much higher return on capital invested than most other peers;
- General Motors Company is similar to Ford in its business cycle and vision for the future – the company is trying to adapt to the EV future and is also actively investing in the development of autonomous driving. TTM valuation multiples are ~20% below the industry median, which, like Ford, can be explained by low margins and business growth. At the same time, GM has better liquidity and lower leverage compared to Ford;
- Tesla, whose fair price per share is estimated by various banks to range from $250 to $1620 (from -62% to +145% at the current price), has always been perceived ambivalently by the investment community – some speak of severe overvaluation, others of enormous growth potential. The truth, as always in such cases, lies somewhere in the middle. TTM valuation multiples are on average 10 times higher than the median, while TTM business growth is 5 times higher and margins and profitability are ~2 and ~7 times better than the industry medians, respectively. Given the absolute superiority in terms of operating metrics, the market values the company’s shares at a significant premium. Without DCF modeling, it is impossible to assess the appropriateness of this premium, but the comparative advantage over other industry players is obvious – especially in terms of passing on increased raw material costs and addressing global logistics issues.
So which one should I choose? Let us take a look at the quarterly dynamics of the companies’ ratios over the last 5 years.
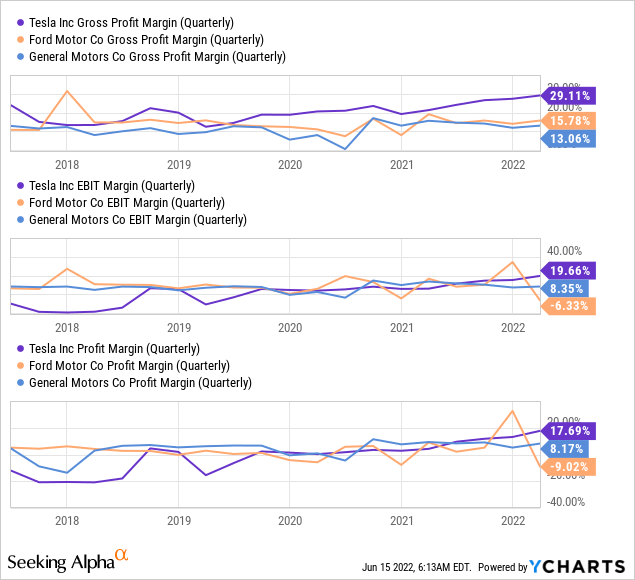
[Margins]
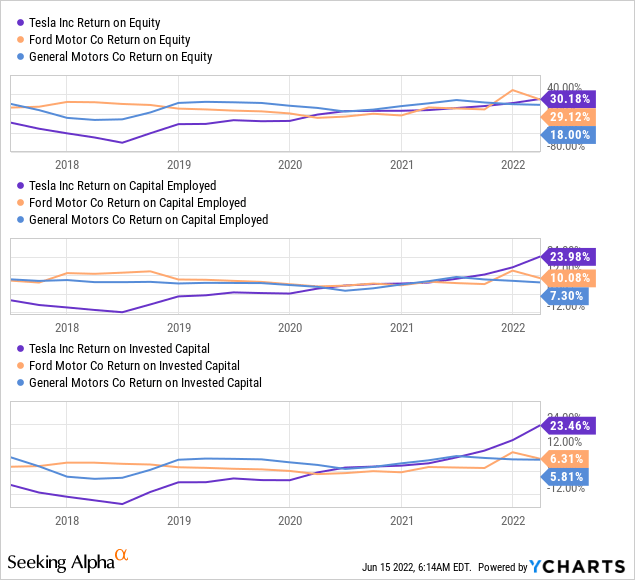
[Profitability]
When we look at the operational performance of companies over time, we see that Tesla is growing much more steadily than old-school automakers – unlike the management of GM and F, Elon Musk is not concerned with maintaining, monetizing, and refocusing old businesses – TSLA just does not have them. Moreover, in the last 16.5 months, the market has lowered Tesla’s P/E (TTM) ratio from 1312X to 89.55X (the stock price itself has only dropped 21% in that time) – that is, thanks to strong earnings growth, the company has achieved a ~15% per month decline in the TTM multiple.
Seeking Alpha Charting, author’s notes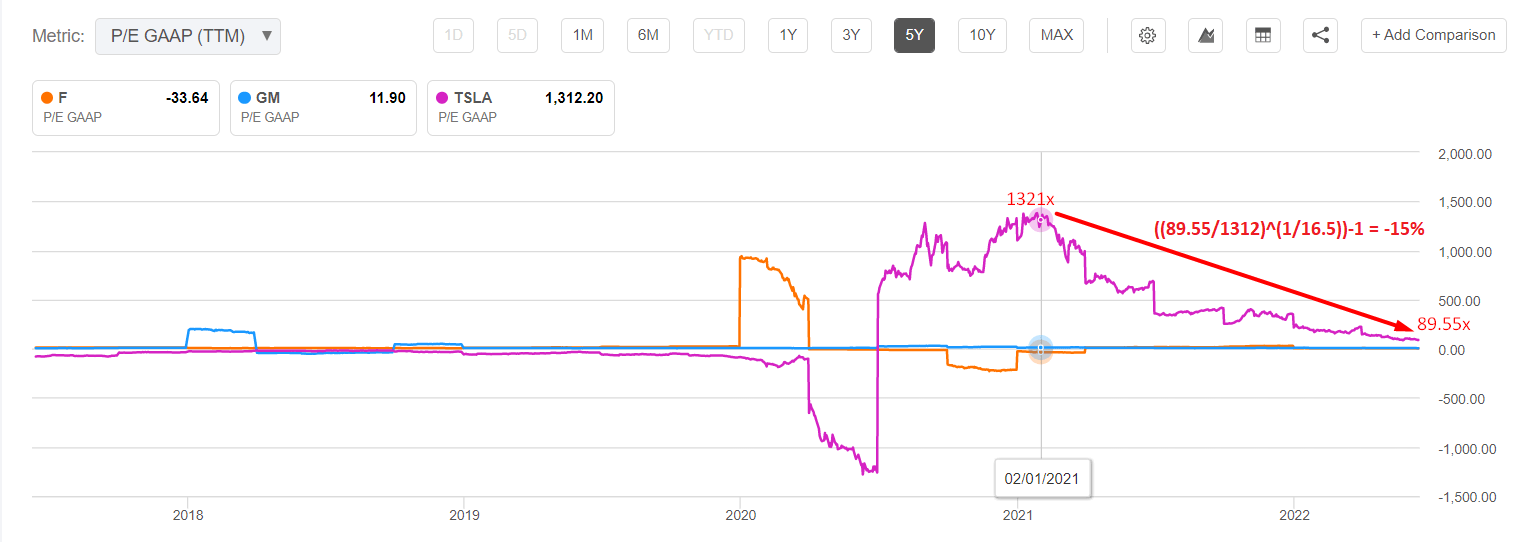
In comparison, the corresponding multiple of GM fell 54% (4.6% monthly average contraction), while the stock fell 35.55%. Ford had a negative P/E ratio at the time. This may mean that 1) the market is pricing in a sharp slowdown in Tesla’s revenue growth while expecting 2) F’s and GM’s revenues to stagnate. And in my opinion, the market is right about the second statement, but not about the first one. Why?
First, this is not supported by statistics – in Q1 2022, companies should have already felt price pressure due to rising commodity prices – and that was indeed the case, but Tesla was an exception to the rule:
Seeking Alpha’s data, author’s notes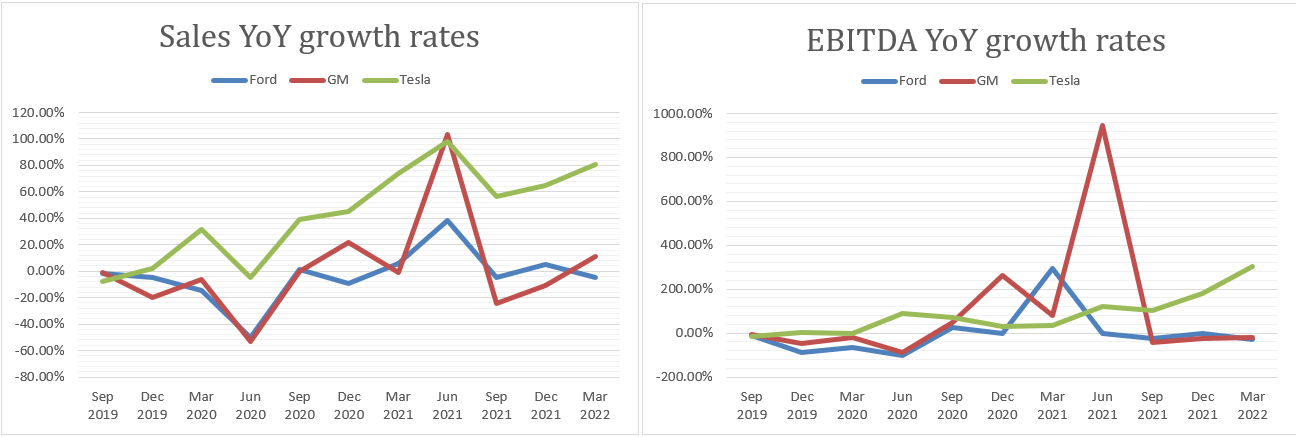
Second, I think the market is overestimating the speed of multiple contractions – 40% this year and another 22.65% next year. Of course, that’s how it works – fast-growing companies should grow out of their valuations. But to assume that the P/E ratio will more than halve in 2 years with roughly the same business growth, I think is very pessimistic.
Seeking Alpha, YCharts, author’s notes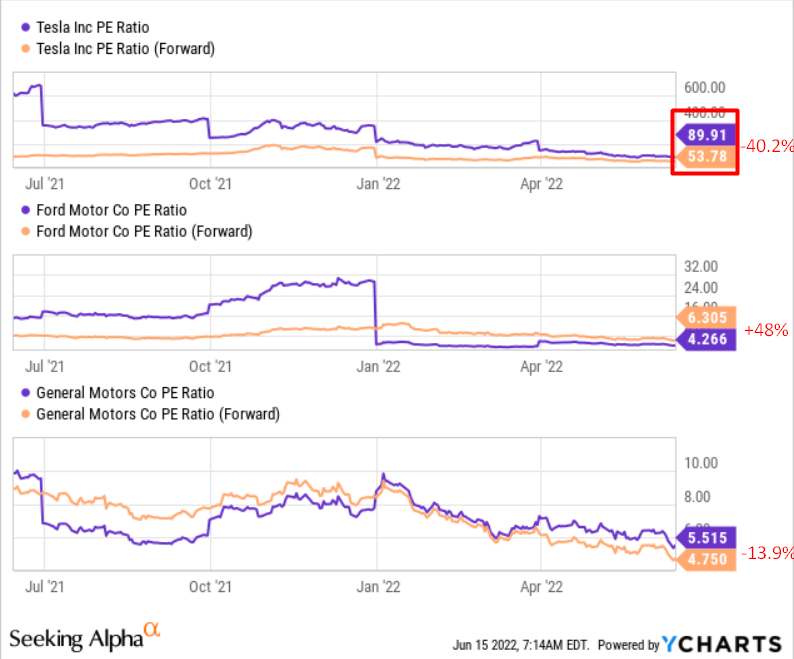
Third, as for GM and Ford, these companies are reshaping their business models and trying to succeed in a market where Tesla is already a leader. Of the two stocks, I like Ford better – the company’s EV segment is growing faster, and F is much more innovative, according to Sparkline Capital’s study:
Sparkline Capital’s study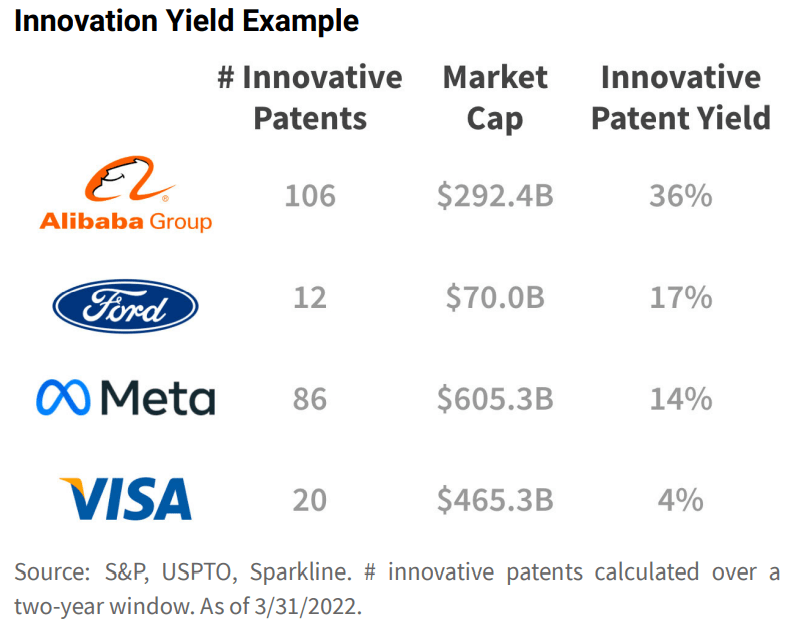
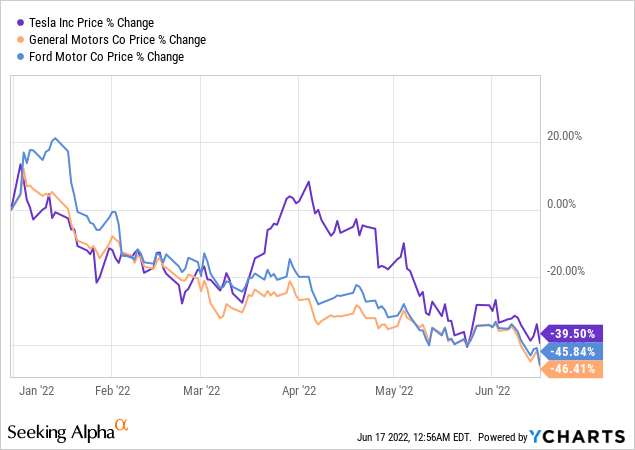
Fourth, neither GM nor Ford have as strong retail support as Tesla – that’s an important criterion to consider, in my view. And these companies fall by about the same percentage in market sell-offs, especially recently.
Therefore, despite the internal battle between Ford and Tesla, I am choosing TSLA – mainly because against this buy position, I am considering a short position of one of the clear contenders for bankruptcy in the current state of the capital markets.
Seeking the loser
Of the three companies selected by my customized screening system – Lucid, Fisker, and Canoo – I suggest taking a short position in LCID. There are some reasons to do so.
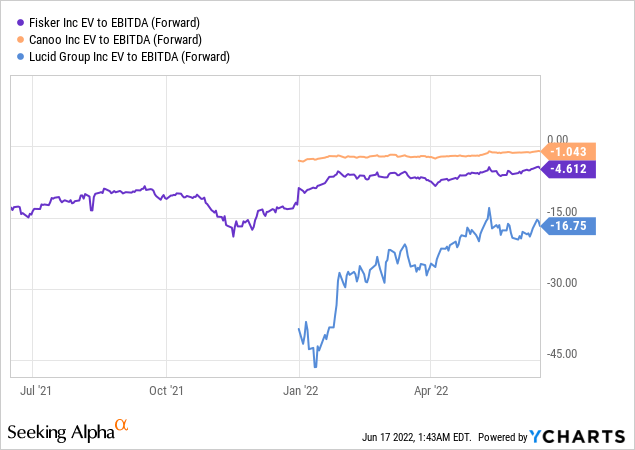
First, all of the above companies are obviously highly valued – as shown by a comparison with the median values in the industry. But Lucid Group, with a market cap of >$25 billion, appears to be the most expensive in terms of EV/EBITDA (FWD) valuation metric:
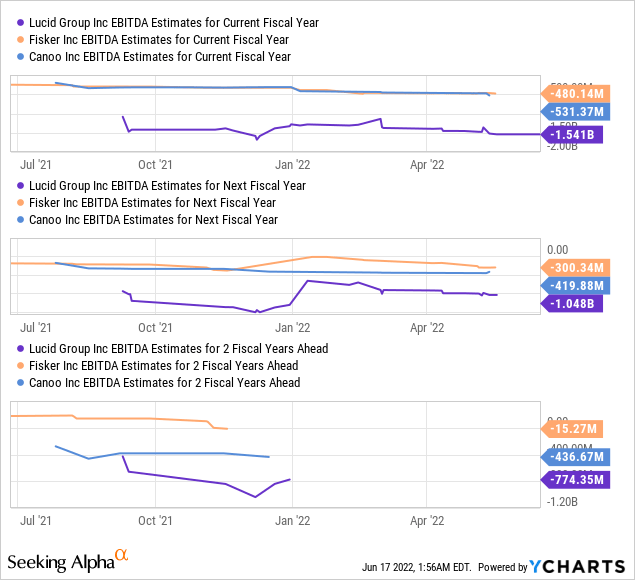
In addition, the company’s EBITDA forecasts have been revised significantly downward over the past year – while the market was expecting an EBITDA loss of about $1.2 billion in March 2022, that forecast figure is now $1.541 billion. A similar trend can be observed in analysts’ forecasts further back. The company’s absolute losses are significantly higher than the forecast losses of the other companies in the analyzed sample.
Lucid’s price-to-sales forwarding multiple is not the highest in the sample, but when we match the companies’ current market capitalizations to estimated sales in FY 2023 and FY 2024, we see an unreasonably high overvaluation of LCID, even compared to other highly valued companies:
YCharts, author’s notes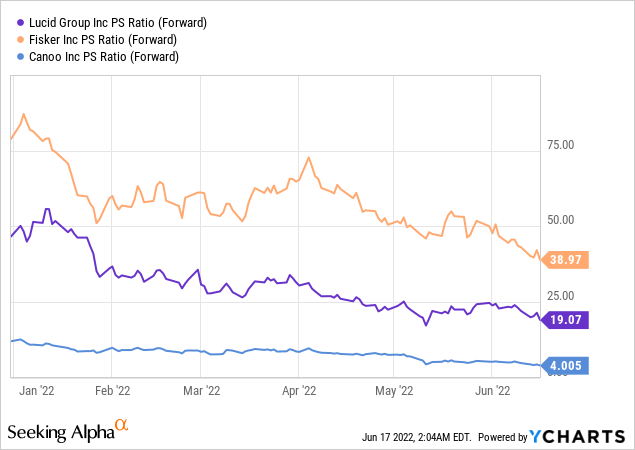

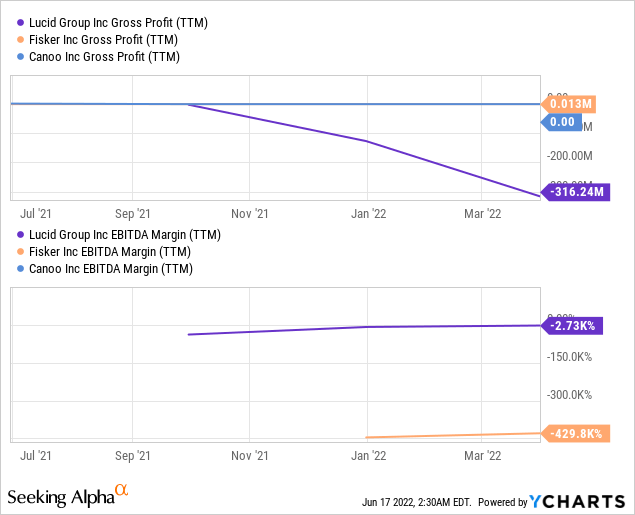
Second, Lucid burns about as much cash as Fisker, but has a risk profile (based on the ratio of cash on the balance sheet to market capitalization) similar to that of Canoo, the smallest company in the group analyzed:
YCharts, author’s notes
The margins of Lucid and other companies in the group leave much to be desired, so I do not think the recent news about the $1 billion revolving credit facility will turn the tide in LCID’s favor.
Third, Lucid shares are owned by a much larger number of institutional investors, while the possibility of a short squeeze is minimal compared to other companies in the sample.
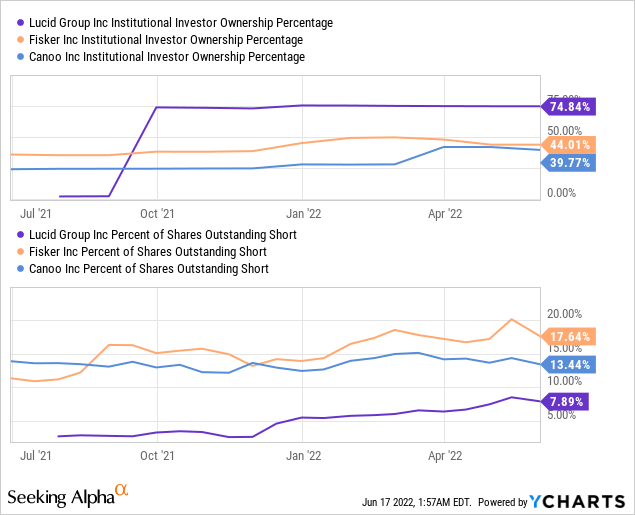
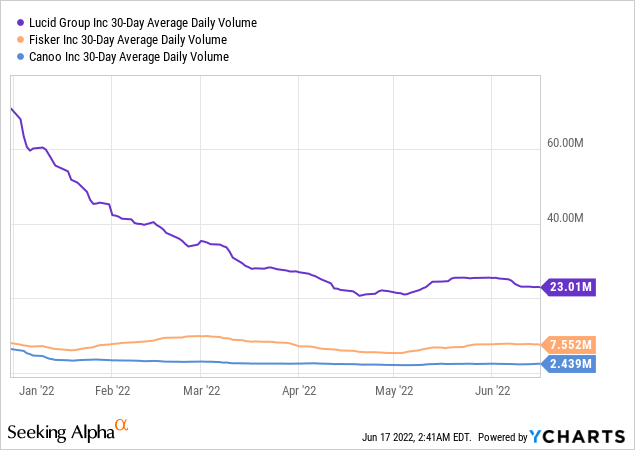
Moreover, LCID is much more liquid than Fisker or Canoo, so it will be easier to short it.
Instead of conclusion – How can one play this trade?
In my opinion, the use of pair trading within the same industry is an interesting way not only to generate abnormal returns over the medium term (when market leaders start to break away from losers) but also to hedge the portfolio in case the entire industry falls off a cliff (when both the market leader and the loser fall by roughly the same percentage, which is a zero-sum game for investors).
If we select companies with similar business cycles, we can also expect similar volatility in their shares – the direction of the trend will already depend on how the companies perform in terms of operational efficiency.
Both Tesla and Lucid are high-growth representatives of the automotive industry – just deciding which of them will weather the inflation storm and tightening monetary policy can be a thesis for pair trading in the medium term. According to my analysis, Tesla has a much better chance of staying cheaper than Lucid and growing better on all key metrics. Most likely, the company is better able to cope with rising manufacturing costs, and the power of the brand plays an important role here – thanks to it and some timely management decisions, the current trend is very likely to continue.
Above I mentioned liquidity and low short interest as one of the reasons for choosing LCID among other unprofitable EV producers. These factors allow you to borrow enough shares from the broker to take a short position.
Interactive Broker’s TWS, LCID stock, author’s notes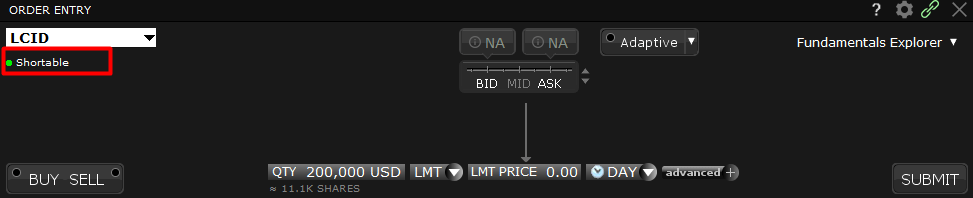
Depending on your broker, the cost of a short position may vary – but in general, an investor pays fairly low interest to borrow liquid stock. I use Interactive Broker as an example, but you can see for yourself which broker you prefer.
IB’s example on shorting $5M of AAPL stock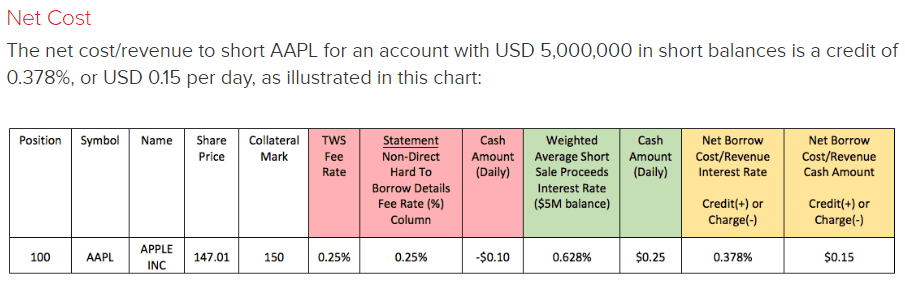
If a potential investor had implemented this strategy since the beginning of 2022, such an arbitrage (long TSLA vs. short LCID) would yield a return of almost 30% today (with a peak of ~60% in mid-May) – way better than the S&P 500 Index (-21.51% YTD).
Author’s calculations
Of course, past performance does not mean future performance. I could be wrong about many things – perhaps Lucid can overtake Tesla in the long run if Elon Musk makes a mistake in management, for example. However, the same can be said about any company.
Also, this strategy can lead to high unrealized losses in the short term, as my primitive backtest at the very beginning of the year shows (I marked this period with a red circle in the chart above).
However, considering these risks, I recommend the following algorithm if you decide to use my arbitrage idea:
- Buy TSLA for $X, sell LCID also for $X;
- The total amount of the deal should not exceed 15-20% of the medium-term/speculative part of your portfolio;
- Keep the positions open at least until the end of 2022.
Let me know what you think about this strategy in the comment section below. Happy investing and stay healthy!
Be the first to comment