


Darren415
The bearish case for stocks is fantastic enough that it deserves a summary. Set the stage with a deep-voiced celebrity narration over visuals of the wind picking up through some cornfield with dark clouds on the horizon. Bring in a rumble of thunder and flashes of lightning for added effect.
The doom and gloomers will lead the scene by highlighting how inflation is out of control and the economy is collapsing in real-time. The Fed, of course, is clueless by hiking rates into oblivion while simultaneously tapping out consumers and crushing businesses. Any day now, wide-scale layoffs with depression-era breadlines are coming to a city near you. Just believe that the 2022 version of the financial crisis Lehman Moment is just around the corner. Start stocking up on canned goods to hunker down, this is it!
It almost sounds funny because the production level of this blockbuster disaster needs to be top-notch to make up for the lack of substance as the story is simply not true. Stock market bears are counting on a fairytale that doesn’t exist.
The reality is that investors and the bulls have hard data on their side which has evolved much more favorably in recent weeks and months than many would have you believe. Our message here is to highlight several reasons to expect the next big move in stocks to be higher compared to the current extreme pessimism.
The August CPI Data Will Shock The World
The biggest mistake bears are making is failing to recognize the cooling inflationary trends, or at least connecting it to the wrong reasons. Ahead of the upcoming August CPI report on September 13th, a confirmation that inflation is decelerating faster than expected has massive implications that are very positive for risk assets and the broader macro outlook.
The headline number for July came in at 8.5%, down from a peak of 9.1% in June. Stocks rallied on the report and we expect another replay of that same trading action.
By now, most people will be aware that gasoline prices are sharply lower compared to their peak in June. According to AAA, the national average for a gallon at retail pumps is now $3.74, down 25% from the record high of $5.02. This is important for a few reasons. First, energy prices are a direct component of the CPI which now gets some breathing room. Assuming just flat or even slightly higher prices from here, we get into 2023 and the year-over-year comparison will be deflationary.
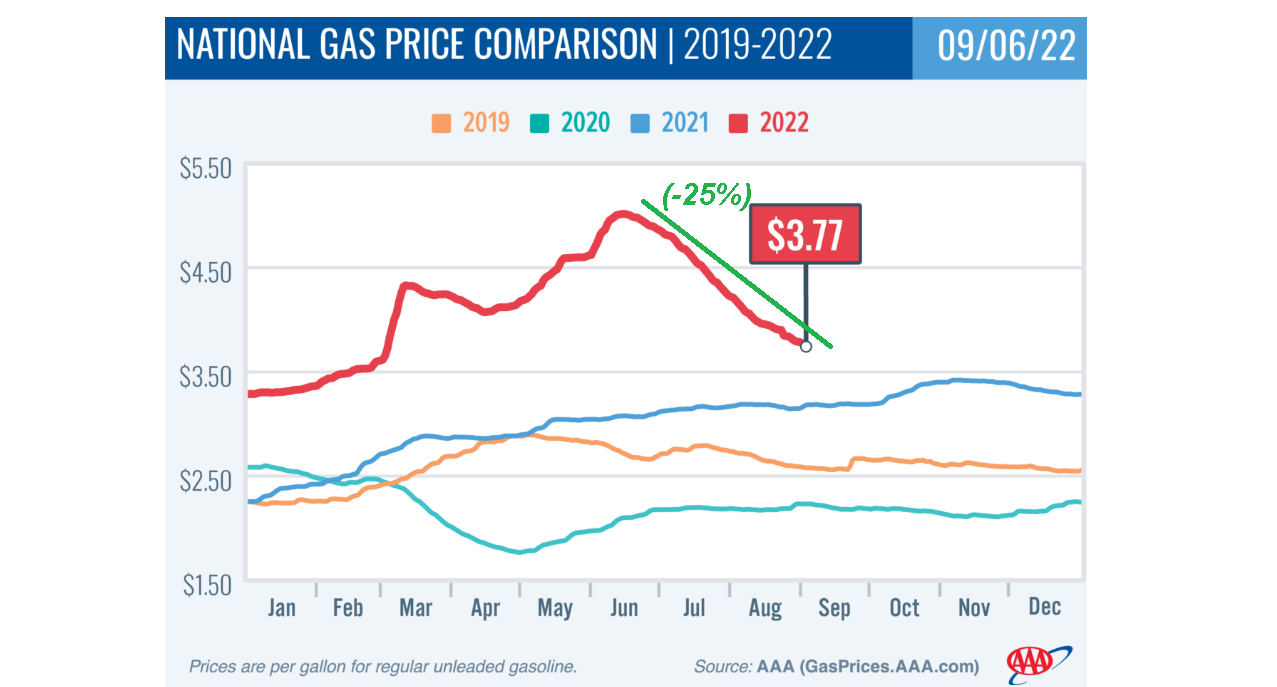
source: AAA
The other side to the discussion is the positive impact on consumer spending and even business operating margins. For many companies that were complaining about logistical expenses and supply chain disruptions at the start of the year, the lower cost of fuel today is nearly a windfall. Amazon.com (AMZN), during its Q2 earnings report specifically cited inflation, as its main headwind. Data like rebounding consumer sentiment since June and a better-than-expected ISM Services PMI, often seen as leading indicators, are responding to the energy relief.
What isn’t getting enough attention is the pullback in prices for other components of the CPI beyond energy. The headlines here have been very encouraging. Used car prices have been down for four months straight while even airline ticket prices have ticked lower reflecting the drop in energy prices. There is also some sign that rents are starting to pull back in some cities. Retailers moving to discount merchandise can also play into a lower CPI through their basket of goods.
Data compiled by CNBC highlights how prices for consumer staples like poultry and dairy products, along with services including car rentals and hotel lodging are all down over the past month. Our expectation is for the August CPI data to post a month-over-month drop, taking a big hit out on the annual rate.
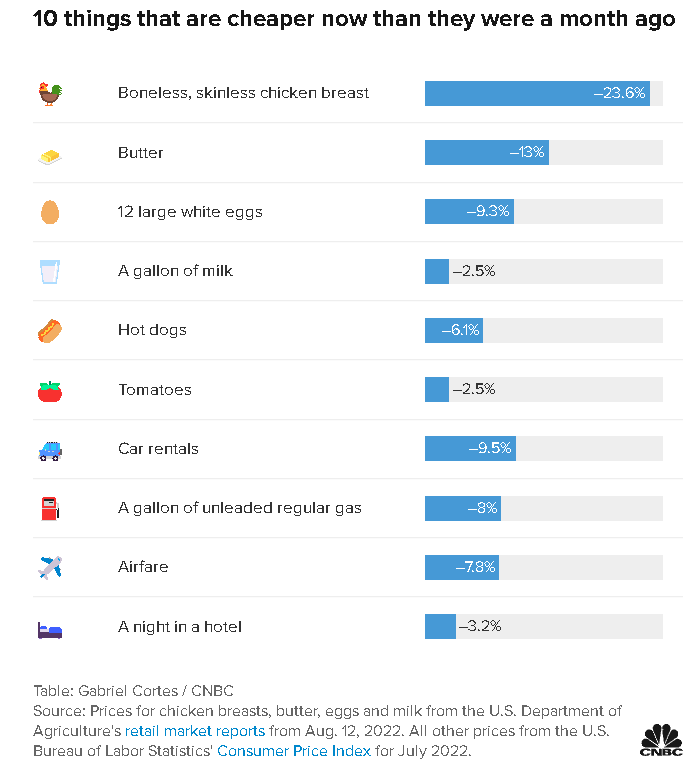
source: CNBC
When thinking about inflation cooling off, it’s not that prices are ever going back to 2019 pre-pandemic levels, but simply that the annual rate of change is stabilizing. The Fed’s target of a 2% year-over-year rate starts to appear more realistic and on the horizon by next year against the record June 2022 comps.
As it relates to our good friends “the bears”, nothing here suggests inflation as being “out of control” or approaching something akin to a stagflationary disaster. Remember there were calls back in Q1 for the price of oil (USO) to reach as high as $200 a barrel which has not played out. Some may look at the data above and claim it as evidence the economy is under pressure amid “demand destruction”. What we’re seeing is a more benign reset compared to pandemic-era supply chain disruptions. The supply and demand balancing act is doing some of the Fed’s work beyond the impact of interest rates.
How Will The Fed Respond To Lower Inflation?
The timing of next week’s CPI report is key as it comes ahead of the September FOMC meeting later this month which could play into both the rate decision along with updated monetary policy forecasts and messaging for the rest of the year.
We’re not looking for a “Fed Pivot” per se, with a 50 or 75 basis point rate hike nearly a lock for this month. The case we make is that the data will provide room for the Fed to adjust the fire and brimstone message that was on display at the Jackson Hole Economic Symposium that got the bears all fired up.
As a recap, Fed Chairman Powell stirred the pot by reaffirming the group’s commitment to stabilizing prices while suggesting further rate hikes will “bring some pain to households and businesses”. Our take is that this was a case of the Fed keeping expectations low with an overly cautious narrative as an effort to rebuild credibility compared to what is widely seen as their mistake in 2021 for not hiking rates sooner. In other words, it would not have made sense for the Fed to project optimism by extrapolating the latest inflation data points to declare an early victory. As investors and Fed watchers, we have the freedom of taking that step on our own.
Looking ahead, we expect to see some big changes to the Fed’s updated quarterly economic projections that were last released in June. In our view, there is room for its inflation outlook to be revised lower consistent with the July and August data which could help roll back the projected Federal funds rate forecast into 2023.
The market would take this as a sign that the Fed is closer to its “neutral rate” where its policy is neither restrictive nor accommodative and should be welcomed for setting more positive market expectations. In other words, the plot chart of interest rate expectations can tick lower, not because the economy is collapsing and the Fed is “pivoting” towards QE, but because inflation is slowing down faster than previously imagined.
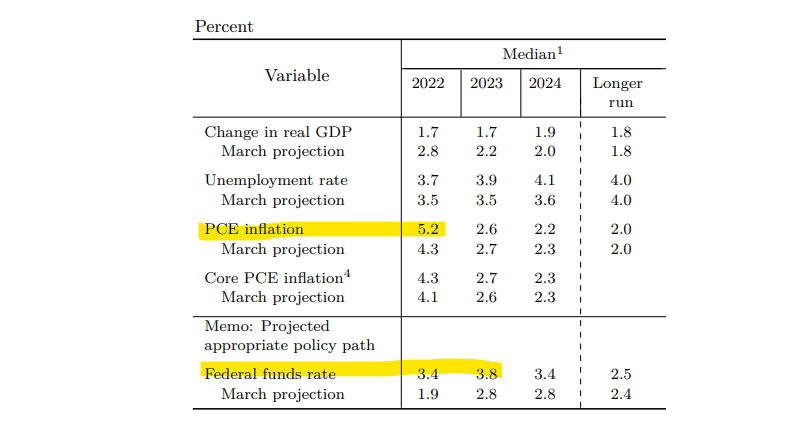
source: St. Louis Fed
The Economy Is Fine
Seemingly every month, the long-running argument is whether good news on the economy is bad news as it relates to inflation and Fed policy. The insight we offer is that we want to see the data brush aside fears of a deepening recession, which is the cornerstone of the bearish case for stocks. For stocks to trend significantly lower, unemployment will need to surge and corporate earnings decline, which is not happening.
If economic conditions keep chugging along, even amid higher interest rates, while inflation surprises to the downside can be very positive for stocks. Case in point, the August payrolls report showed the economy added +315k, above estimates closer to 300k, which went a long way to confirm economic conditions remain stable.
At this stage, it doesn’t appear the labor market is the primary driver of inflation trends, or that it’s not making a difference compared to the more structural changes of easing supply chain conditions and falling energy prices.
A bump in the participation rate with more people returning to the labor force meant that the unemployment rate technically climbed from 3.5% in July to 3.7% this month. The other important metric is average hourly earnings, up 0.3% m/m, down from 0.5% last month. In many ways, this was a “perfect” report, being not too hot where it would add implications to hawkish Fed policy, particularly on the wage side, or weak to the point of suggesting the economy is in a freefall.
The trend was even stronger in the July report, which came in at a massive +526k jobs, the strongest since last December. Even if employment is a lagging indicator, there just isn’t any sign that businesses are closing their doors. The bears will need to keep waiting for their breadlines.
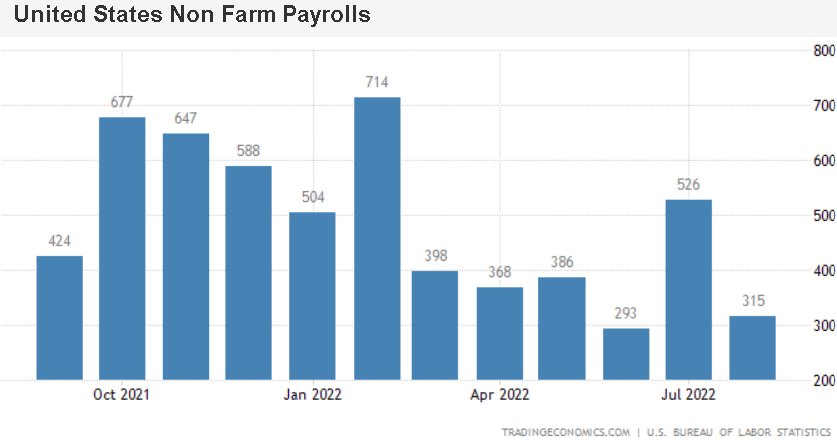
source: tradingeconomics
What about the Housing Market?
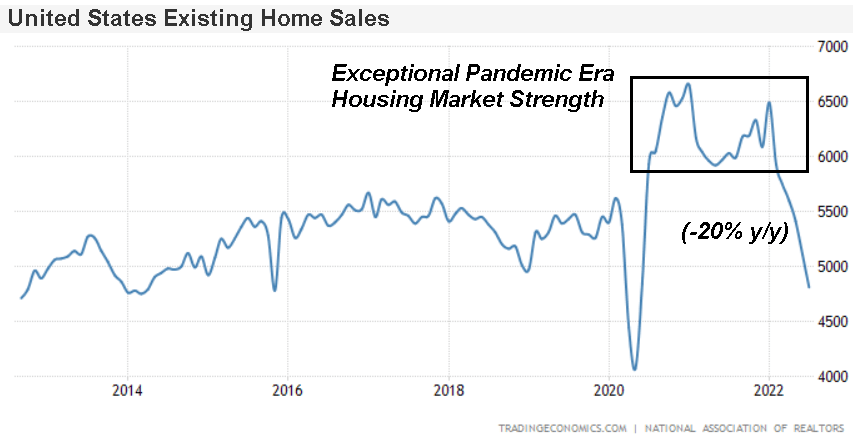
We’ll also add to the discussion regarding the apparent “collapse” of the housing market, with the headlines fueled by the July data showing a 20% y/y drop in existing home sales to 4.8 million and a 6% decline in prices from June. Higher mortgage rates have indeed changed the dynamics compared to 2020 and 2021. On the other hand, what often doesn’t get mentioned in the same paragraph is the pullback in the number of units sold has essentially returned the run rate to pre-pandemic levels when five million existing homes sold per month was average.
source: tradingeconomics
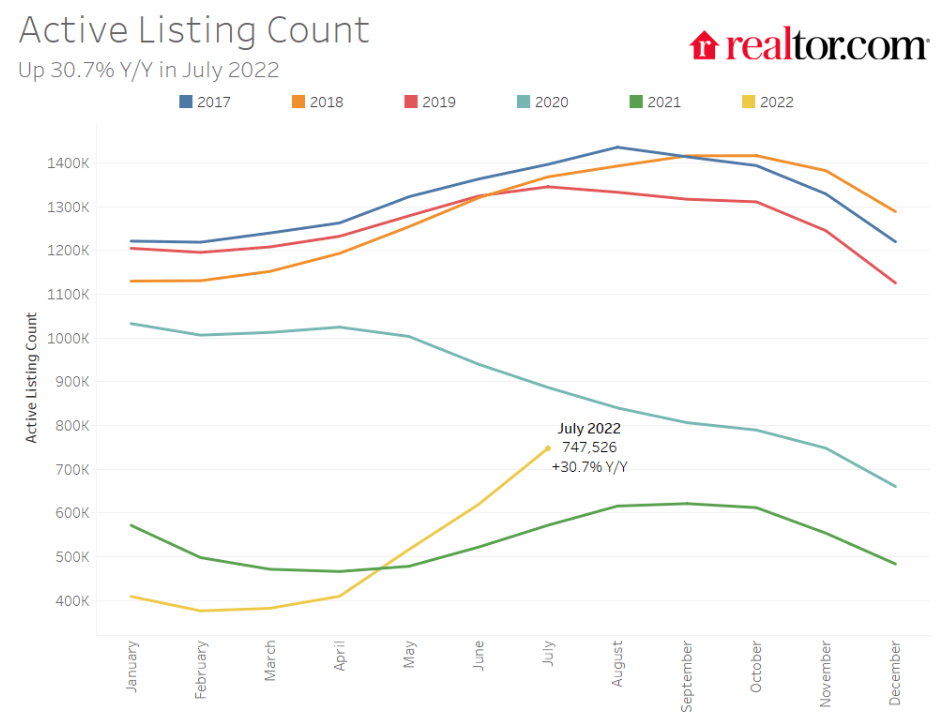
Bears are latching on to the skewed exceptional pandemic-era housing boom comparison to misrepresent what should more accurately be seen as a normalization. The median price of an existing home at $403k is still up nearly 40% from 2019 levels but active listings at 748k reflecting inventory levels are 40% below the average closer to 1.2 million between 2017 and 2019.
Again, there is no cause for alarm here recognizing that the trends from last year were unsustainable. The resilient labor market and improving consumer sentiment can work to limit the downside in home sales levels. Expect some volatility in the monthly housing data, but conditions are not as weak as the headlines make it seem.
source: Realtor.com
What’s Next For Stocks
It’s a great time to stay bullish on stocks. The catalyst we’re looking for is next week’s CPI report which could very well shock the world by coming in “cold” and below expectations. We’ve seen a current consensus for the headline number to drop -0.1% m/m and will take it a step further by forecasting a -0.3% print, with some rounding in there. The annual rate may dip under 8% this month.
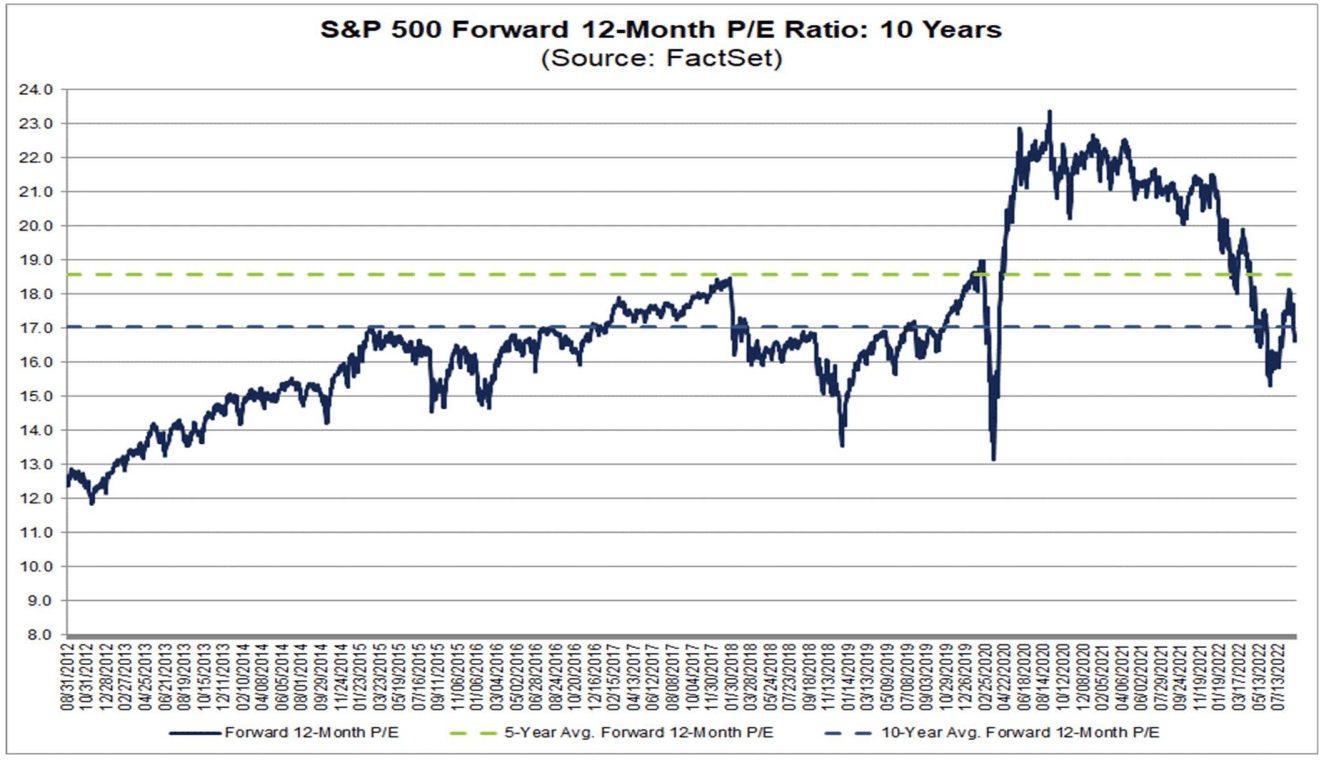
We view this latest correction in the S&P 500 (SPY) as a buying opportunity. According to bottom-up consensus EPS estimates, the S&P 500 is expected to grow earnings 8% this year, following what was already a strong Q2 earnings season. The market trading at a forward P/E of under 17x appears very compelling in a scenario where inflation is trending lower and economic activity comes in stronger than expected. Tech and growth names have underperformed over the last two weeks, but we see significant opportunities among beaten-down NASDAQ 100 (QQQ) names that are well-positioned to lead higher.
source: FactSet
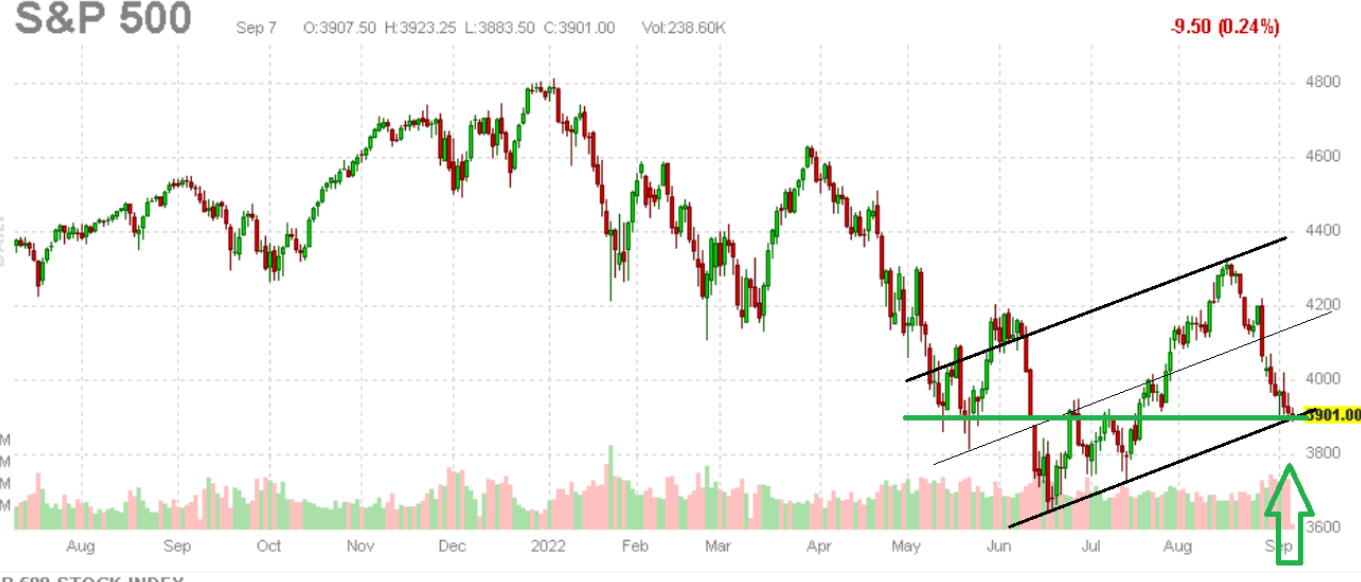
From the SPX chart below, holding the 3,900 index level was critical as an important area of technical support. A bounce above 4,000 can target a return to 4,200 and eventually the August high of 4,300 as the next upside target. We see the S&P 500 reaching 4,500 by year-end as sentiment turns more positive. Coming full circle to our article theme, we think stock market bears are going to be on the wrong side of history here.
source: finviz
Be the first to comment