

Bitcoin (BTC/USD) Price Outlook:
Bitcoin Price Forecast: Bullish Chart Pattern Sparks Recovery Rally, Can it Continue?
Bitcoin displayed why many investors are reluctant to view the coin as a currency just yet as it fell from $64,000 to $47,000 in a matter of days. Volatility was not limited to the downside, however, as recent losses were quickly stalled as the digital asset found support along a technical trendline. The decline of more than 25% has since been reversed, although further ground will have to be covered before Bitcoin can look to retake recent levels and continue its record-setting streak.
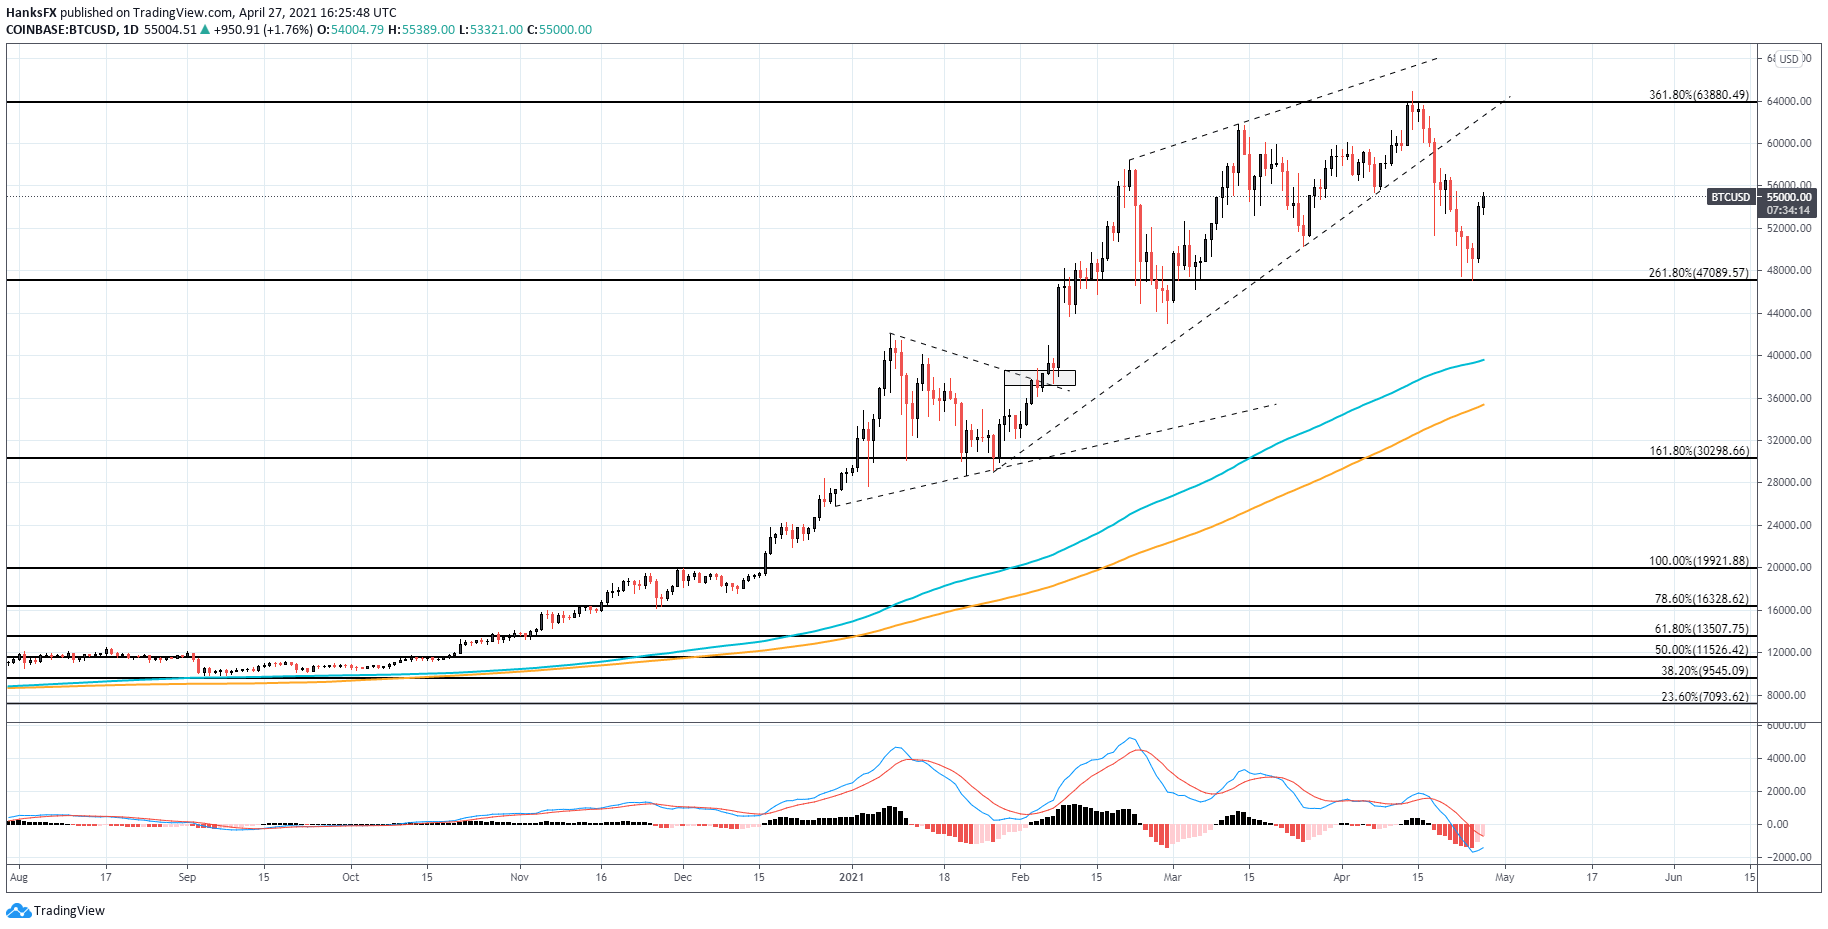
Bitcoin (BTC/USD) Price Chart: Daily Time Frame (August 2020 – April 2021)
Chart created in TradingView
With robust risk appetite across the cryptocurrency world, bulls were eager to sweep in and gain exposure to BTC when it traded at its lowest levels since early March. The uptick in demand conveniently coincided with the 261.80% Fibonacci extension derived from the coin’s 2017 high to its 2018 low while the recent peak near $65,000 aligned with the 361.80% extension.
As a result, Bitcoin currently trades between these two Fibonacci boundaries and could look to derive influence from them again in the future. Despite the substantial volatility on display recently, Bitcoin may also run the risk of becoming range-bound alongside seasonal declines in volatility elsewhere.
Bitcoin (BTC/USD) Price Chart: 4 – Hour Time Frame (January 2021 – April 2021)
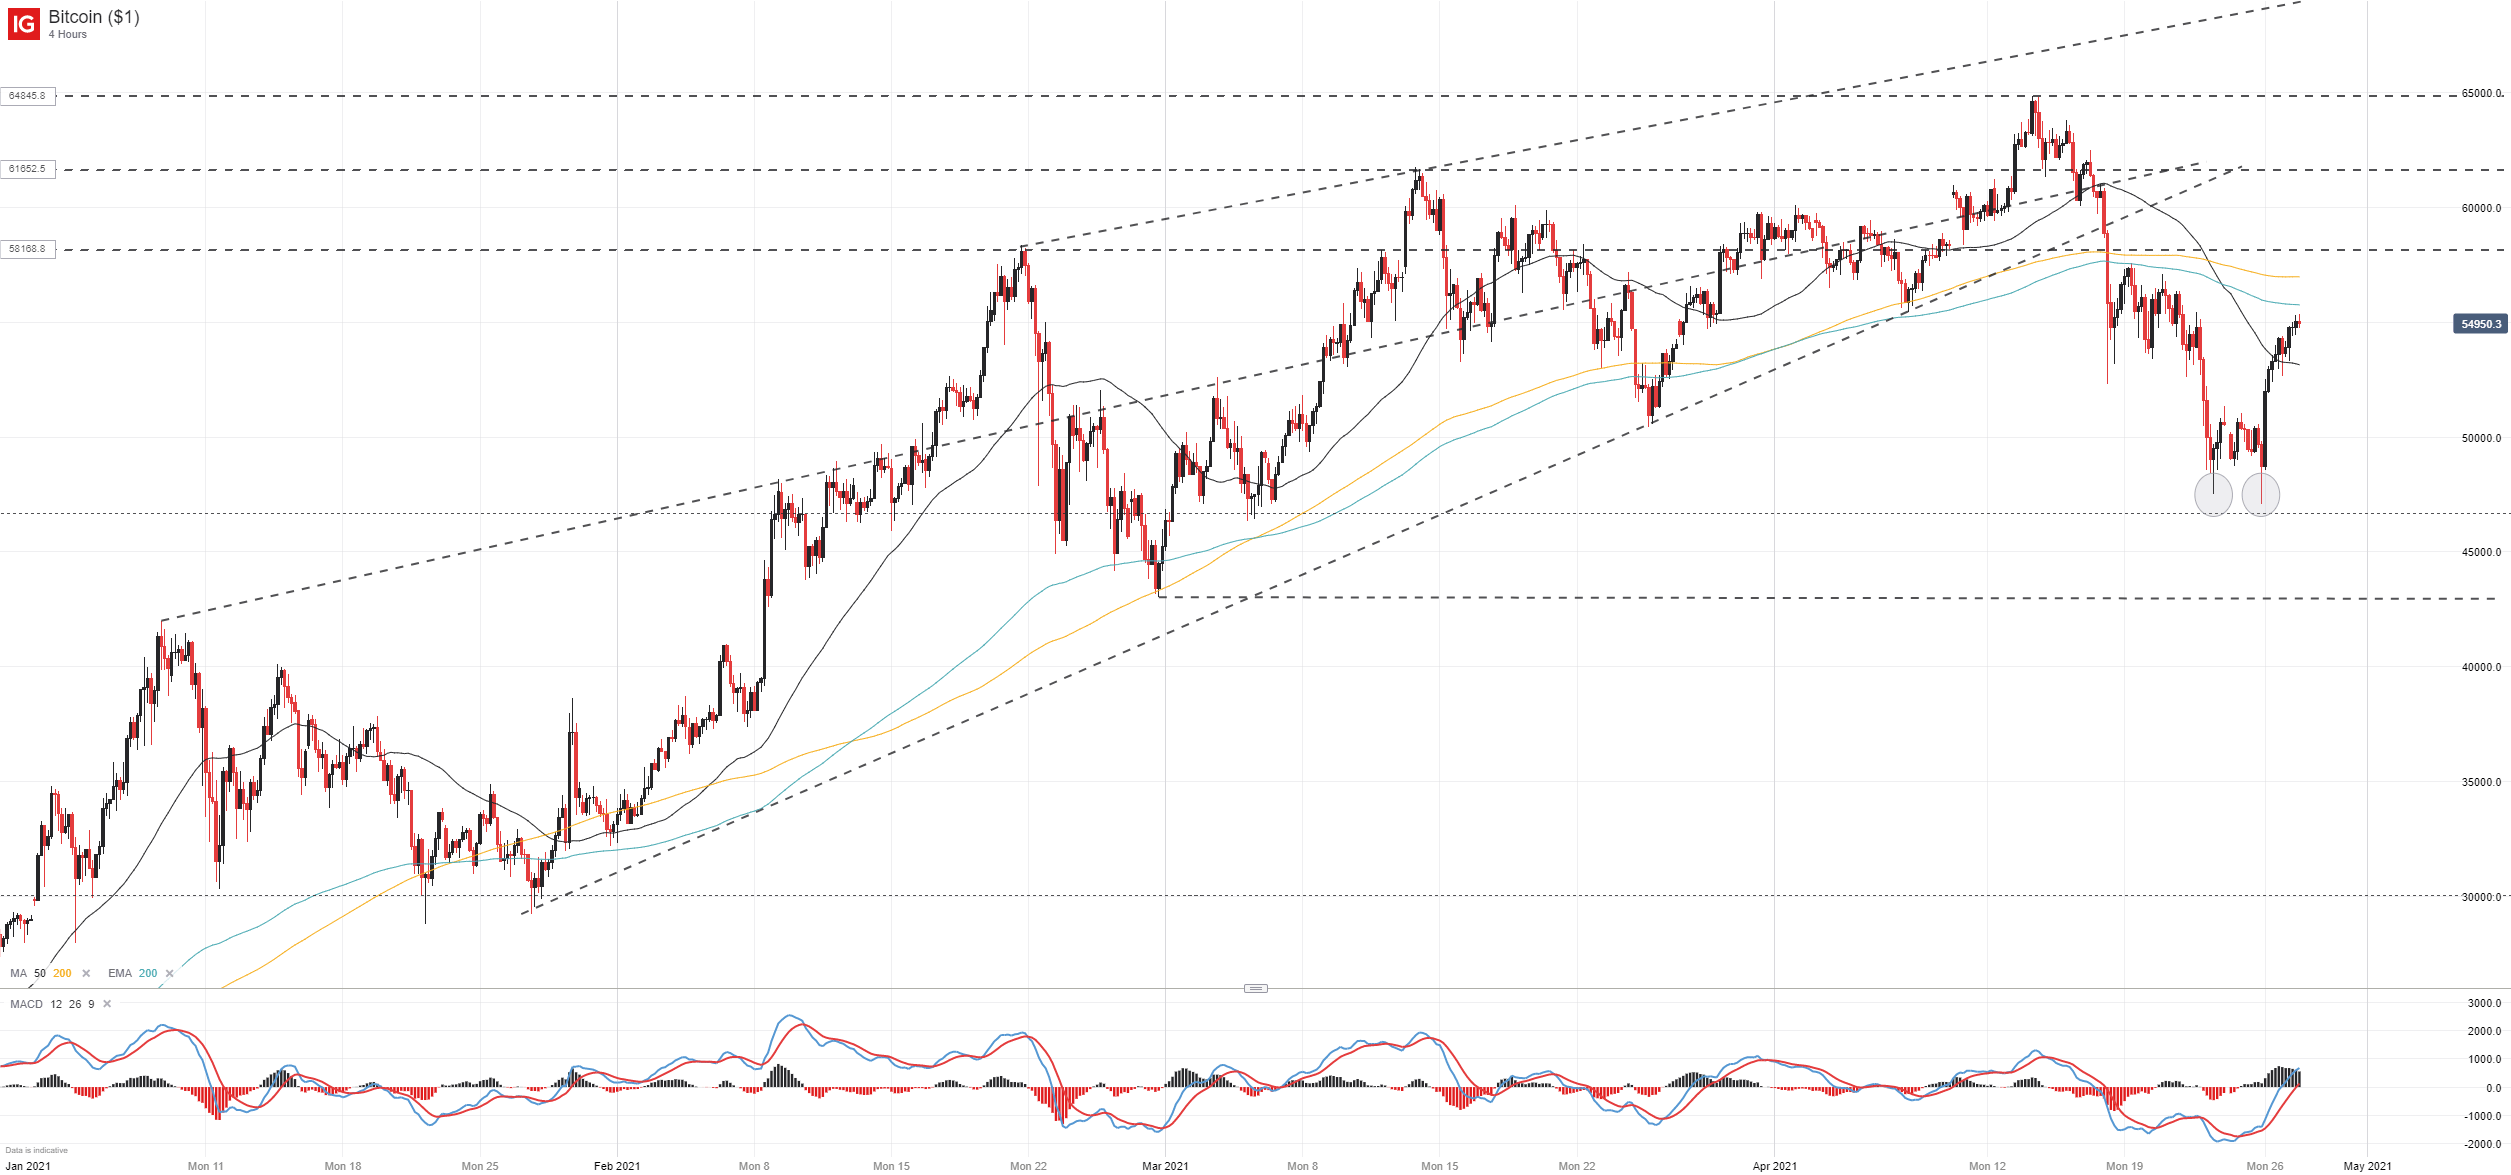
Either way, the shorter-term technical picture is uncertain. Price action around Fibonacci support allowed for the creation of a double bottom formation – a pattern typically viewed as bullish– which was followed by a quick surge to the $55,000 level. With the neckline of the double bottom pattern surpassed, however, bullishness has slowed and Bitcoin will now look to stave of a reversal lower.

Recommended by Peter Hanks
Get Your Free Introduction To Bitcoin Trading
If Bitcoin bulls can hold on to recent gains the longer-term uptrend might remain intact but the precipitous breakdown beneath the January-derived trendline is a worrisome development to be sure. To that end, avoiding a lower-low beneath Fibonacci support is crucial for the longer-term technical outlook at this stage. If such a breakdown did occur, subsequent support might be offered by the coin’s February low near $43,000, but volatile price action might render the level obsolete before it can stall a decline.
Starts in:
Live now:
Apr 28
( 15:04 GMT )

Recommended by Peter Hanks
Weekly Stock Market Outlook
In the meantime, Bitcoin will look to continue its recent recovery rally as it takes aim at potential resistance overhead. Early barriers to a continuation rally might reside along the series of swing highs developed over the last few months near $58,170, $61,650 and its all-time high near the $65,000 mark. Keep up to date on recent price developments and analysis using Twitter by following @PeterHanksFX.
–Written by Peter Hanks, Strategist for DailyFX.com
Contact and follow Peter on Twitter @PeterHanksFX
Be the first to comment