

Bitcoin Talking Points:
- Bitcoin prices trade flat as zone of consolidation firms
- BTC/USD struggles to break out of the current range but hold long can this last?
- Support and resistance remain between key technical levels of historic moves
Recommended by Tammy Da Costa
Get Your Free Bitcoin Forecast
Bitcoin Price Action
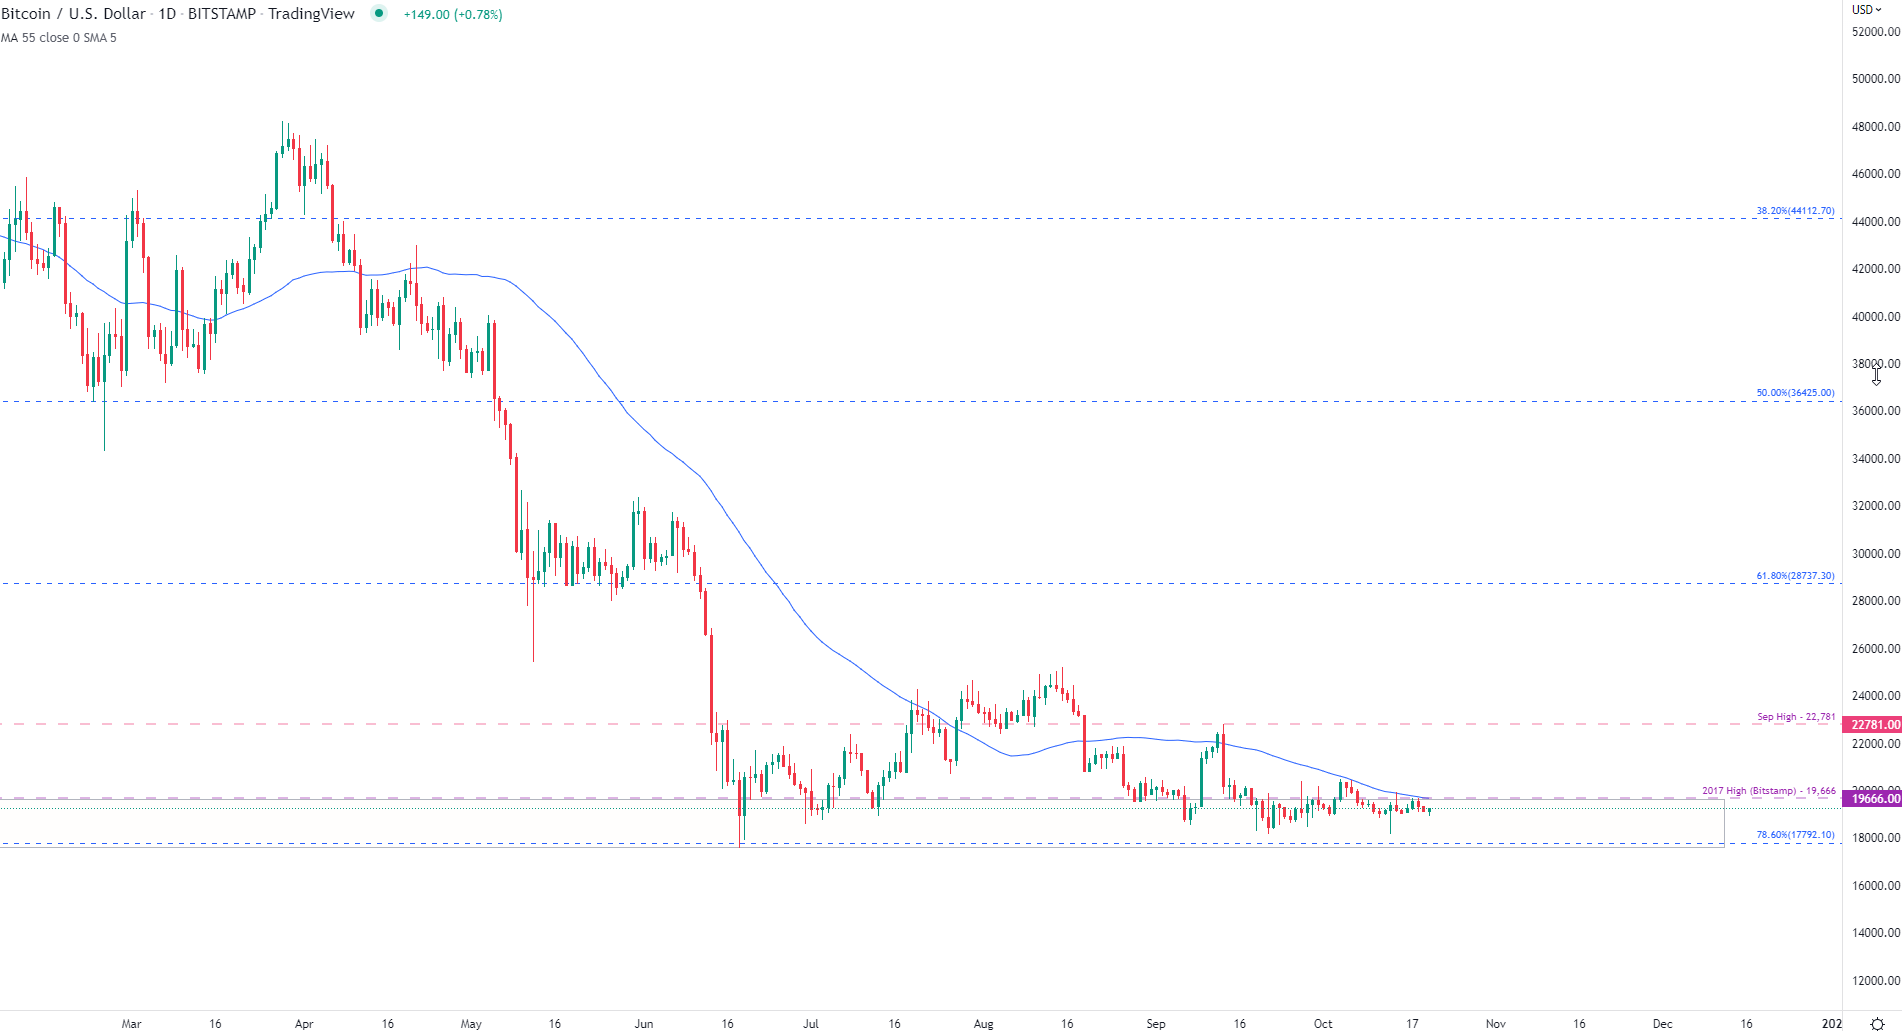
Bitcoin price action currently remains muted as key levels continue to provide firm barriers of technical support and resistance between 17,792 (the 78.6% Fibonacci retracement of the 2020 – 2021 move) and 19,666 (Dec 2017 high). With the daily range fluctuating between 18,183 and 19,280 (at the time of writing), BTC/USD has some big levels to clear before bulls can move higher.
Bitcoin Daily Chart
Chart prepared by Tammy Da Costa using TradingView
Recommended by Tammy Da Costa
The Fundamentals of Range Trading
Bitcoin (BTC/USD) Fundamentals
During a period where rampant inflation remains the primary concern for central banks, rising interest rates are likely to persist well into next year. While the Federal Reserve continues to reiterate their intentions to reduce price pressures through quantitative tightening (a policy implemented by central banks to increase interest rates and reduce money supply to tame inflation), stocks and cryptocurrency remain vulnerable to fundamental factors that continue to drive sentiment.
As focus shifts to the release of company earnings and to the Fedspeak schedule, market participants are expecting the Fed to raise rates by a minimum of 75-bps in November, supporting the safe-haven Dollar.
Fedspeak Calendar (Prepared by Brendan Fagan)

Brendan Fagan discusses this week’s Fedspeak Schedule and what it means for markets
Although stocks have recently experienced elevated volatility and whipsaw price action, BTC/USD remains subdued, raising the probability of a breakout if either bulls or bears manage to gain traction.
Bitcoin Key Levels
| Support | Resistance |
|---|---|
| 19,000 (Psychological Level) | 19,671 (55-Day MA) |
| 18,293 (Monthly Low) | 20,465.75 (Monthly High) |
| 17,597.9 (June/Yearly Low) | 22,781 (September High) |
— Written by Tammy Da Costa, Analyst for DailyFX.com
Contact and follow Tammy on Twitter: @Tams707
Be the first to comment