BTC/USD PRICE OUTLOOK: BITCOIN RECEDES FROM RECORD HIGH, RSI DIVERGENCE IN FOCUS
- Bitcoin exploded past $60,000 over the weekend to hit a fresh record high
- BTC/USD price action has since pivoted lower with its relative strength index
- Crypto outlook seems juxtaposed by stimulus checks and surging real yields
- Visit the DailyFX Education Center to sharpen your technical analysis skills!
Bitcoin (BTC/USD) has been on a tear higher since bottoming out around $45,000 at the end of February. In fact, the popular cryptocurrency extended to a new record this past weekend after spiking above the $60,000-price level. It is likely not a coincidence that Bitcoin saw strength at the same time retail investors were receiving their latest round of stimulus checks. BTC/USD price action now looks like it is starting to recoil lower, however.
This could follow traders unwinding exposure ahead of high-impact event risk posed by the upcoming Fed meeting. Though the Federal Reserve is unlikely to weigh in on Bitcoin specifically, the central bank stands to move the needle for the US Dollar and real yields, which could indirectly impact appetite for speculative assets such as crypto. BTC/USD might face more selling pressure, for example, if the US Dollar strengthens further alongside another sharp move higher in real yields.

Recommended by Rich Dvorak
Trading Forex News: The Strategy
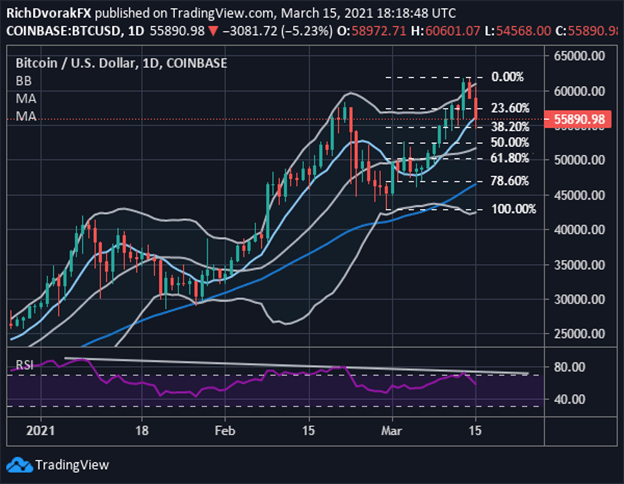
BTC/USD – BITCOIN PRICE CHART: DAILY TIME FRAME (27 DEC 2020 TO 15 MAR 2021)
Chart by @RichDvorakFX created using TradingView
Looking at a daily Bitcoin chart we can see that BTC/USD price action has already probed the 38.2% Fibonacci retracement level of its latest bullish leg. This is an area of confluent support roughly coinciding with February highs and its 8-day simple moving average. A breakdown of this technical zone around the $55,000-price level could see a deeper pullback come into play. If so, the 20-day and 50-day simple moving averages might serve as the next layers of defense. To that end, a continuation of negative divergence on the relative strength index stands out as an encouraging technical development for Bitcoin bears.


Recommended by Rich Dvorak
Get Your Free Top Trading Opportunities Forecast
— Written by Rich Dvorak, Analyst for DailyFX.com
Connect with @RichDvorakFX on Twitter for real-time market insight


Be the first to comment