

Marcus Lindstrom
(Please note that all currency references are to the U.S. dollar except if indicated otherwise. The analysis of Brookfield Infrastructure Partners can equally be applied to Brookfield Infrastructure Corporation.)
Brookfield Infrastructure Partners L.P. (NYSE:BIP) and Brookfield Infrastructure Corporation $33.03 and $39.2 (NYSE symbols BIP and BIPC; Toronto symbols BIP.UN and BIPC) hold a global portfolio of actively managed infrastructure assets. Brookfield Infrastructure Partners (“BIP”) has a solid track record of growing its asset base and generating attractive returns for its unitholders. In addition, its portfolio of secure, cash flow generating assets is well-positioned to provide stability in the current market environment.
Our main concerns are the potential for conflicts of interest with competing infrastructure funds in the Brookfield stable as well as the significant service fees paid to its service provider, Brookfield Asset Management. The valuation is reasonable and in line with other entities that own and operate similar infrastructure assets.
A word on the corporate structure
Brookfield Infrastructure Partners LP is registered in Bermuda and started trading on the NYSE in January 2008 and in Toronto in September 2009. The units have been subdivided on a three-for-two basis in June 2022 and also in September 2016.
In addition to the partnership units, investors can also choose to invest in the ordinary shares of Brookfield Infrastructure Corporation (symbol BIPC on both exchanges). These shares have the same economic value as the partnership units and pay the same dividend per unit.
Brookfield Asset Management (“BAM”) holds a 27.2% economic interest in the partnership and is the sole shareholder of the general partner. BAM is also the effective counterparty to a service agreement with BIP – under this agreement BAM provides management, advisory, and secretarial services to BIP.
An enviable portfolio of infrastructure assets
BIP owns a global portfolio of infrastructure assets that include utilities, transport systems, midstream energy infrastructure, and data transmission and storage assets.
The BIP portfolio is well-diversified geographically and across asset classes, which breaks down into four main divisions:
- Utilities: Regulated transmission and distribution assets in North and South America, Europe, India, and Asia Pacific. Assets include 5,300 km of transmission lines and 7.3 million electricity and gas connections.
- Transport: Operations in North and South America, Europe, the U.K., Australia, and India including 3,800 km of toll roads, 11 port terminals, and 32,300 km of railroads.
- Midstream: Including 15,000 km of natural gas transmission pipelines, 600 Bcf of natural gas storage facilities, and 17 natural gas and natural gas liquids processing plants located in Canada and the U.S.
- Data and communications: Assets include 162,100 telecom towers, 22,000 km of fiber optic cable, and 52 data centers in India, Europe, Brazil, Asia Pacific, and the U.K.
Based on the funds from operations (that is net income adjusted for non-cash items such as depreciation and deferred tax) received from the various regions over the past 12 months, North America contributed 43% of the total, followed by Asia Pacific (20%), South America (19%), and Europe (18%).
Midstream assets made the largest contribution (30% of funds from operations – “FFO”), followed by Utilities (30%), Transport (30%), and Data and Communications (10%).
Importantly, 90% of the cash flow from the operating businesses is regulated or contracted, which provides stability to the income stream while 70% of the cash flows are indexed to inflation.
BIP uses local currency debt financing where possible to minimize currency mismatching. It also uses derivative instruments to hedge its expected non-U.S. dollar FFO. Due to the hedging program, around 82% of the FFO is effectively generated in the U.S. dollar and the balance in Brazilian real. The negative effect of the currently strong U.S. dollar is therefore largely neutralized on the financial results of the company.
An excellent track record since the listing
Brookfield has fared well over the past decade with funds from operations per unit growing by 10.5% per year while the distributions per unit increased by 9.1% per year. Over the past 5 years, the growth slowed to 6.5% and 6.9%, respectively.
The stock has performed very well over the past decade with a total return per unit of 15.8% per year. This compares well with the 11.9% annual return of the S&P 500.
Moderate growth expectations
The BIP growth model centers on the acquisition of desirable assets, the active management of these assets (including investments in upgrades and expansion), the extraction of regular cash flows, and the sale of assets at hopefully attractive prices. BIP often invests alongside partners including affiliates of BAM and other institutional asset managers.
Desirable assets as per the BIP playbook should have stable, contracted, and growing revenues, generate ample cash flow, have high barriers to entry, are long-term in nature, and offer opportunities for ongoing expansion.
The financial objective of BIP is to generate a total return of 12-15% per year on the infrastructure investments in the portfolio. Another publicly stated target is to grow funds from operations per unit by 6%-9% per year.
BIP actively rotates assets in the portfolio by replacing mature or stagnant assets with better growth prospects. The current annual investment target is $1.5 billion. In 2021 BIP spent over $3 billion including the Canadian midstream business, Inter Pipeline while assets worth $2 billion were sold. The current year is also looking strong with new acquisitions totaling $2.8 billion while $2.4 billion has been realized in asset sales.
Large current-year acquisitions include Uniti Group (Australian telecom services), HomeServe (North America and European home infrastructure repair services), and Deutsche Funkturm (European portfolio of 36,000 telecom towers). BIP also recently agreed to invest up to $15 billion for a 49% stake in a semi-conductor facility in Arizona developed by Intel (INTC).
At the most recent investor day on 29 September, BIP discussed the attractive prospects for infrastructure developments across the globe. In summary:
- Governments in the developed world carry high debt loads and will increasingly need private capital for large-scale projects. The ambitious $1.2 trillion U.S. infrastructure plan is a case in point
- The global decarbonization efforts underway will require more efficient energy infrastructure· Deglobalization will drive “onshoring” with an increased demand for domestic transport infrastructure and
- High levels of demand for Infrastructure to accommodate an explosion in the growth of digital data; this includes fiber networks, wireless infrastructure, and data centers. BIP estimates that $1 trillion will be required over the next 5 years to upgrade data infrastructure globally.
The balance sheet carries loads of debt but it should be manageable
At the end of June 2022, BIP had proportionate net debt of $19.4 billion of which $3.1 billion was held at the corporate level. The balance was held at the operating company level with no recourse to BIP.
About 90% of the debt carries a fixed rate while less than 10% of the debt matures in 2022-23 with 55% maturing after 2026.
At the end of June, the proportionate net debt to capital ratio was 39% and the weighted average interest rate was 4.9% for all the debt combined. Interest cost was covered 3.9 times by EBITDA.
BIP has an investment grade credit rating of BBB+ from S&P.
The corporate structure creates the potential for conflicts of interest
As explained above, BAM effectively acts as the general partner and the service provider. These arrangements provide BAM with significant influence over the operations of the partnership. This may create the potential for conflicts of interest.
In the BAM stable are several private and closed-end funds that can co-invest with BIP on large infrastructure transactions. While it can be useful to have friendly co-investors it can also create conflicts of interest as the most attractive opportunities may not land with BIP but rather get allocated to other infrastructure funds.
As the service provider, BAM earns fees for its services, which include deal sourcing and structuring and the monitoring of the investments. A Master Services Agreement allows BAM to collect a base management fee of 1.25% per annum of the market value of BIP plus third-party net recourse debt. BAM also collects an incentive distribution of up to 25% of quarterly distributions that exceed $0.1827 per unit.
The fees generally incentivize BAM to grow the value of BIP as well as the dividends. In 2021 the base management fee amounted to $394 million while the incentive fee was $206 million for a total of $600 million. This was the equivalent of 35% of the 2021 FFO or 1.2% of the enterprise value at the end of last year. While these fees may be in line with fees charged by private equity vehicles, it does provide a drag on the profits of the business.
Nevertheless, BAM is a highly reputable global asset manager with a successful long-term track record managing portfolios of real estate, infrastructure, and energy assets. BAM also holds around 27% of the units in Brookfield which to some extent creates an alignment of interests with other investors.
Distributions are growing
BIP pays a quarterly distribution that is expected to amount to $1.44 for 2022. Since 2012, the distribution has compounded at an annual rate of 9.1% although the growth rate dropped to 6.5% over the last 5 years.
BIP targets a distribution growing at 5%-9% per year with a payout ratio of between 60-70% of the FFO. The average payout ratio for the past decade was 70% although it exceeded the upper band of the target range in each of the past 4 years and also in the first six months of 2022 (note that the dividend used in the payout ratio calculation also includes the incentive payment to the service provider as well as the preference share payments and interest on perpetual notes).
Fair valuation
Consensus estimates indicate that BIP will continue to grow its FFO/unit slightly above the historical norms for the next few years. The dividend per unit growth is in line with the 5-year average.
Growth estimates (Eikon)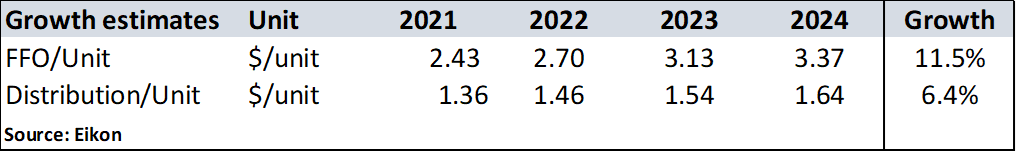
Based on these forecasts, the valuation multiples are calculated as per the table below. When compared to listed railroads, utilities, midstream, and cellular towers, the EV/EBITDA multiples are slightly higher than the average of these entities. The dividend yield is equal to the average of the peers.
Valuations (Eikon)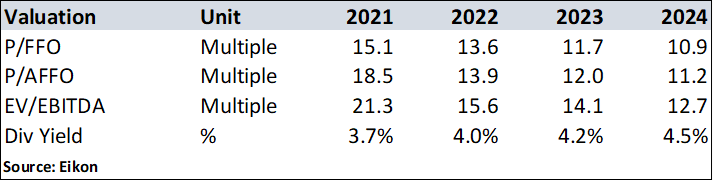
The huge gap between the price of the partnership units and the shares of the corporation
In theory, the BIP units and the BIPC Class A shares have the same economic value and both pay the same distribution – currently $0.36 per quarter. However, BIPC shares at present trade at a 16% premium to the BIP units.
At the time of the creation of BIPC, the CEO of BIP said that “the transaction was analogous to a unit split as the transaction did not result in any underlying change to cash flows or net asset value….”. But he also mentioned that the BIPC units may appeal to investors that cannot hold partnership units, and provide broader index inclusion and tax benefits to some investors. This probably explains the premium ascribed to the BIPC shares.
By Deon Vernooy, CFA, for TSI Wealth Network
Be the first to comment