

Justin Sullivan
By The Valuentum Team
Broadcom Inc. (NASDAQ:AVGO) is a nice income generation opportunity that also possesses some capital appreciation upside as well. The company has exposure to numerous secular growth tailwinds in the realm of 5G, the Internet of Things [‘IoT’] trend, the proliferation of cloud-computing and data centers, rising cybersecurity needs, and more. In turn, these secular tailwinds along with Broadcom’s pivot towards providing infrastructure software offerings underpin a bright long-term growth runway that should enable Broadcom to steadily grow its payout going forward. Broadcom’s core semiconductor business has been firing on all-cylinders in recent years, and shares of AVGO yield a nice ~3.3% as of this writing.
Broadcom’s Key Investment Considerations
Image Source: Valuentum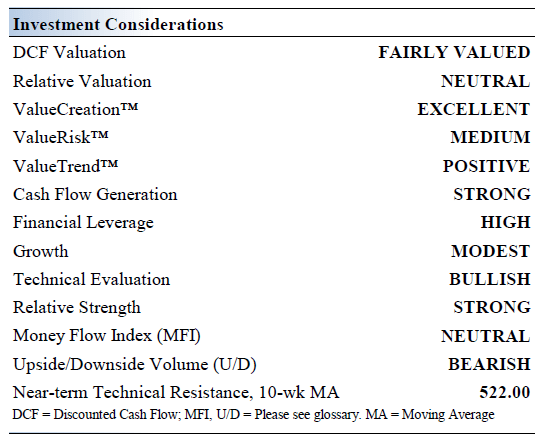
Broadcom is a leading diversified communications semiconductor and infrastructure software company with a broad portfolio of category-leading franchises. It serves markets in China, the US, Singapore, among others across the globe. The company is headquartered in Singapore and has a long history, with some of its divisions tracing their roots to the 1960s.
Please note that Broadcom is highly acquisitive and future deals are likely. In November 2017, Broadcom acquired Brocade in an all-cash deal worth ~$5.9 billion when including net debt. In November 2018, Broadcom purchased of CA Tech through a ~$18.4 billion deal by enterprise value. Broadcom acquired the ‘Enterprise Security’ business from then-Symantec in November 2019 for ~$10.7 billion in cash. For reference, Symantec has since rebranded its corporate name to NortonLifeLock Inc. (NLOK).
Broadcom is currently working towards acquiring VMware Inc. (VMW) through a ~$61 billion cash-and-stock deal announced in May 2022 that involves Broadcom taking on VMware’s net debt load (~$8 billion at the time the deal was announced). We like the acquisition as it will enable Broadcom to continue scaling up its infrastructure software business.
Shareholders of VMware have the option to receive either $142.50 in cash or 0.252 share of Broadcom for each share of VMware they own. The deal is structured so that Broadcom will pay ~50% in cash and ~50% in stock, and shareholder elections are subject to proration in order to make that the case. If the deal goes through as planned, Broadcom notes that existing AVGO shareholders will own ~88% of the combined company’s equity and VMW shareholders will own the remaining ~12%. The boards of directors of both companies have already unanimously approved the deal.
Furthermore, this pending acquisition includes a $1.5 billion termination fee that could be paid by either Broadcom (should regulatory hurdles prevent the deal from proceeding, among other factors) or VMware (should a better offer materialize from a different party, among other factors), depending on the circumstances. The size of the termination fee also changes depending on when the deal is terminated, particularly as it concerns VMware’s potential termination fee.
These aforementioned acquisitions enabled Broadcom to quickly grow its high-margin infrastructure software business, which should help the firm grow its operating margins over time. Please note that our enterprise cash flow model assumes Broadcom grows its revenues and operating margins significantly over the coming fiscal years (we will cover our enterprise cash flow model for Broadcom in this article).
Broadcom’s capital allocation plan still involves paying ~50% of prior fiscal year’s free cash flow as dividends (even if the VMware deal goes through), the flexibility to use the balance of free cash flow to fund repurchases and acquisitions, and to maintain an investment-grade credit rating. We like management’s commitment to income seeking investors. Please note we define free cash flow as net operating cash flow less capital expenditures.
Earnings Analysis
On September 1, Broadcom reported third quarter results for fiscal 2022 (period ended July 31, 2022) that beat both consensus top- and bottom-line estimates. Its GAAP net revenues rose by 25% year-over-year to reach $8.5 billion with revenue at its ‘semiconductor solutions’ segment up 78% and revenue at its ‘infrastructure software’ segment up 22% in the fiscal third quarter. Economies of scale and declining operating expenses saw Broadcom’s GAAP operating income rise by 76% year-over-year to hit $3.7 billion last fiscal quarter as its GAAP operating margin grew by a whopping ~1,280 basis points to reach 44.2%. Broadcom’s GAAP diluted income came in at $7.15 in the fiscal third quarter, up 70% year-over-year.
At the end of July 2022, Broadcom had $10.0 billion in cash and cash equivalents on hand versus $0.3 billion in short-term debt and $39.2 billion in long-term debt. The company’s ample cash-like assets on hand at the end of this period provides Broadcom with enough liquidity to meet its near term funding needs, before taking the VMware acquisition into account (which would require Broadcom to tap capital markets to fund).
Broadcom’s business model is asset-light and requires relatively modest capital expenditures to maintain a given level of revenues. This in turn supports its free cash flow generating abilities and highlights why we view Broadcom’s cash flow profile favorably. In the fiscal third quarter, Broadcom generated $4.3 billion in free cash flow and spent $1.7 billion covering its dividend obligations along with another $1.5 billion buying back its stock through its share repurchase program.
Looking ahead, Broadcom aims to generate around $8.9 billion in revenue in the current fiscal quarter (up 20% year-over-year). We appreciate its strong performance seen of late and Broadcom’s favorable near term guidance.
Dividend Analysis
Broadcom’s forward-looking dividend coverage is strong, in our view.. (Valuentum)
The Dividend Cushion Ratio Deconstruction, shown in the image up above, reveals the numerator and denominator of the Dividend Cushion ratio. At the core, the larger the numerator, or the healthier a company’s balance sheet and future free cash flow generation, relative to the denominator, or a company’s cash dividend obligations, the more durable the dividend.
The Dividend Cushion Ratio Deconstruction image puts sources of free cash in the context of financial obligations next to expected cash dividend payments over the next 5 years on a side-by-side comparison. Because the Dividend Cushion ratio and many of its components are forward-looking, our dividend evaluation may change upon subsequent updates as future forecasts are altered to reflect new information.
In the context of the Dividend Cushion ratio, Broadcom’s numerator is larger than its denominator, which suggests strong forward-looking dividend coverage. We see room for Broadcom to push through substantial payout increases going forward. However, we caution that Broadcom’s other capital allocation priorities (share buybacks and M&A activity) compete for capital against its dividend program and could weigh on the pace of future payout growth. Its large net debt load represents a major downside risk to its dividend payout, though Broadcom’s stellar cash flow profile should enable it to handle that burden.
Broadcom’s Economic Profit Analysis
The best measure of a firm’s ability to create value for shareholders is expressed by comparing its return on invested capital [‘ROIC’] with its weighted average cost of capital [‘WACC’]. The gap or difference between ROIC and WACC is called the firm’s economic profit spread. Broadcom’s 3-year historical return on invested capital (without goodwill) is 52.4%, which is above the estimate of its cost of capital of 9.1%.
In the chart down below, we show the probable path of ROIC in the years ahead based on the estimated volatility of key drivers behind the measure. The solid grey line reflects the most likely outcome, in our opinion, and represents the scenario that results in our fair value estimate. Broadcom has historically been a solid generator of shareholder value and we forecast that will keep being the case going forward.
Image Source: Valuentum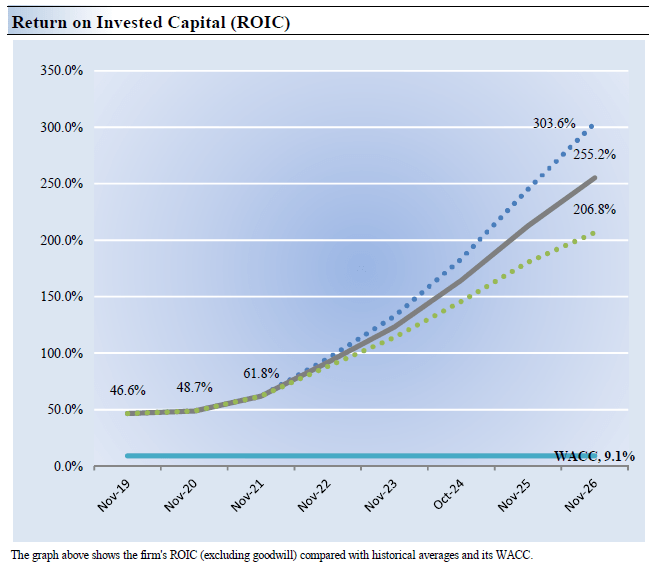
Broadcom’s Cash Flow Valuation Analysis
Image Source: Valuentum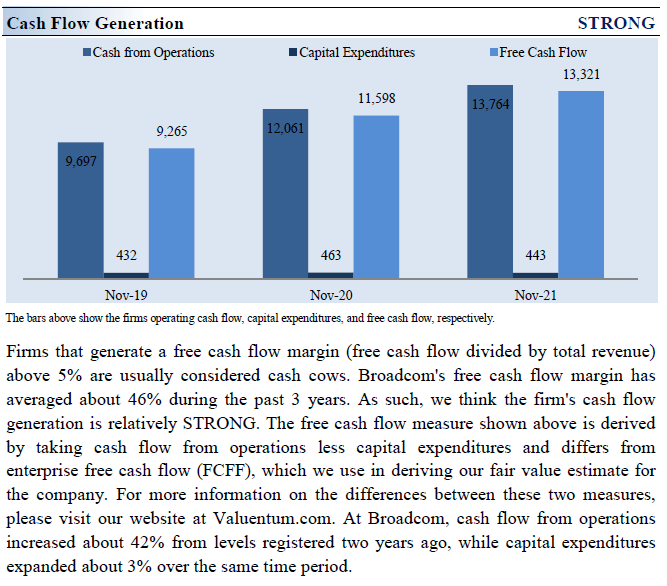
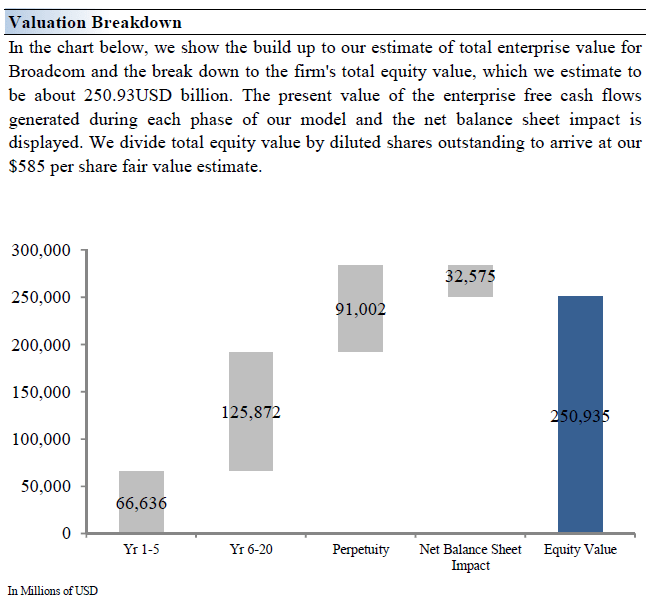
Our discounted cash flow process values each firm on the basis of the present value of all future free cash flows, net of its balance sheet considerations. Please be aware that our enterprise cash flow model assumes Broadcom realizes material operating margin expansion and decent revenue growth over the coming fiscal years, and if the firm should stumble for any reason, its intrinsic value would face serious headwinds. We think Broadcom is worth $585 per share with a fair value range of $439.00 – $731.00.
The near-term operating forecasts used in our enterprise cash flow model, including revenue and earnings, do not differ much from consensus estimates or management guidance. Our model reflects a compound annual revenue growth rate of 8% during the next five years, a pace that is lower than the firm’s 3-year historical compound annual growth rate of 9.6%. Our model reflects a 5-year projected average operating margin of 61.1%, which is above Broadcom’s trailing 3-year average. Beyond Year 5, we assume free cash flow will grow at an annual rate of 3.2% for the next 15 years and 3% in perpetuity. For Broadcom, we use a 9.1% weighted average cost of capital to discount future free cash flows.
Image Source: Valuentum Image Source: Valuentum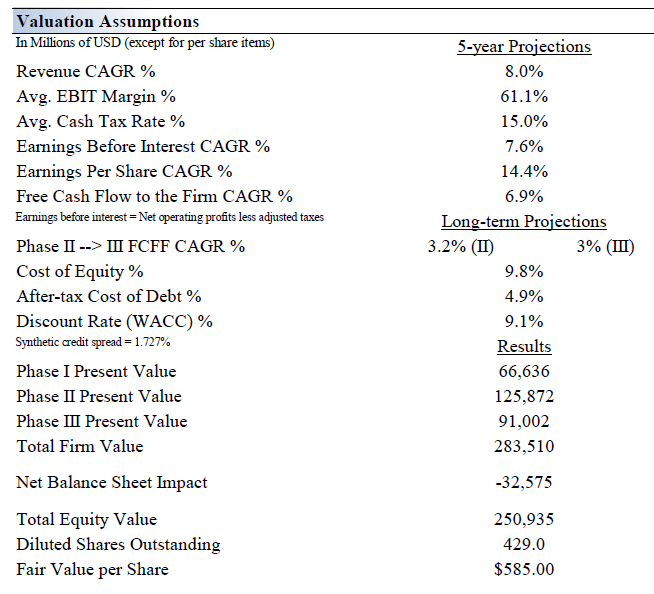
Broadcom’s Margin of Safety Analysis
Image Source: Valuentum
Although we estimate Broadcom’s fair value at about $585 per share, every company has a range of probable fair values that’s created by the uncertainty of key valuation drivers (like future revenue or earnings, for example). After all, if the future were known with certainty, we wouldn’t see much volatility in the markets as stocks would trade precisely at their known fair values.
In the graph up above, we show this probable range of fair values for Broadcom. We think the firm is attractive below $439 per share (the green line), but quite expensive above $731 per share (the red line). The prices that fall along the yellow line, which includes our fair value estimate, represent a reasonable valuation for the firm, in our opinion. Broadcom is trading in the lower bound of our fair value estimate range as of this writing.
Concluding Thoughts
Broadcom’s cash flow profile is stellar and underpins its strong forward-looking dividend coverage. Its semiconductor business remains impressive and its infrastructure software business is steadily growing through a combination of acquisitions and organic growth. Broadcom’s near and long-term growth outlooks are both quite bright.
The biggest weakness in Broadcom’s dividend coverage strength is its large net debt load, a product of its past acquisitions (keeping the pending VMware deal in mind). Recent refinancing activities indicate that Broadcom should be able to continue tapping capital markets at attractive rates, a process made easier by its impressive free cash flow generating abilities. Looking ahead, we forecast that Broadcom will continue growing its per share dividend at a robust pace over the coming fiscal years.
Be the first to comment