

Jonathan Kitchen
Background
Broadcom (NASDAQ:AVGO) is a massive semiconductor and infrastructure software company based in San Jose, California. The $200B+ market cap company operates through several industry-leading brands: Broadcom (semiconductors), LSI (semiconductors and data center software), Brocade (networking hardware and software), CA Technologies (mainframe software) and Symantec (enterprise security software). In 2022, the firm is expected to generate revenue of $33.17B, a 21% increase from 2021. They continually beat earnings estimates, most recently in FQ32022 (July), posting EPS of $9.73, a 24.87% YoY gain in a challenging macro environment. Management reiterated their commitment to returning cash to shareholders in that latest earnings call, paying “stockholders $1.7B of cash dividends [and repurchasing] $1.5B in common stock.”
We’ll first look at the financial statements of the company and their impact on the dividend. We will then cover why, at a price 6% above the current level, we plan to sell AVGO.
Financial Statement Trend Analysis: AVGO
We look for quality securities that either have high yields or that consistently increase their payout at an above average rate. We’re currently following 37 stocks, ETFs and royalty trusts. We analyze, in depth, the financial statement trends and characteristics of these (not the ETFs of course – that relies exclusively on payout growth rate and consistency) to determine quality:
- Free cash flow consistency and growth, return on assets, liquidity and debt trends.
- Dividend growth, safety (coverage by free cash flow), and yield.
In particular, we avoid companies that pay their dividends out of increased debt.
AVGO Free Cash Flow, Return on Assets, Debt
We have a predilection in favor of graphs over words, and for free cash flow, or owner earnings, over GAAP earnings or, the unmentionable EBITDA. EBITDA is a travesty. If you doubt that, look up what Charlie Munger and Warren Buffett have to say.
Here’s the chart of the two crucial measures of business health, free cash flow and return on assets (margins as a percent of sales, sales as a percent of assets).
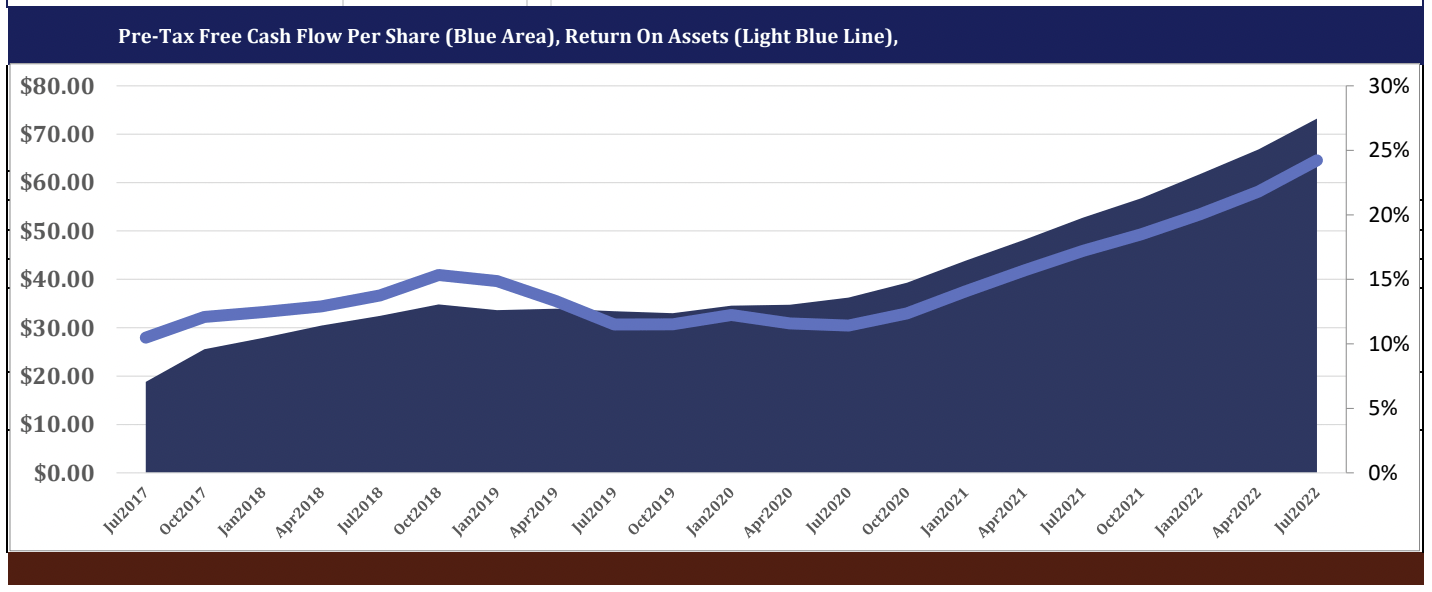
AVGO Free Cash Flow And Return on Assets (www.dividendrisk.com)
Here we focus on the AVGO return on assets analysis. Rising sales in relation to assets (efficiency), risking margins (competitive advantage).
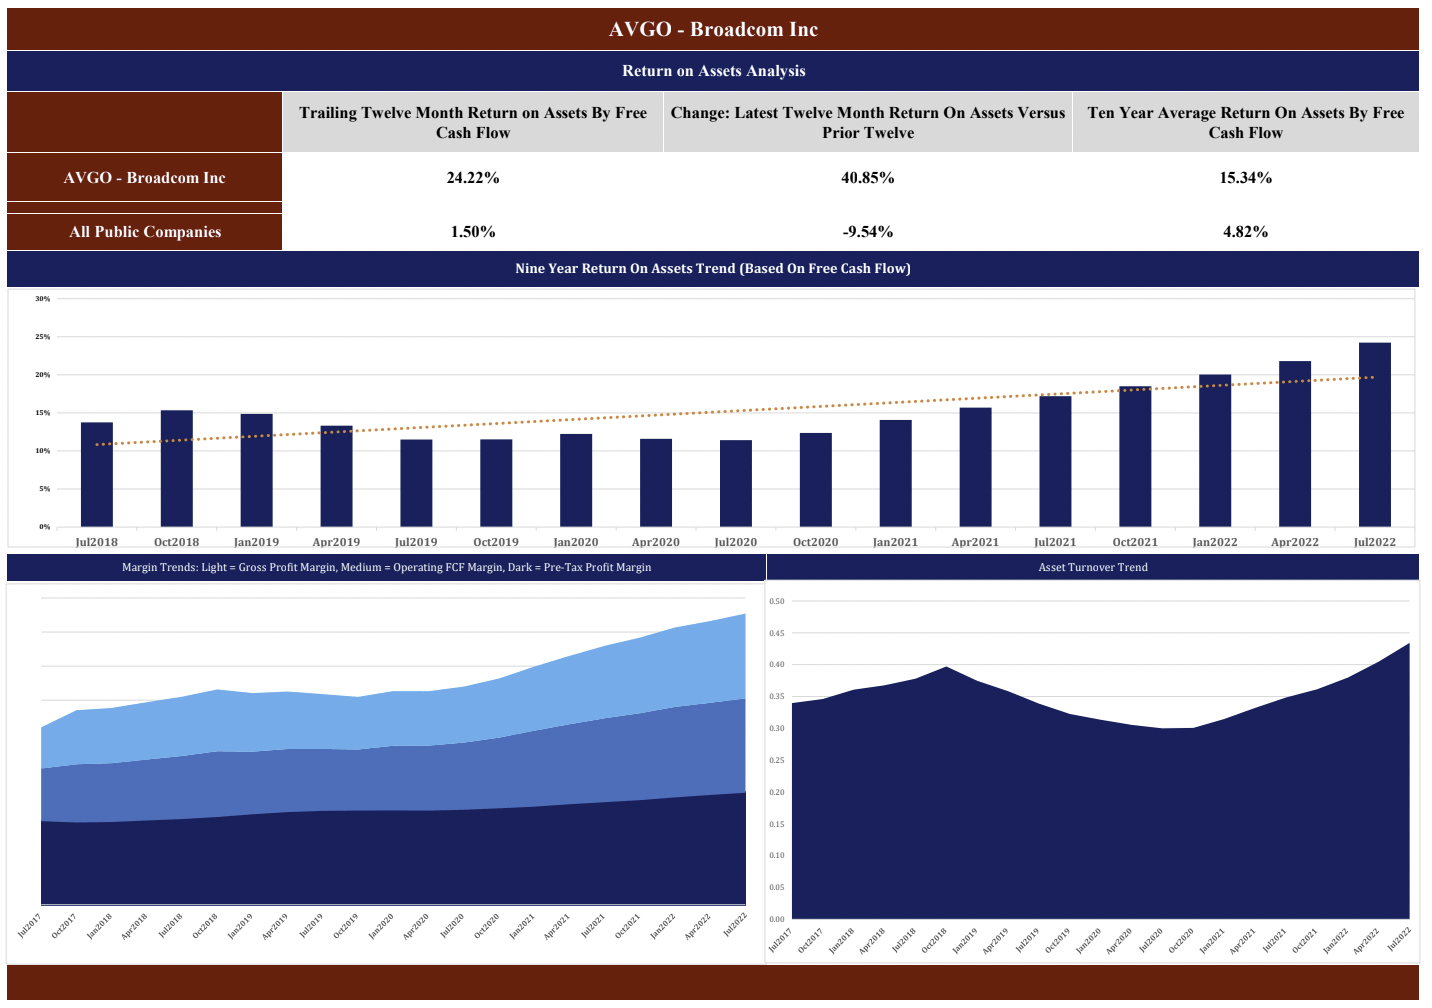
AVGO Return On Assets Analysis (www.dividendrisk.com)
In the most recent quarter, AVGO reported FCF of $4.3B, which represented 51% of revenue. The quarter continued the strong trend of growth in operating FCF, which, on a four-quarter basis, stands at an exceptional 38.86%.
AVGO has continued to pay down debt, which now stands at $39.5B, down from the peak of $41.7B in 2020. The company is conservatively financed with debt at 14.27% of fixed capital. Return on assets bottomed in mid-2020 at 2.88% and has risen consistently to the current 13.47%.
Below, the AVGO’s financial strength trends.
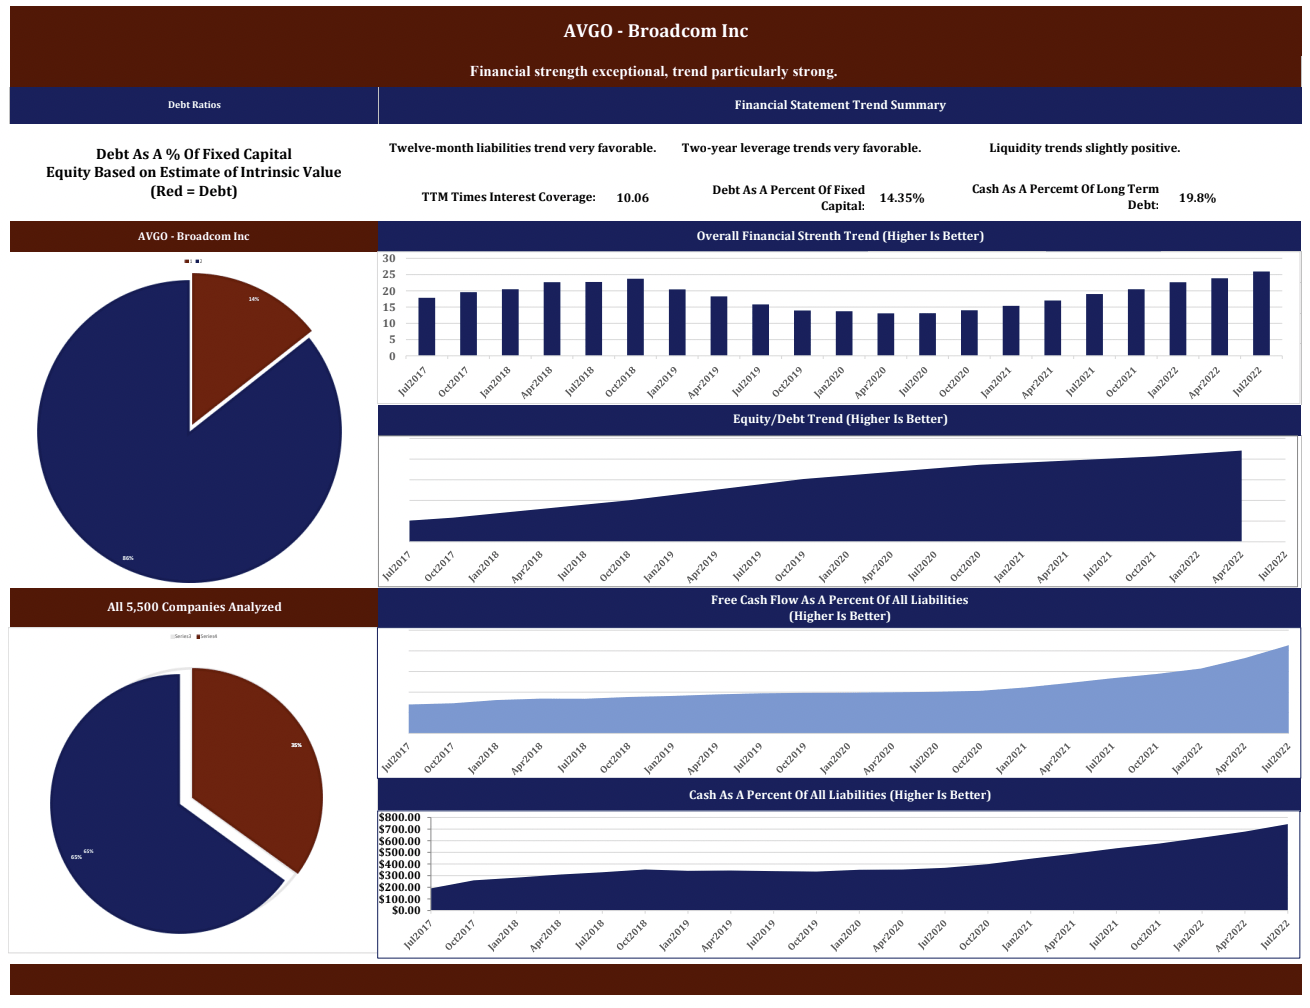
AVGO Financial Strength (www.dividendrisk.com)
Exceptional, both in current situation and trend. Now for profitability:
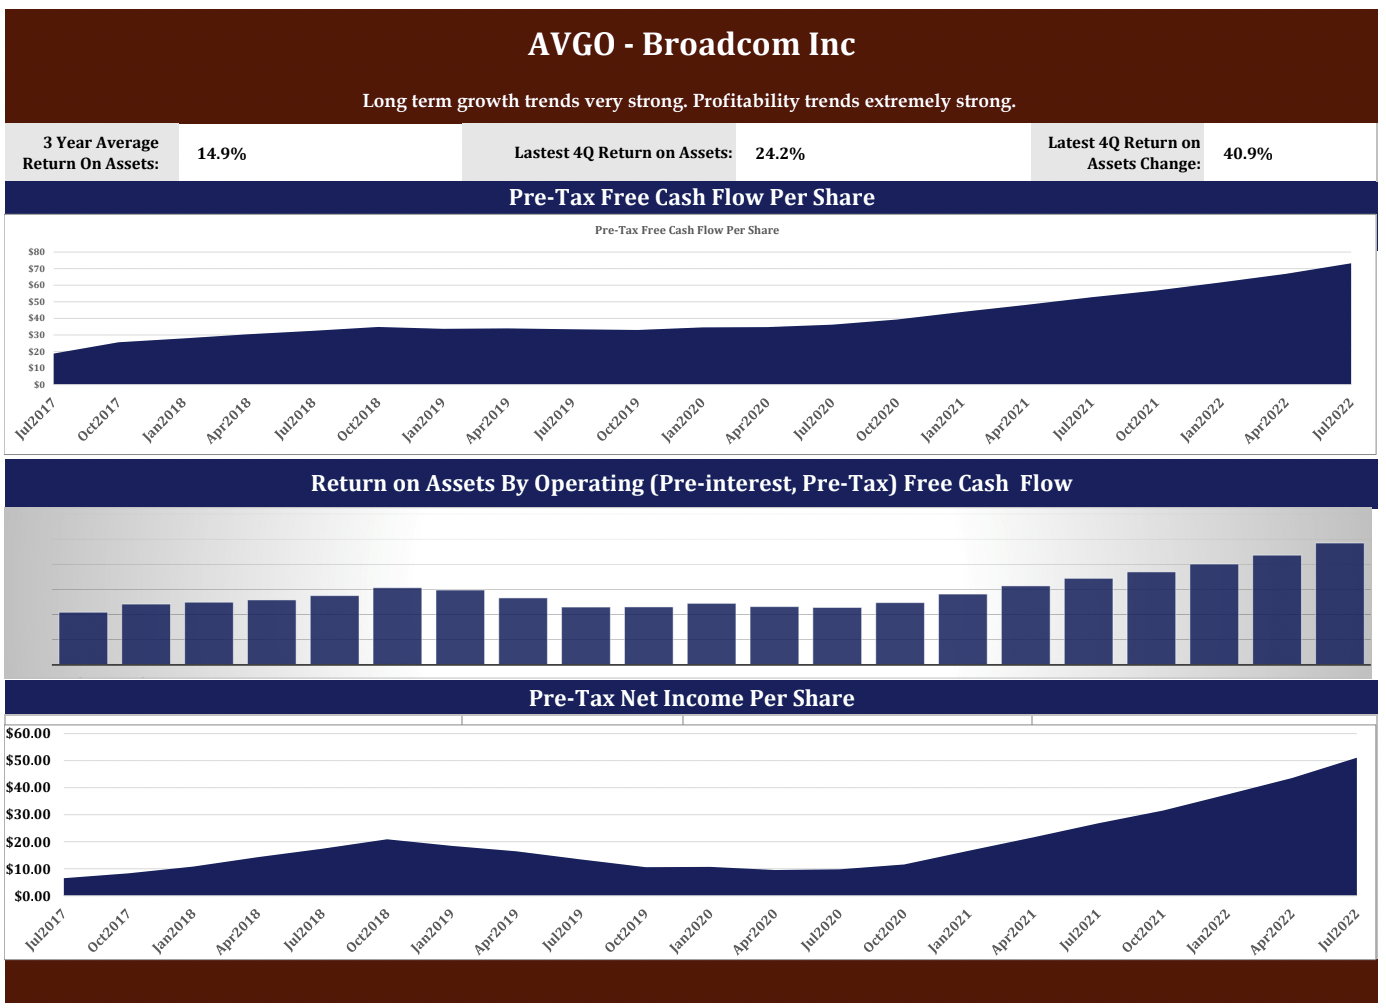
AVGO Profitability Trends (www.dividendrisk.com)
And finally, financial strength and profitability momentum. As someone who looks at hundreds of these a month, AVGO’s recent momentum stands out as one of the strongest in terms of trends we’ve recently come across.
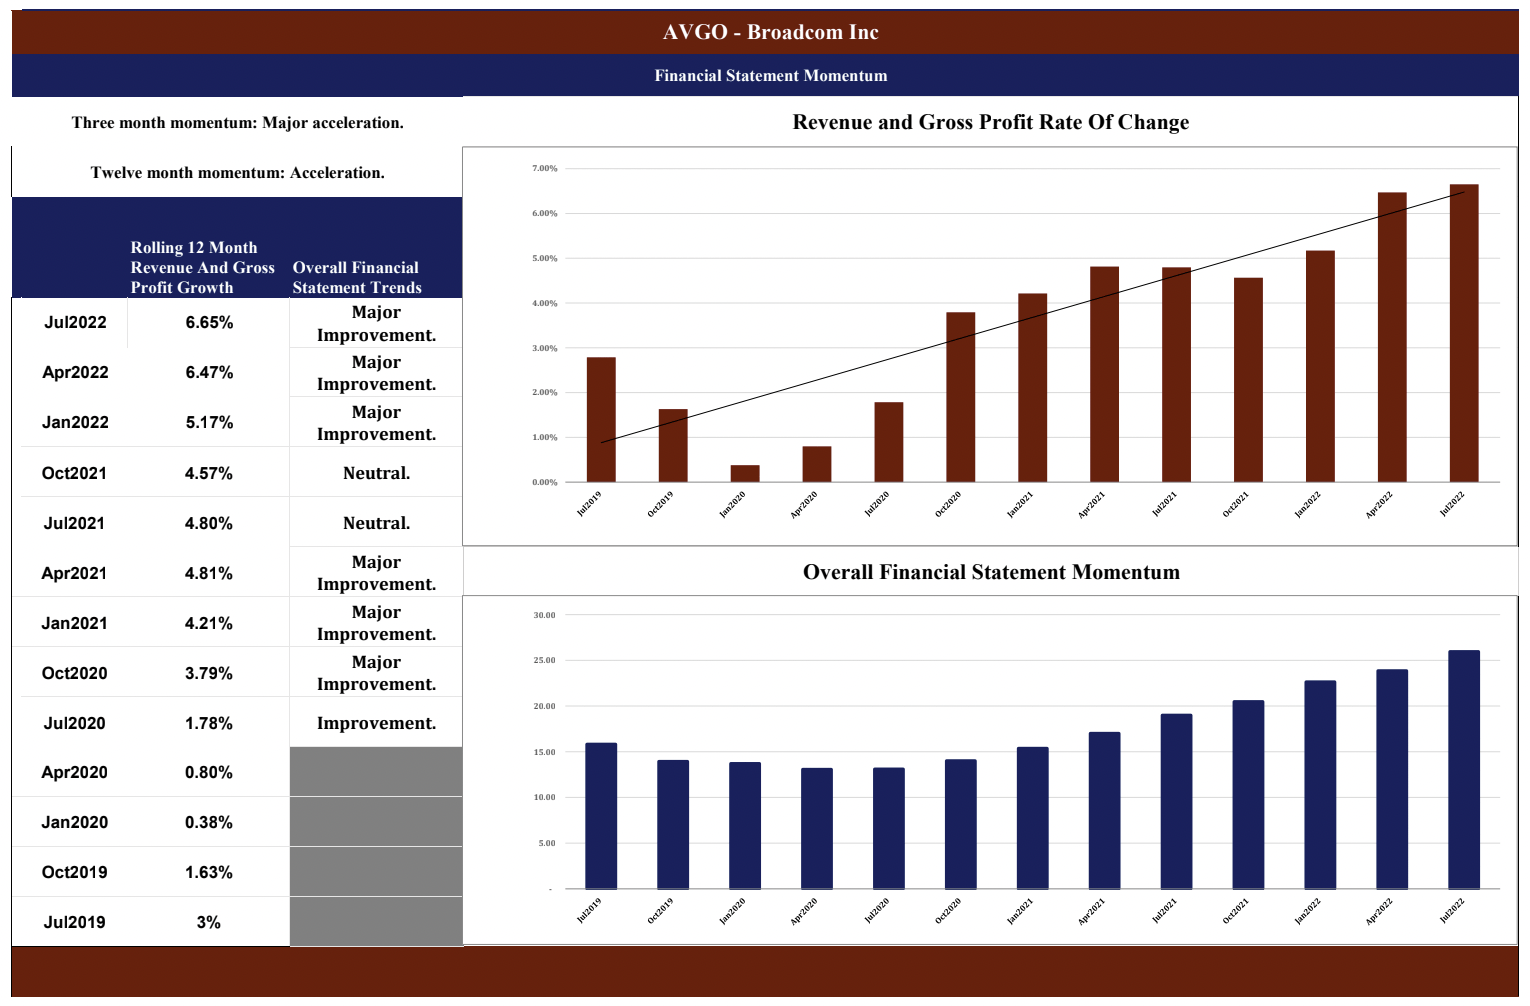
AVGO Overall Financial Statement Momentum (www.dividendrisk.com)
Intrinsic Value
Intrinsic value and related subjects are frequently discussed but rarely understood, at least in terms of significance. I note that Warren Buffett, in a recent annual report, stated that he overestimated the intrinsic value of Precision Castings by $10 billion. If he can’t figure out intrinsic value, we probably can’t either. What’s more important to long term investors is the value a company creates over time.
Regardless, one should probably at least try. We calculate 10-year average stock price to FCF, revenues, dividends and GAAP earnings, and then apply those to TTM FCF, revenues, dividends and GAAP earnings. For Broadcom, this indicates a value of $524/share. Thus, in our opinion, AVGO currently trades at fair value. Below, another page from our financial statement trend analysis:
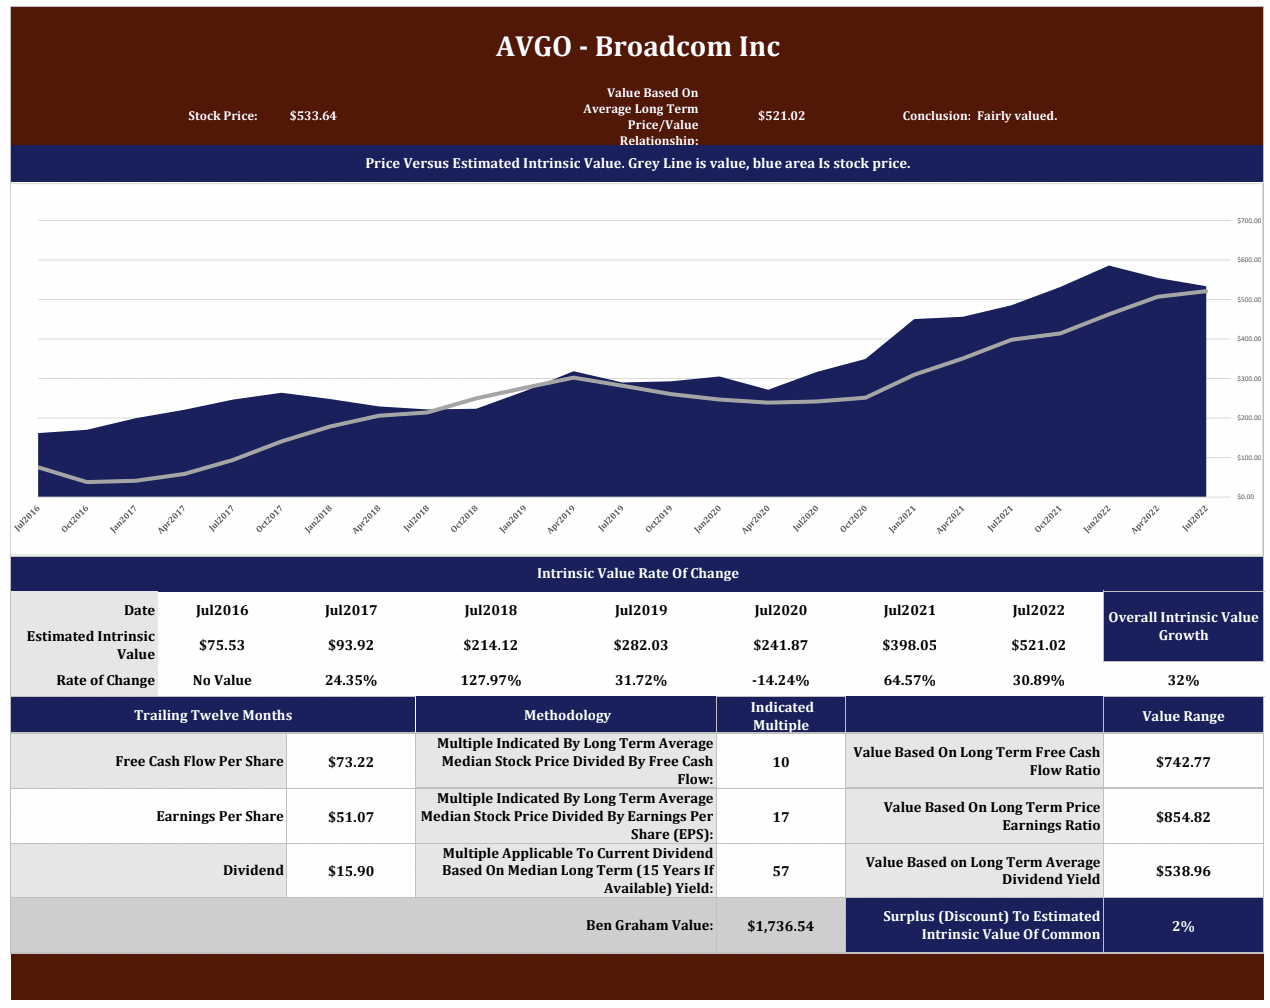
AVGO Intrinsic Value Estimate (www.dividendrisk.com)
The Dividend
Seeking Alpha’s data on AVGO’s dividend growth indicates a CAGR of 43.59% since 2010, and, in the past five years, an annual growth rate of 45.27%. In the last four quarters, it grew YoY by 11.61% to $16.40/share.
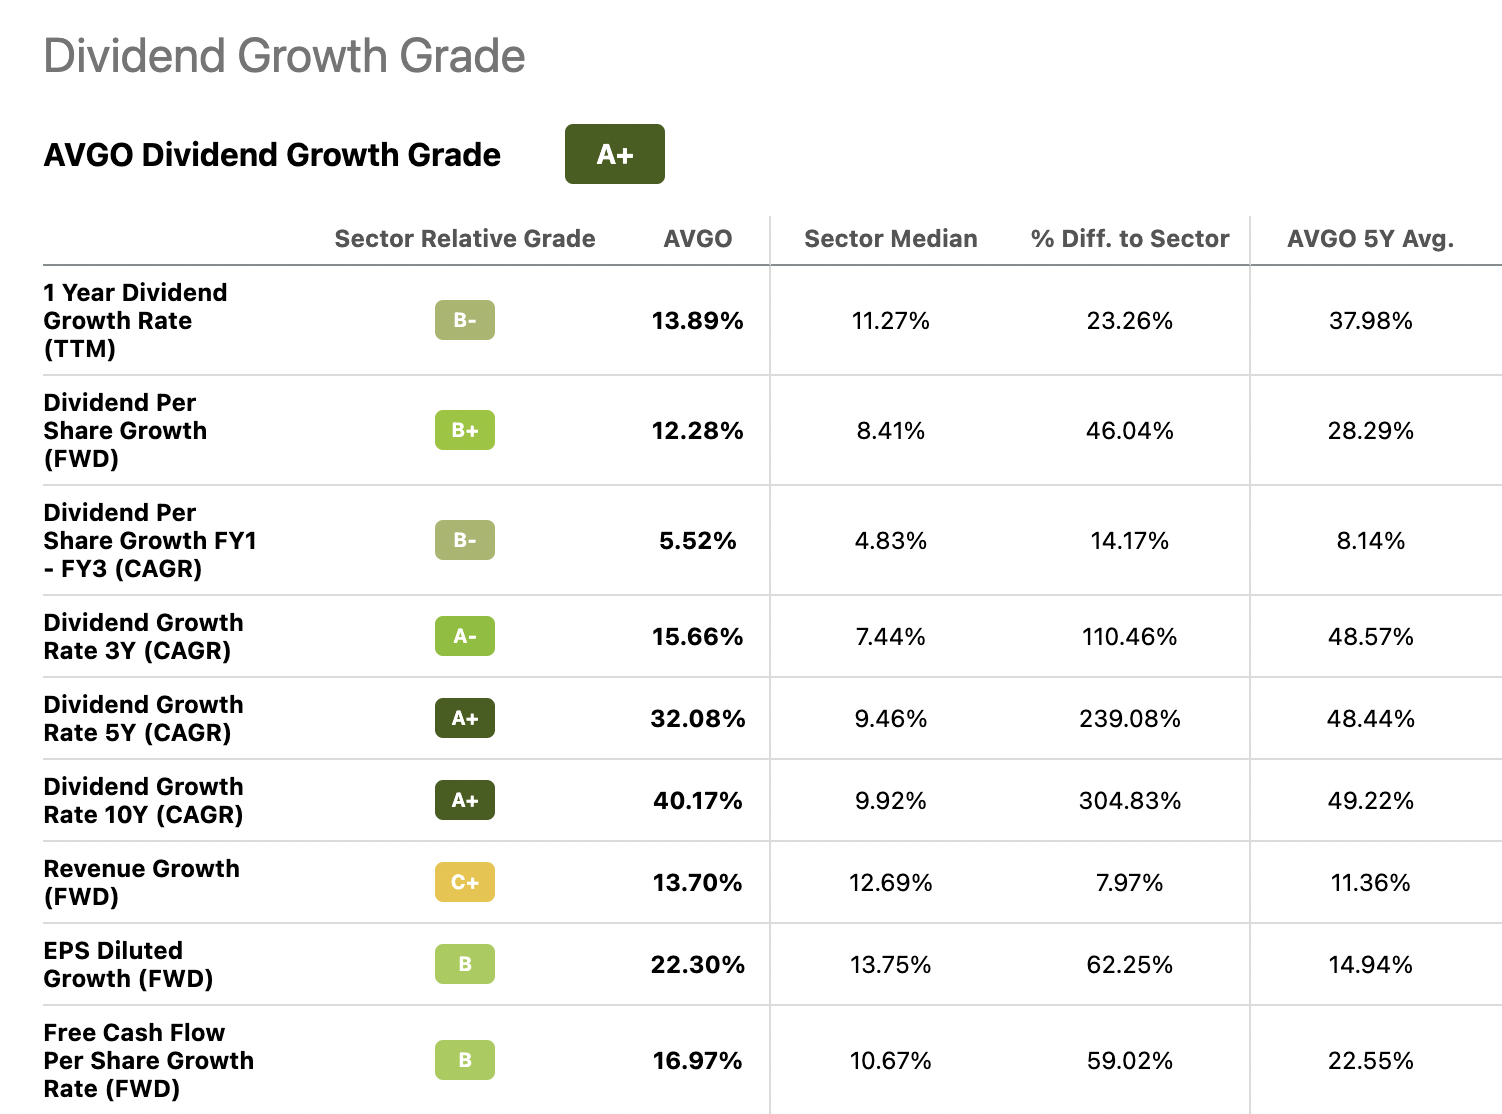
AVGO Dividend Growth (Seeking Alpha)
AVGO Dividend History (Source: SeekingAlpha)
Continued dividend increases appear likely. In the chart below, notice that AVGO’s one year after tax FCF per share grew 28.39%, notably higher than the dividend growth rate at 13.17%. The dividend was covered by FCF by 219% over the last two years.
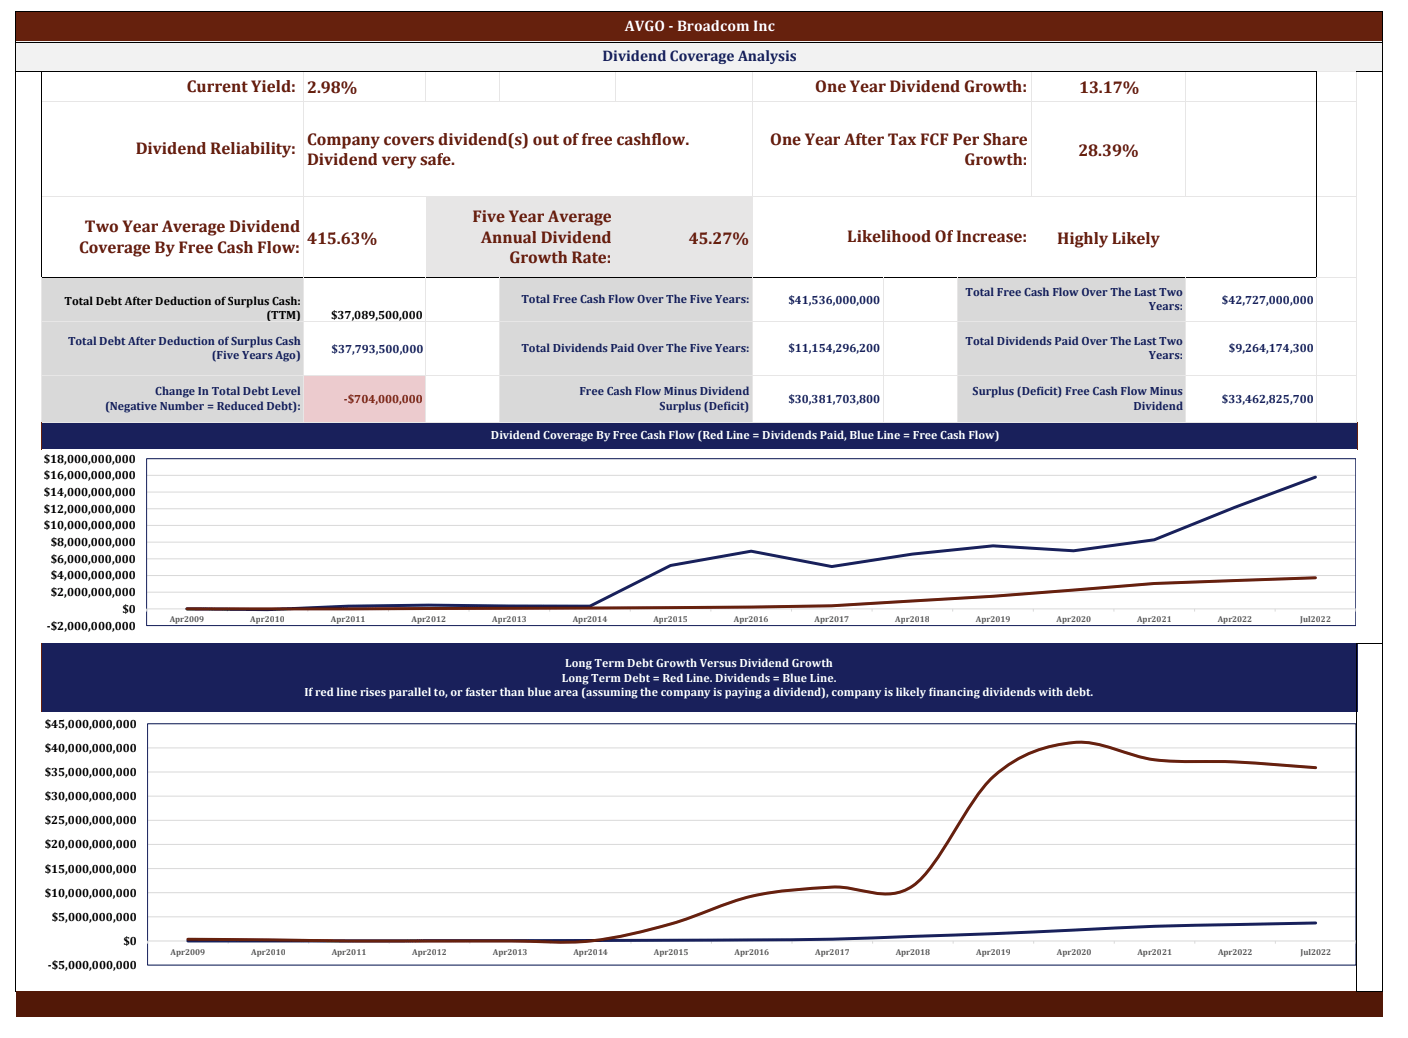
AVGO Dividend Safety (www.dividendrisk.com)
Broadcom is currently in the regulatory approval process for its $61B acquisition of VMware. In the second quarter earnings call, CEO Hock Tan stated that the company would remain committed to their “dividend policy of returning 50% of prior year’s free cash flow as dividends” after the acquisition closes. He further stated that AVGO expects this acquisition to enhance their already strong FCF growth, which stands at a CAGR of 41% over the past six years. With such a large acquisition being margin accretive out of the gate (according to Tom Krause, President of Broadcom Software), and boosting revenues on the software side from around $5B to near $20B, the acquisition should be supportive of AVGO’s dividend growth. In the third quarter conference call, Tan reiterated that he is fully confident the transaction will close in fiscal year 2023.
Buy, sell or hold?
The yield, currently 3.07%, compares to a six-month high of 3.9% and a low of 2.92%. Working in part off of this history, and in part off of six-month price relationships to simple moving average, our mean reversion algorithm indicates AVGO is a buy at $395 and under, and a sell at $362 and higher.
Our pattern-recognition software analyzes the past six months of trading and, after calculating the annualized returns generated by 20 different patterns, applies the pricing relationship to simple moving average that has provided the highest return to the current price. The algo updates every hour to capture emerging market dynamics. In summary, the algo buys on weakness and sells on strength. In the case of AVGO, the software identified one purchase over the last six months, and no sales. On average, in the 37 securities we follow closely, the Algo identifies at least one purchase and one sale in a typical six-month period.

Algo-Indicated Buy (TD Ameritrade ThinkorSwim)
The pattern the algo is currently working off generated a return of 211% annualized over the last six months before the 3% dividend yield. It last indicated that AVGO was a buy on Oct. 13 at $420.86. Future returns from the algo’s recommendations will be at least slightly, if not significantly, different. That’s because history doesn’t repeat exactly. If a sell opportunity is missed because the stock falls before hitting the algo-indicated target, income investors collect the yield and wait. See here for more on how the algo works.
Summary
AVGO is a quality company with excellent trends across the financial metrics we monitor. Broadcom’s current price level is approaching that which has meant inordinate short-term risk. We await a more compelling price. We’d be surprised if such an opportunity doesn’t present itself in the next couple of months.
Be the first to comment