

GBP/USD – Prices, Charts, and Analysis
- US dollar prints another 20-year high.
- US Treasury 2-yr/10-yr curve inverts further.
- Retail traders remain heavily net-long.
The US dollar is trading at a fresh two-decade high in early European turnover, a familiar story over the past weeks. All short-term dips in the greenback have been bought and the DXY is up the best part of twenty big figures since June last year. This US dollar strength can be seen across a wide variety of USD pairs with multi-year highs/lows being printed on a regular basis.
With inflation and recession battling for column inches in the US, Wednesday’s Inflation release (13:30 UK) will be closely watched. The core inflation rate (m/m) is seen rising by 0.6%, while the annual rate is seen declining to 5.7% from 6% in May.
For all market-moving economic data and events, refer to the DailyFX calendar
While the Federal Reserve continues to deliver over-sized rate hikes at a rapid pace to dampen inflation, one prominent Fed official, Kansas City President Esther George, warned on Tuesday that the current rate of monetary policy tightening may be happening too quickly. Ms. George, who voted against a 75bp rate hike at the last FOMC meeting, noted that it was worrying that a recession debate had already started, ‘just four months’ after the central bank began hiking rates. The US Treasury market is flashing a recessionary warning with the closely watched UST2s/10s yield curve now inverted by seven basis points.
US Dollar Basket (DXY) Monthly Price Chart – July 12, 2022
Cable is trading at a news two-year+ low against the greenback with the pair finding little to no support on the move lower. GBP/USD is suffering from GBP weakness along with US dollar strength, with the British Pound under pressure from ongoing economic and political woes. The UK economy remains weak and may be looking at an official recession in the coming months, while over at Westminster, a raft of candidates are putting themselves forward for the vacant role of Prime Minister after Boris Johnson resigned last week. Political battles can turn nasty, quickly and this will weigh on Sterling in the coming days.
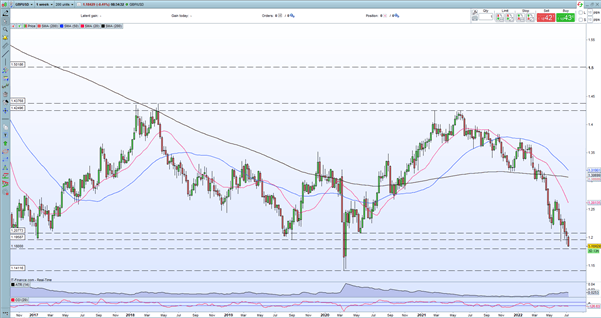
The weekly GBP/USD chart shows the lack of near-term support before the March 2020, double low around 1.1420 comes into play. Cable has lost nearly 25 big figures since May 2021 and while this may offer a good level to start phasing into a long-term position, in the short-term Sterling still looks vulnerable.
GBP/USD Weekly Price Chart – July 12, 2022
Retail trader data show 79.83% of traders are net-long with the ratio of traders long to short at 3.96 to 1. The number of traders net-long is 14.72% higher than yesterday and 12.66% higher from last week, while the number of traders net-short is 18.81% lower than yesterday and 14.18% lower from last week.
We typically take a contrarian view to crowd sentiment, and the fact traders are net-long suggests GBP/USD prices may continue to fall. Traders are further net-long than yesterday and last week, and the combination of current sentiment and recent changes gives us a stronger GBP/USD-bearish contrarian trading bias.
What is your view on the British Pound – bullish or bearish?? You can let us know via the form at the end of this piece or you can contact the author via Twitter @nickcawley1.
Be the first to comment