

dk_photos/iStock via Getty Images
Earnings of Bridgewater Bancshares, Inc. (NASDAQ:BWB) will most probably continue to surge mostly due to a strong regional economy that will boost loan growth. Further, team expansion and the recent launch of a new digital system will propel the loan portfolio. Overall, I’m expecting Bridgewater Bancshares to report earnings of $1.69 per share for 2022, up 10% year-over-year. Compared to my last report on the company, I’ve barely changed my earnings estimate. For 2023, I’m expecting the company to report earnings of $1.94 per share, up 15% year-over-year. The year-end target price is quite close to the current market price. Therefore, I’m downgrading Bridgewater Bancshares to a hold rating.
Several Internal and External Factors to Drive Loan Growth
Bridgewater Bancshares’ loan book grew at a faster rate in the first half of 2022 than in any of the last five years. The portfolio increased by 14.5% during the first half of the year, or 29% annualized. Going forward, loan growth will likely revert to the historical norm as the second quarter’s outstanding performance is clearly unsustainable.
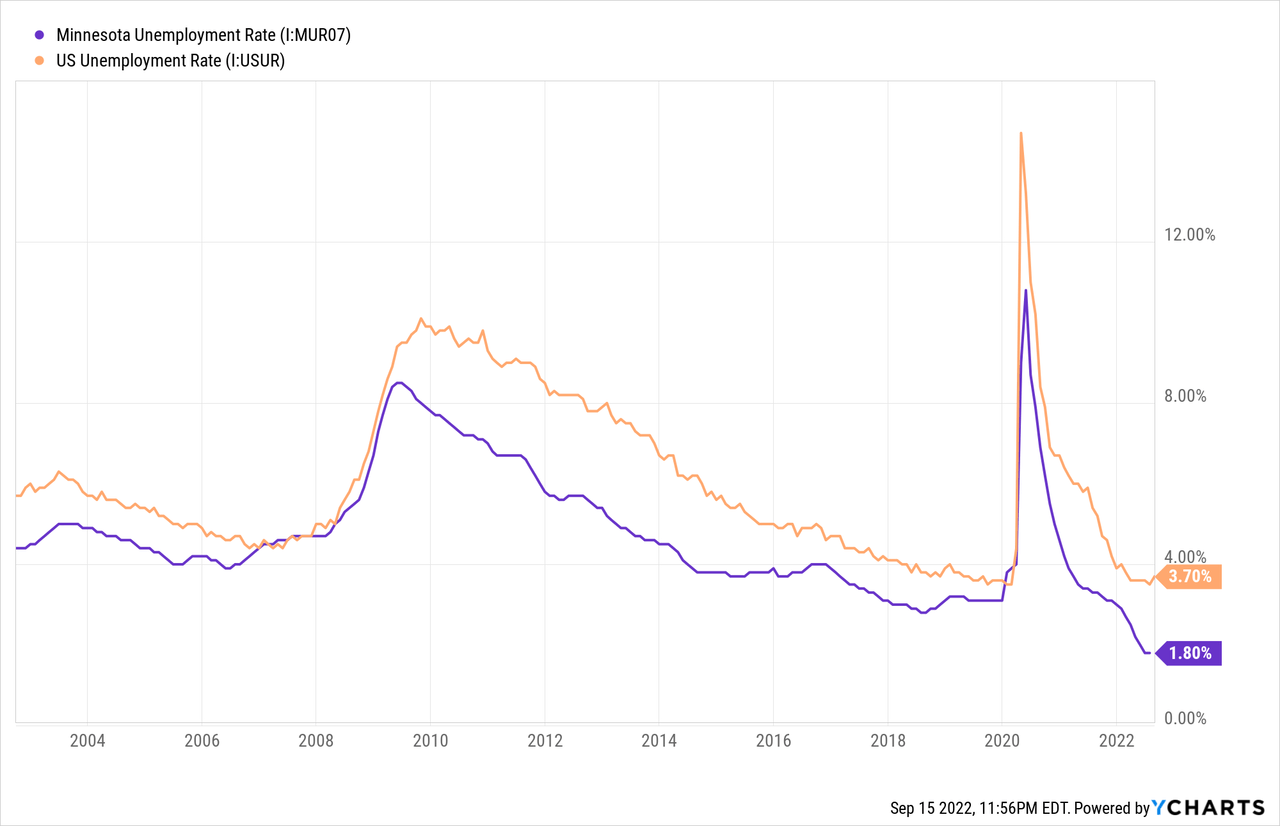
Nevertheless, loan growth will likely remain strong thanks to a strong regional economy. Bridgewater Bancshares operates in Minnesota, which currently has the lowest unemployment rate in the country.
Further, the state’s coincident economic activity index currently shows steeper growth than the pre-pandemic rate.
Federal Reserve Bank of Philadelphia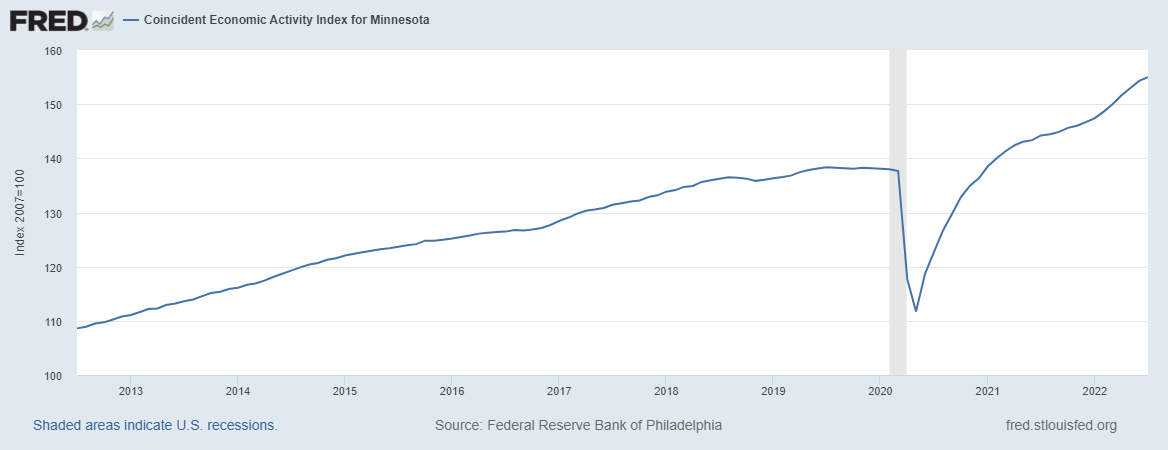
Moreover, the management has recently hired new bankers in the commercial real estate (non-owner occupied) and commercial and industrial segments, as mentioned in the earnings presentation. Due to these team additions, the management is optimistic about loan growth in these segments.
Further, the new commercial loan origination system launched in March 2022 has seen initial success. I’m expecting this digital system to continue to keep commercial loan growth elevated in the next year and a half.
Considering these factors, I’m expecting the loan portfolio to grow by 5% every quarter till the end of 2023. This will lead to full-year 2022 loan growth of 26%. In my last report on Bridgewater Bancshares, I estimated loan growth of 15.9%. I’ve increased my loan growth estimate because of the second quarter’s performance. Moreover, Minnesota’s economy is doing even better than I expected; therefore, I’ve revised upward my growth estimate for the second half of 2022.
Meanwhile, I’m expecting deposits to grow in line with loans. However, the growth of other balance sheet items will lightly lag loan growth. The following table shows my balance sheet estimates.
| FY18 | FY19 | FY20 | FY21 | FY22E | FY23E | |
| Financial Position | ||||||
| Net Loans | 1,640 | 1,884 | 2,282 | 2,770 | 3,497 | 4,250 |
| Growth of Net Loans | 23.7% | 14.9% | 21.1% | 21.4% | 26.2% | 21.6% |
| Other Earning Assets | 257 | 293 | 393 | 441 | 499 | 509 |
| Deposits | 1,561 | 1,823 | 2,502 | 2,946 | 3,530 | 4,291 |
| Borrowings and Sub-Debt | 182 | 174 | 142 | 135 | 240 | 249 |
| Common equity | 221 | 245 | 265 | 313 | 334 | 390 |
| Book Value Per Share ($) | 7.5 | 8.2 | 9.1 | 10.8 | 11.6 | 13.5 |
| Tangible BVPS ($) | 7.4 | 8.0 | 9.0 | 10.7 | 11.5 | 13.4 |
|
Source: SEC Filings, Author’s Estimates (In USD million unless otherwise specified) |
Liability Re-pricing to Overtake Asset Re-pricing in the Short Term
The average loan yield is moderately rate-sensitive as floating and adjustable rate loans made up 35% of total loans at the end of June 2022, according to details given in the 10-Q filing. Additionally, fixed-rate loans totaling $275 million will mature within one year, representing 9% of total loans.
On the other side of the balance sheet, the deposit book is quite rate-sensitive. The interest-bearing transaction, savings, and money-market accounts made up 46% of total deposits, according to details given in the 10-Q filing. These deposits re-price frequently; therefore, they will almost immediately compress the margin in a rising rate environment.
According to the results of the management’s interest-rate sensitivity analysis given in the 10-Q filing, the net interest income will take a slight negative impact from rising interest rates in the short term. A 200-basis points hike in interest rates could decrease the net interest income by 0.66% over twelve months.
2Q 2022 10-Q Filing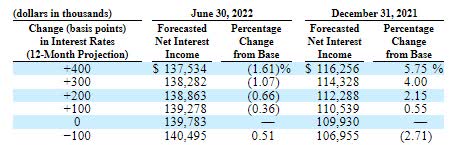
On the other hand, loan additions will support the net interest margin. Overall, I’m expecting the margin to be mostly stable through the end of 2023.
Normalized Provisioning Likely Till the end of 2023
Non-performing loans made up just 0.02% of total loans, while allowances made up a much higher 1.39% of total loans at the end of June 2022. As a result, the allowance coverage seems a bit excessive. In my opinion, the management will want to maintain its allowance coverage at a high level because there are threats of a recession. Further, the heightened inflation is bound to increase the financial stress for borrowers. Moreover, high interest rates will pressurize those borrowers that have variable-rate loans.
Overall, I’m expecting the net provision expense to make up around 0.28% of total loans annualized every quarter till the end of 2023. This is the same as the average net-provision-expense-to-total-loan ratio for the last five years. In my last report on Bridgewater Bancshares, I estimated a net provision expense of $8 million for 2022. I have now revised it up to $10 million mostly because I’ve revised upward my estimate of loan additions for the year.
Expecting Earnings to grow by 10%
The anticipated loan additions will likely be the chief driver of earnings through the end of 2023. Meanwhile, the margin will likely remain unchanged from the second quarter’s level. Further, the provisioning expense will likely remain at a normal level. Overall, I’m expecting Bridgewater Bancshares to report earnings of $1.69 per share for 2022, up 10% year-over-year. For 2023, I’m expecting earnings to grow by 15% to $1.94 per share. The following table shows my income statement estimates.
| FY18 | FY19 | FY20 | FY21 | FY22E | FY23E | |||||
| Income Statement | ||||||||||
| Net interest income | 65 | 74 | 88 | 110 | 133 | 161 | ||||
| Provision for loan losses | 4 | 3 | 13 | 5 | 10 | 12 | ||||
| Non-interest income | 3 | 4 | 6 | 5 | 6 | 6 | ||||
| Non-interest expense | 32 | 37 | 45 | 48 | 58 | 74 | ||||
| Net income – Common Sh. | 27 | 31 | 27 | 45 | 49 | 56 | ||||
| EPS – Diluted ($) | 0.91 | 1.05 | 0.93 | 1.54 | 1.69 | 1.94 | ||||
|
Source: SEC Filings, Earnings Releases, Author’s Estimates (In USD million unless otherwise specified) |
||||||||||
In my last report on Bridgewater Bancshares, I estimated earnings of $1.70 per share for 2022. I’ve barely changed my earnings estimate because the upward revision in the loan growth estimate cancels out the upward revision in the provision expense estimate.
Actual earnings may differ materially from estimates because of the risks and uncertainties related to inflation, and consequently the timing and magnitude of interest rate hikes. Further, a stronger or longer-than-anticipated recession can increase the provisioning for expected loan losses beyond my estimates.
Current Market Price is Quite Close to the Year-End Target Price
I’m using the historical price-to-tangible book (“P/TB”) and price-to-earnings (“P/E”) multiples to value Bridgewater Bancshares. The stock has traded at an average P/TB ratio of 1.46 in the past, as shown below.
| FY18 | FY19 | FY20 | FY21 | Average | |
| T. Book Value per Share ($) | 7.4 | 8.0 | 9.0 | 10.7 | |
| Average Market Price ($) | 12.5 | 11.5 | 10.7 | 16.4 | |
| Historical P/TB | 1.69x | 1.43x | 1.20x | 1.54x | 1.46x |
| Source: Company Financials, Yahoo Finance, Author’s Estimates | |||||
Multiplying the average P/TB multiple with the forecast tangible book value per share of $11.5 gives a target price of $16.8 for the end of 2022. This price target implies a 3.6% downside from the September 15 closing price. The following table shows the sensitivity of the target price to the P/TB ratio.
| P/TB Multiple | 1.26x | 1.36x | 1.46x | 1.56x | 1.66x |
| TBVPS – Dec 2022 ($) | 11.5 | 11.5 | 11.5 | 11.5 | 11.5 |
| Target Price ($) | 14.5 | 15.7 | 16.8 | 18.0 | 19.1 |
| Market Price ($) | 17.5 | 17.5 | 17.5 | 17.5 | 17.5 |
| Upside/(Downside) | (16.8)% | (10.2)% | (3.6)% | 3.0% | 9.6% |
| Source: Author’s Estimates |
The stock has traded at an average P/E ratio of around 11.7x in the past, as shown below.
| FY18 | FY19 | FY20 | FY21 | Average | |
| Earnings per Share ($) | 0.91 | 1.05 | 0.93 | 1.54 | |
| Average Market Price ($) | 12.5 | 11.5 | 10.7 | 16.4 | |
| Historical P/E | 13.7x | 11.0x | 11.5x | 10.7x | 11.7x |
| Source: Company Financials, Yahoo Finance, Author’s Estimates | |||||
Multiplying the average P/E multiple with the forecast earnings per share of $1.69 gives a target price of $19.8 for the end of 2022. This price target implies a 13.4% upside from the September 15 closing price. The following table shows the sensitivity of the target price to the P/E ratio.
| P/E Multiple | 9.7x | 10.7x | 11.7x | 12.7x | 13.7x |
| EPS 2022 ($) | 1.69 | 1.69 | 1.69 | 1.69 | 1.69 |
| Target Price ($) | 16.4 | 18.1 | 19.8 | 21.5 | 23.2 |
| Market Price ($) | 17.5 | 17.5 | 17.5 | 17.5 | 17.5 |
| Upside/(Downside) | (6.0)% | 3.7% | 13.4% | 23.1% | 32.7% |
| Source: Author’s Estimates |
Equally weighting the target prices from the two valuation methods gives a combined target price of $18.3, which implies a 4.9% upside from the current market price. In my last report on Bridgewater Bancshares, I gave a target price of $18.70 and adopted a buy rating. Since then, the stock price has surged, leaving a small upside. Therefore, I’m now downgrading Bridgewater Bancshares to a hold rating.
Be the first to comment