

BRENT CRUDE OIL (LCOc1) ANALYSIS
- Surging dollar adds to crude oil headwinds.
- API data surprise a precursor to EIA later today?
- Sanctions from U.S. and allies help prop up oil prices.
- Chinese PMI and lockdowns hurting demand-side forecasts.
- Triangle breakout imminent.
CRUDE OIL FUNDAMENTAL BACKDROP
Brent crude slipped yesterday on the back of a surprise increase in weekly crude oil stockpiles via the API print while the Fed’s Brainard stated the commencement of swift balance sheet reduction, resulting in dollar upside (traditionally an inverse correlation with oil).
Learn more about Crude Oil Trading Strategies and Tips in our newly revamped Commodities Module!
The upcoming EIA inventory report (14:30GMT) will be in the spotlight particularly if actual data follows the surprise API release.
CRUDE OIL ECONOMIC CALENDAR
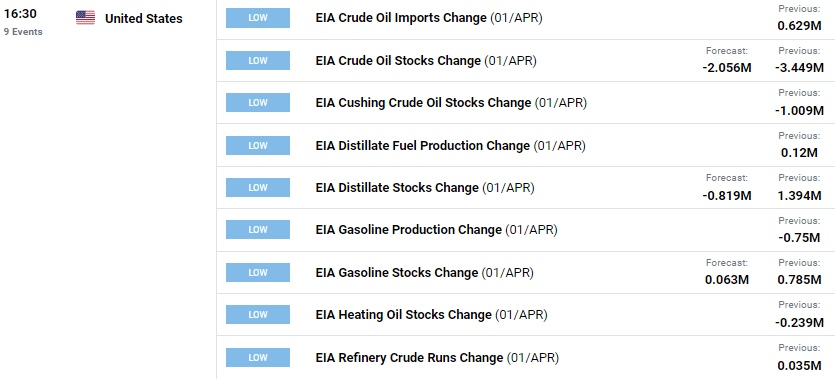
Source: DailyFX Economic Calendar
In addition to the aforementioned supply-side headwinds, China’s lockdowns and COVID-19 cases are rising thus easing demand for crude from one of the worlds major importers. The Caixin Composite PMI print for March earlier this morning reinforced the lockdown situation with a drop to 43.9 from 50.1 prior.
Further sanctions on Russia from the U.S. and other allied nations have given some backing to crude oil as tight supply may ensue should imports of Russian oil and gas be decreased further. Details around the International Energy Agency’s (IEA) coordinated release are still being mulled over leaving oil markets in limbo reflected by brent crude’s price action.
TECHNICAL ANALYSIS
BRENT CRUDE (LCOc1)DAILY CHART
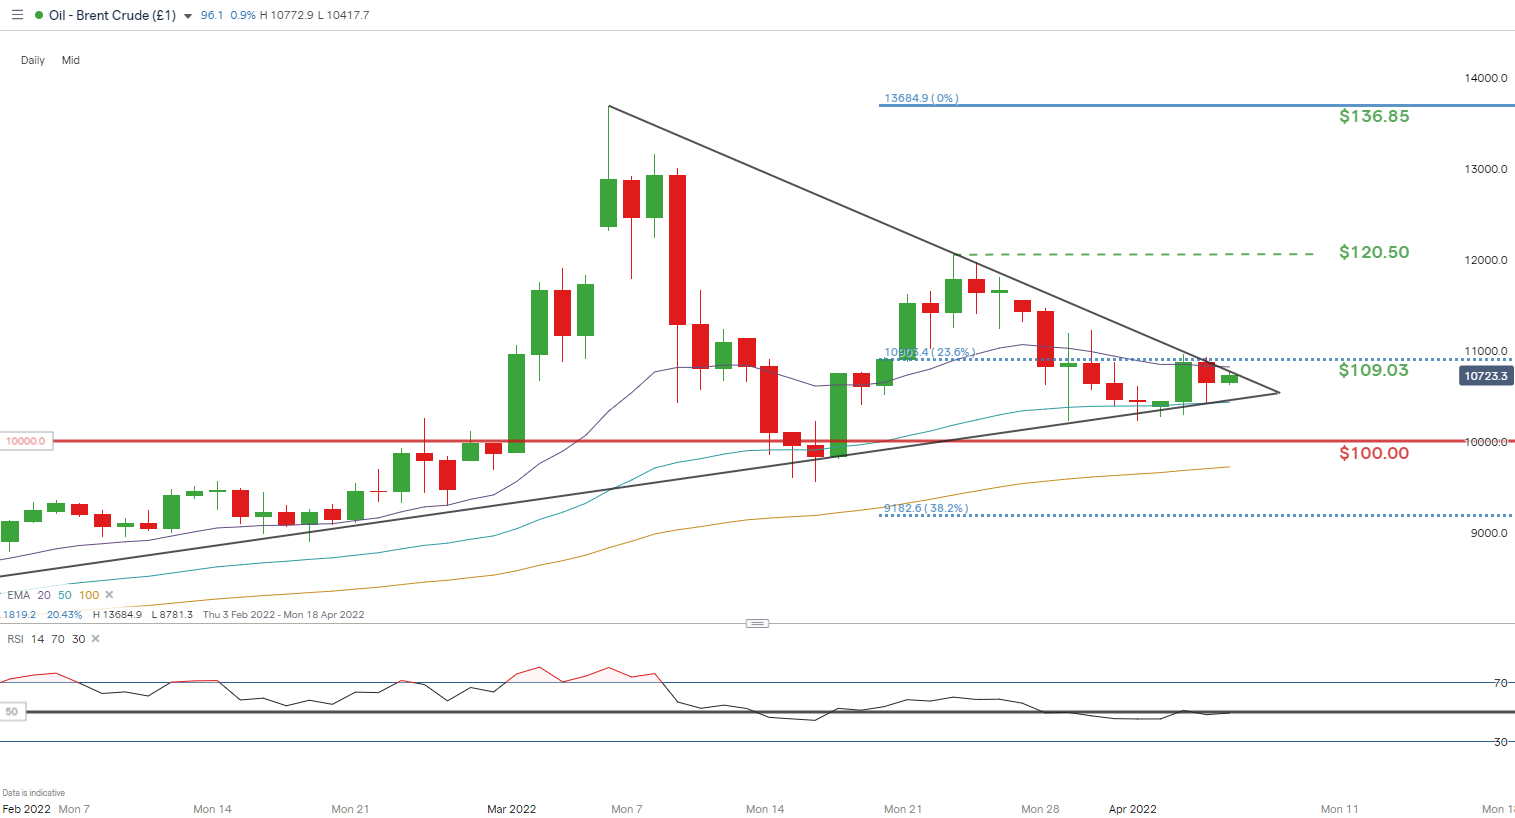
Chart prepared by Warren Venketas, IG
The daily brent crude chart trades at a critical juncture at the apex of the medium-term symmetrical triangle formation (black). Sandwiched between the $100 and $109.03 (23.6% Fibonacci), a breakout either side is possible. I will be looking for a daily candle confirmation close to sanction a breakout but with fundamentals fluctuating constantly a false breakout should not be written off.
Key resistance levels:
- $120.50
- $109.03/20-day EMA (purple)
- Triangle resistance (black)
Key support levels:
IG CLIENT SENTIMENT POINTS TO SHORT-TERM DOWNSIDE
IGCS shows retail traders are marginally NET LONG on Crude Oil, with 59% of traders currently holding long positions (as of this writing). At DailyFX we typically take a contrarian view to crowd sentiment resulting in a bearish disposition.
Contact and follow Warren on Twitter: @WVenketas
Be the first to comment