

Phynart Studio/E+ via Getty Images
Healthcare stocks were a strong part of the market throughout the first half of 2022. The Health Care Select Sector SPDR ETF (XLV) beat SPY by 15 percentage points through June. Since the start of H2, though, the generally defensive area has underperformed the broad market by 7%. The iShares U.S. Medical Devices ETF (IHI) has been a chronic weak spot throughout 2022, though. One of its major holdings has traded sideways for the past few years – is a breakout possible?
2022 Returns: Health Care Sector, Medical Device Industry, S&P 500
StockCharts.com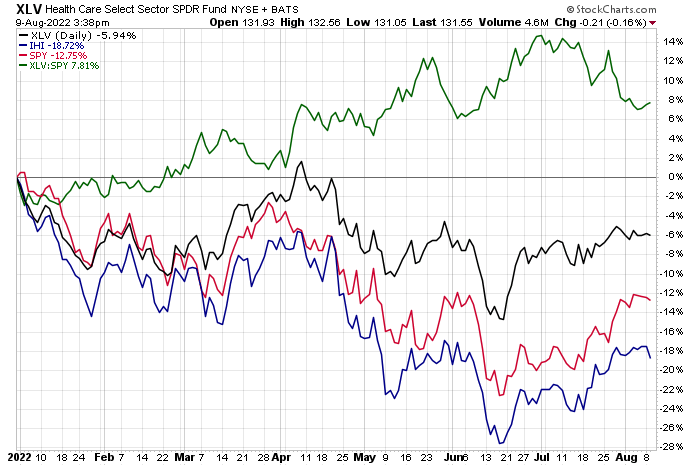
According to Bank of America Global Research, Boston Scientific (NYSE:BSX) develops, manufactures, and markets medical devices that are used in interventional cardiology, peripheral interventions, vascular surgery, electrophysiology, neurovascular intervention, oncology, endoscopy, urology, gynecology, and neuromodulation.
The $59 billion market cap Massachusetts-based Health Care sector company operating in the Health Care Equipment & Supplies industry has a high trailing 12-month P/E ratio above 70 and does not pay a dividend, according to The Wall Street Journal. BSX beat its earnings per share estimate back on July 27 after reporting in-line profits at the previous reporting date. BSX is a 4% holding in the iShares U.S. Medical Devices ETF, IHI.
After reporting an upside earnings surprise, management noted: “Despite a challenging macroeconomic environment, we remain focused on operating margin expansion and expect to see sequential improvement in the second half of this year.” Margins across the corporate world continue to be top of mind. Firms that can efficiently operate and effectively raise prices will certainly attract investor interest.
Margins Might Hold Up Across the Corporate World
Goldman Sachs Investment Research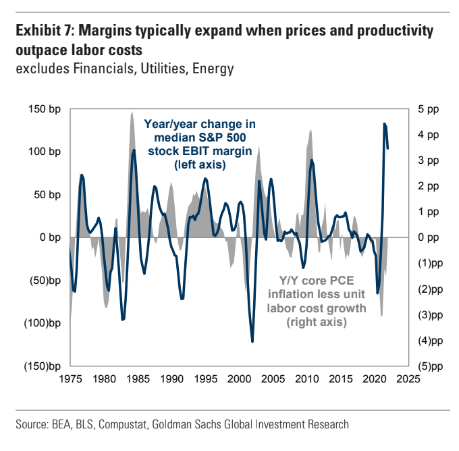
BofA analysts see BSX profits rising at a solid rate through 2024. The company’s operating P/E ratio should thus decline to reasonable levels given its EPS growth rate. Still, Boston Scientific’s EV/EBITDA valuation ratio is quite lofty versus the broad market average. BSX also does not generate a massive amount of free cash flow. So, the earnings and valuation picture is not particularly impressive.
BSX: Earnings, Valuation, Free Cash Flow Forecasts
BofA Global Research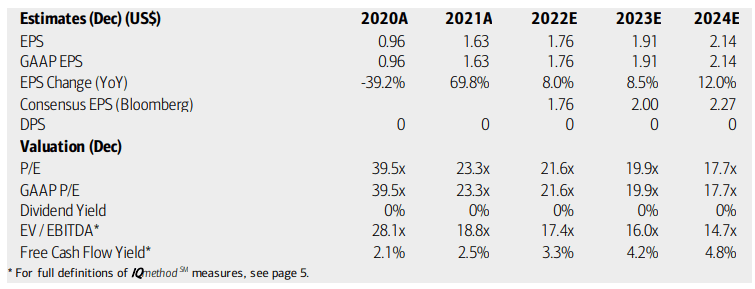
On the corporate event calendar, BSX has two important upcoming dates investors should mark on their calendars. The company’s management team is slated to present at the September 7 Wells Fargo Healthcare Conference, according to Wall Street Horizon. After that, BSX’s Q3 earnings report is unconfirmed for Wednesday, October 26, BMO.
BSX Corporate Event Calendar: Conference Upcoming
Wall Street Horizon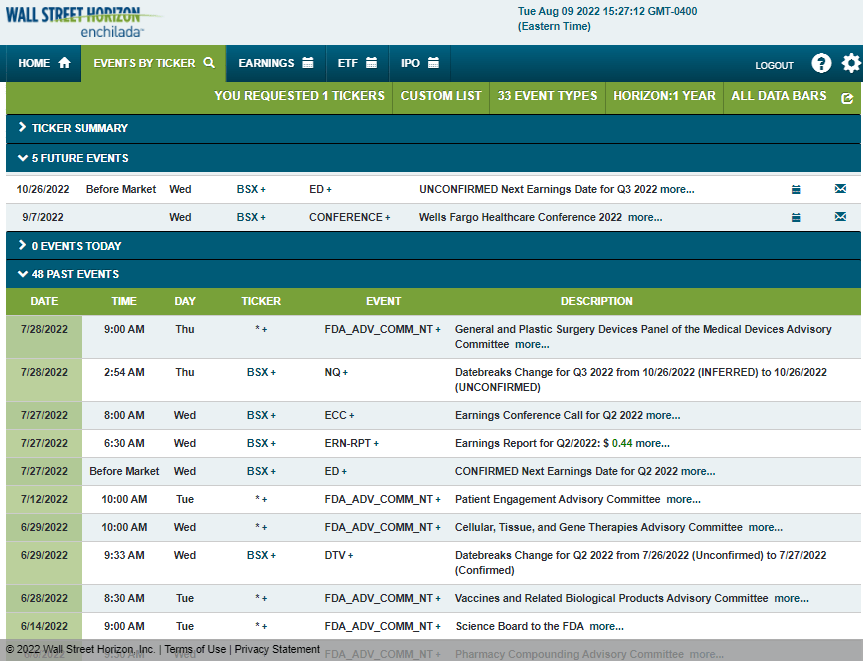
The Technical Take
As mentioned earlier, BSX has done a whole lot of nothing for the past three years. The stock has found resistance in the mid-upper $40s but then attracts buyers when shares dip into the low-mid $30s. The 2020 Covid crash low dropped to the late 2018/early 2019 range. But where might the stock go from here?
After a strong earnings-related gap up, the shares impressively held that jump. There has been no sign of a gap fill yet. Based on that strength, it appears the stock might want to test the old highs near $47. If there is a dip, I think a limit-buy order could make sense between $38 and $39 with that same target of $47. Support is significantly lower at $33. Near-term resistance has played out near $42.
BSX: Near-Term Upside Possible, But Longer-Term Sideways Price Action
StockCharts.com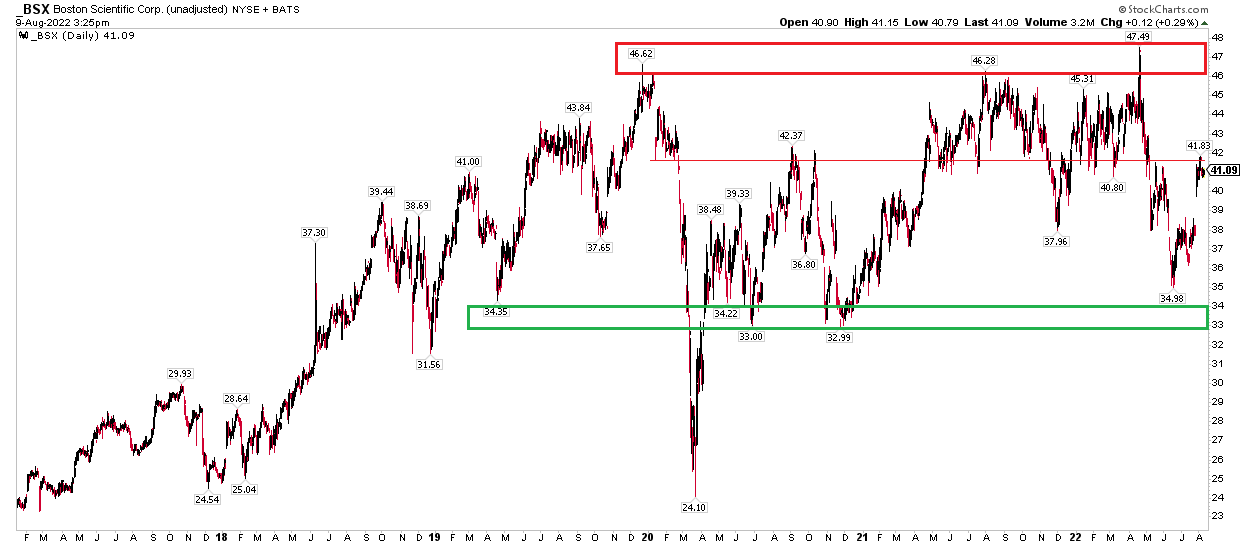
The Bottom Line
BSX is not an exciting stock right now. Earnings growth looks good, but its valuation is not overly cheap – even after beating estimates last month. The chart is trendless over the last several years, but a tactical long play makes sense to me.
Be the first to comment