

Chainarong Prasertthai/iStock via Getty Images
Investment thesis
There is a 0.94 correlation between Boise Cascade Company (NYSE:BCC) revenue and the US Housing Starts. I would expect BCC to be a cyclical company. Any analysis and valuation of BCC should be based on its performance over the Housing Starts cycle.
In the long run, the US Housing Starts will continue to be at its long-term average of 1.5 million units per year. Based on this and BCC’s performance over the cycle, there is a sufficient margin of safety at the current market price.
The thrust of my analysis
In my March 2022 article, “Boise Cascade – The Risk Is In The Valuation” I showed that BCC is a cyclical stock that is highly correlated to the US Housing Starts. I then valued BCC based on its performance over the cycle.
This article presents another way to value BCC over the Housing Starts cycle taking into account uncertainty about the duration and depth of the cycle.
Over the past 13 years, there was a 0.94 correlation between BCC revenue and the US Housing Starts. Refer to Chart 1. You should not be surprised by this. In its 2021 Form 10k, BCC stated:
“Demand for the products we manufacture, as well as the products we purchase and distribute, is closely correlated with new residential construction in the U.S…”
Chart 1: Correlation Between Revenue and Housing Starts (Author)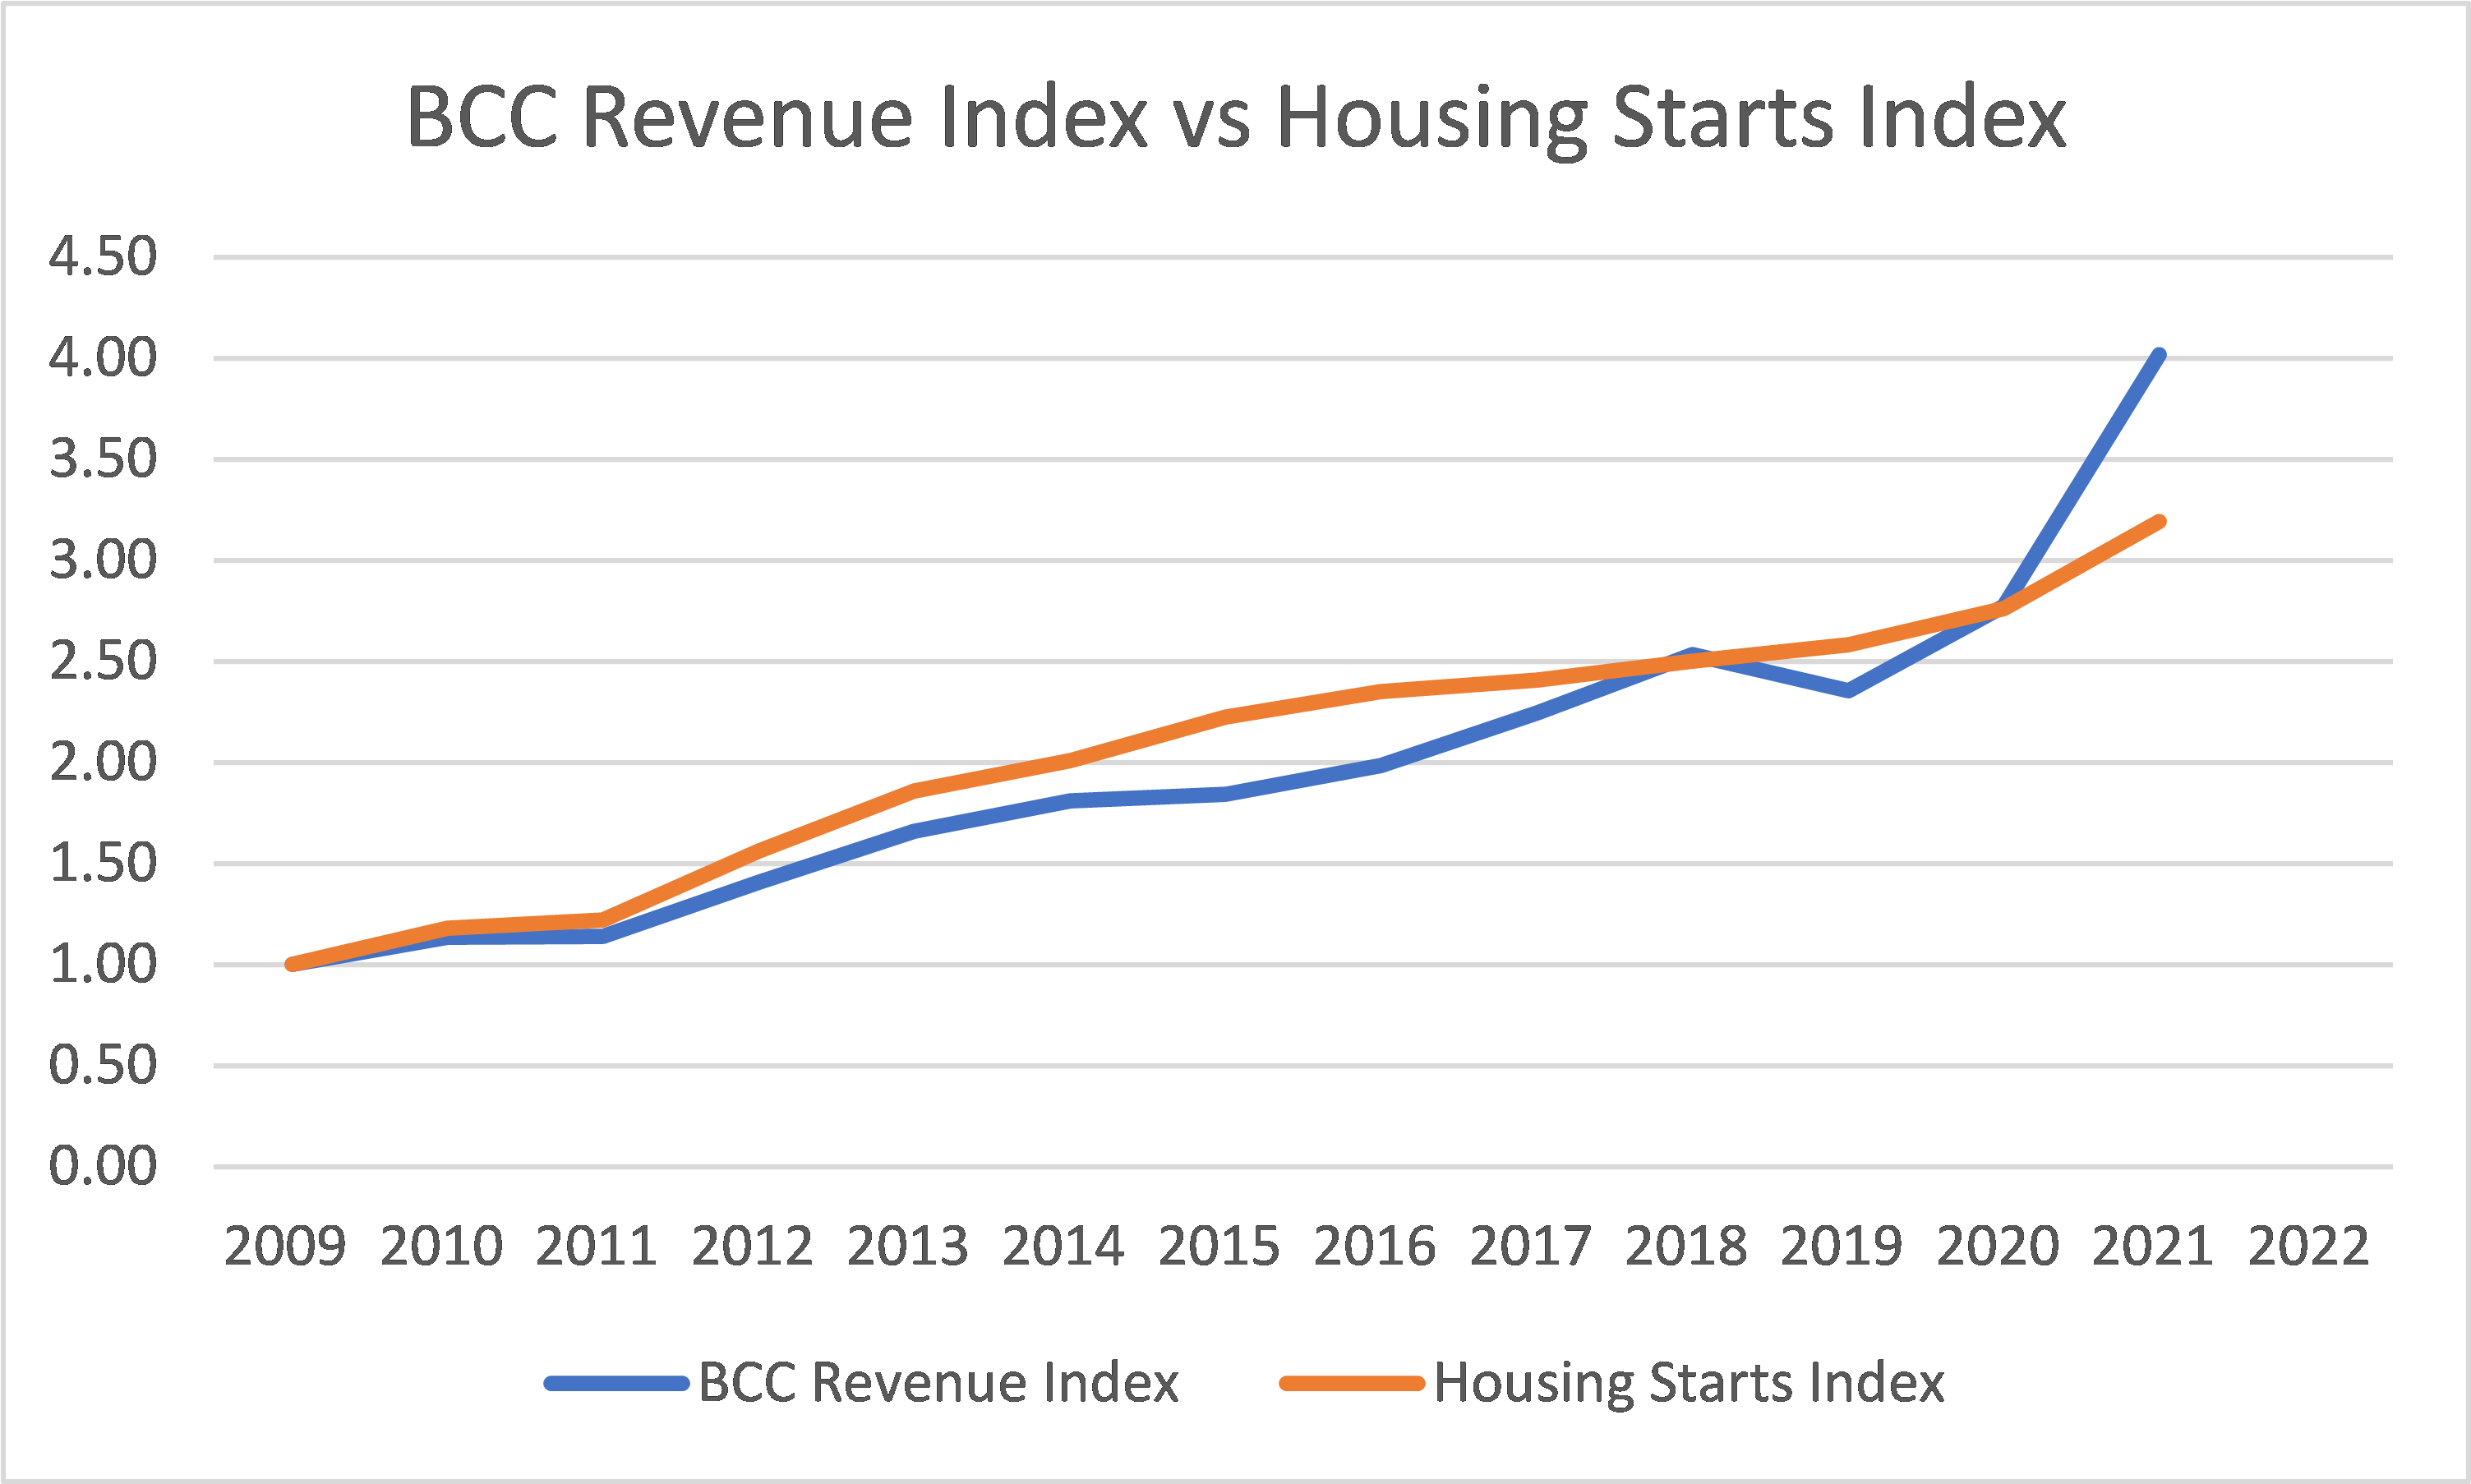
Note to Chart 1: The index was derived by dividing the values for each year with the respective 2009 values.
The Housing Starts are cyclical with the current cycle (starting from the trough in 2010) appearing to have peaked in 2022. We know the current problems besetting the housing sector. There are increasing interest rates and a potential decline in house prices.
Given the high inflation and the possible recession, this cannot be resolved even in 2023 or 2024. I do not know how long the coming cycle will last or how far the Housing Starts will decline before reaching the trough.
In analyzing and valuing BCC, I wanted to account for the uncertainty. As such, I considered the following when looking at whether BCC is an investment opportunity.
- Does it have the financial resources to withstand a longer (more than 2 years) downtrend to reach the trough?
- Would there be a sufficient margin of safety valuing BCC with a model that accounted for the uncertainty?
No growth cyclical sector
In my earlier article on D.R. Horton, I had shown that the US Housing Starts is cyclical with no long-term growth pattern.
To recap, Chart 2 below illustrates the difference in the patterns for a no-growth cycle (blue line) and a growth one (green line).
Chart 2: Cyclical Patterns (Author)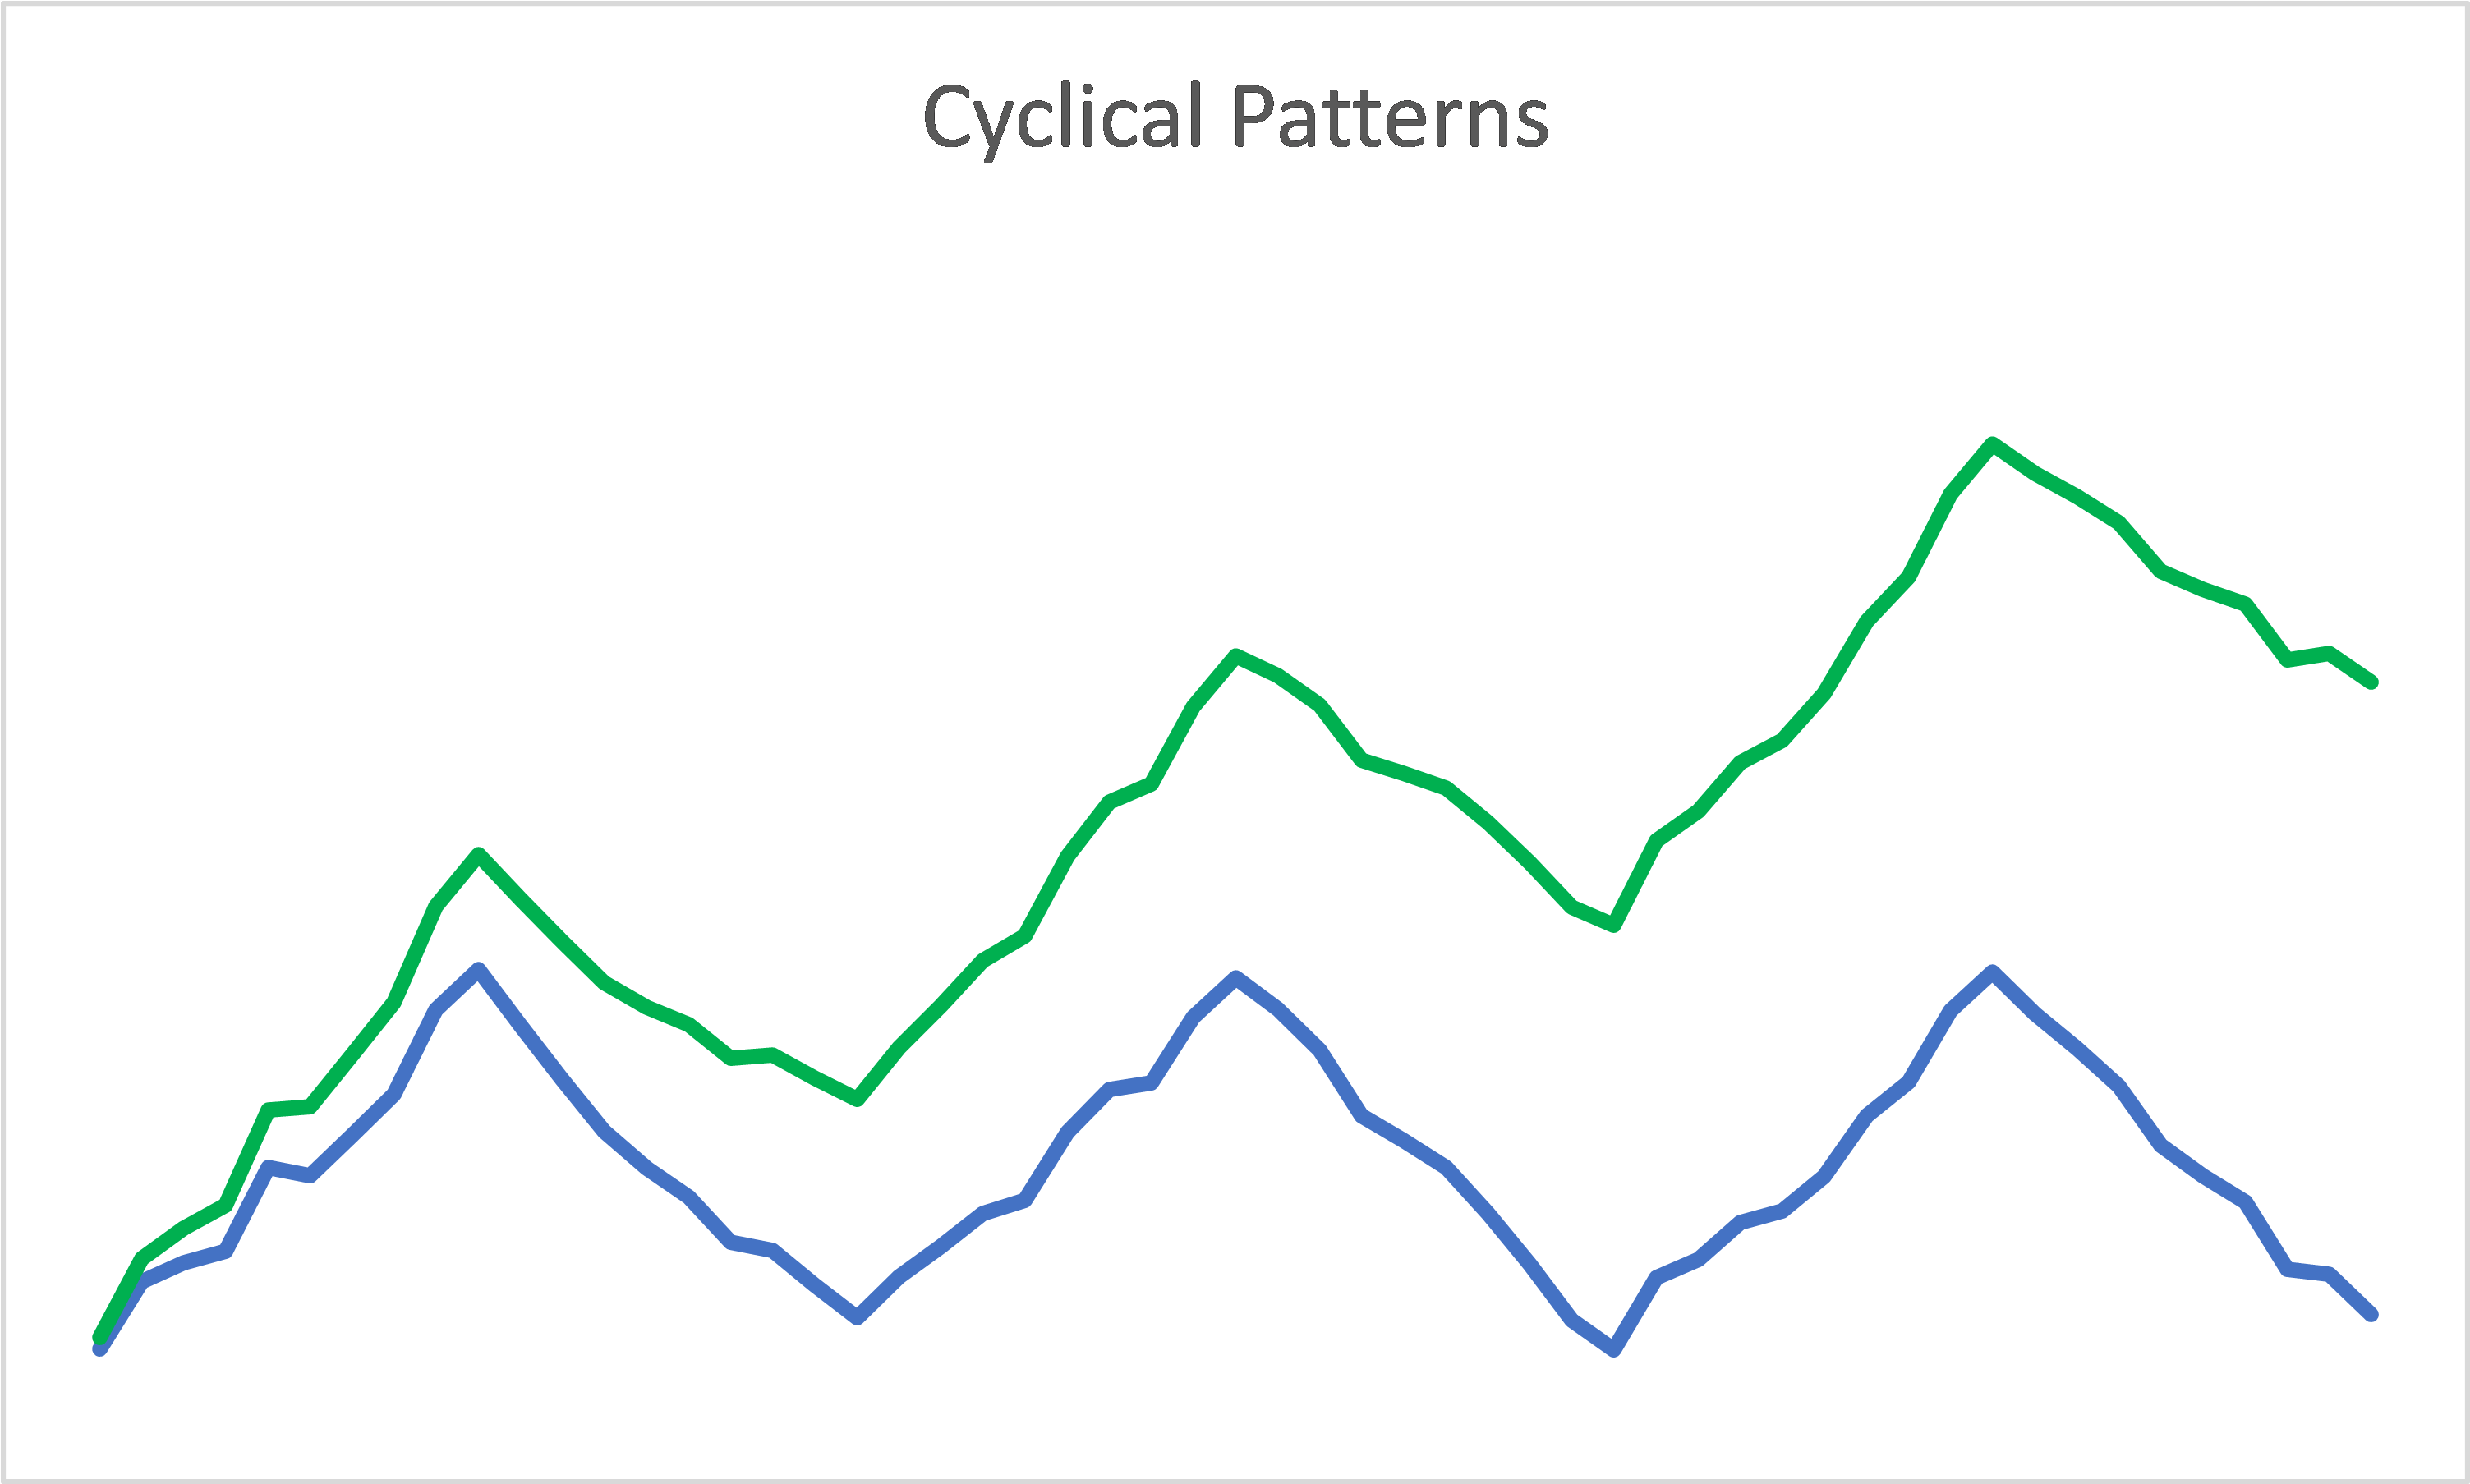
When you look at the past 70 years of US Housing Starts as per Chart 3, the conclusion is that this is more likely to be no growth cyclical sector. But the Housing Starts were based on physical units.
Chart 3: US Housing Starts (TradingEconomics)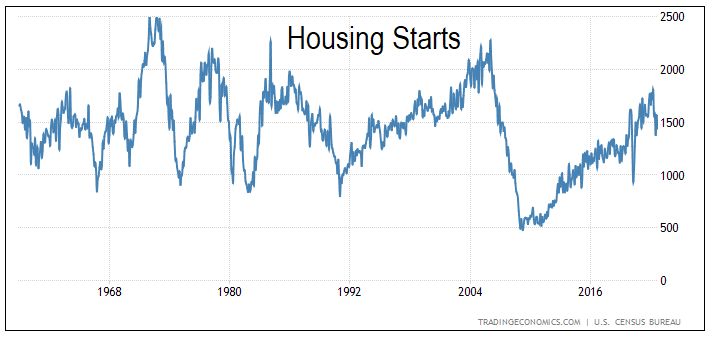
While there is no long-term growth in volume, prices still grow. The House Price Index had increased at a 4.6 % CAGR from 1992 till Aug 2022. But this growth rate is not much different from the US long-term GDP growth rate. This is not a growth sector.
The implications here are:
- The Earnings Power Value (EPV) should be a base value.
- We can use a single-stage model when looking at the value that incorporates growth.
Because of the no-growth cyclical pattern, the long-term average annual Housing Starts is taken to be about 1.5 million. But this 1.5 million is based on the various peaks and troughs being about the same above and below 1.5 million.
When you look at Chart 3, this seems reasonable pre-2006. But post-2006, the trough was at a new low of about 0.5 million units per year compared to the previous troughs of about 1.0 million units.
These 2 different trough pictures will affect the values over the cycle. When valuing BCC, we should look at some expected value. I considered 2 scenarios:
- Scenario 1 – based on the trough of 0.5 million units. Looking at Chart 3, this occurred about 6 times out of the 7 troughs.
- Scenario 2 – based on the trough of 1.0 million units. Historically, this occurred only once out of the 7 troughs.
Cyclical performance
Cyclical and commodity companies…value is often more dependent on the movement of a macro variable…than it is on firm-specific characteristics…the biggest problem we face in valuing companies tied to either is that the earnings and cash flows reported in the most recent year are a function of where we are in the cycle, and extrapolating those numbers into the future can result in serious mis-valuations. Damodaran
This begets the question of how you “normalize” the performance. Damodaran has suggested 3 ways:
- Absolute average over time. Take means taking the average values over the cycle.
- Relative average over time. “In effect, we can average profit margins over time, instead of net profits, and apply the average profit margin to revenues in the most recent period to estimate normalized earnings.”
- Sector averages. Damodaran suggested this be used for companies with limited history or undergoing some operating changes.
In my valuation of BCC, I adopted the second approach.
BCC performance
BCC manufactures engineered wood products, plywood, and lumber. It also distributes a broad line of building materials, including wood products manufactured by the group. While it has 2 business segments – Wood Products and Building Materials Distribution – they operate with a high degree of integration.
BCC had an extraordinary past 3 years. As can be seen from Chart 4, the Net Income for 2021 and 2022 was exceptional compared to the historical pattern. While Revenue achieved an 11.8 % CAGR from 2010 to 2022, PAT grew at 32.5 CAGR.
Chart 4: Performance Index (Author)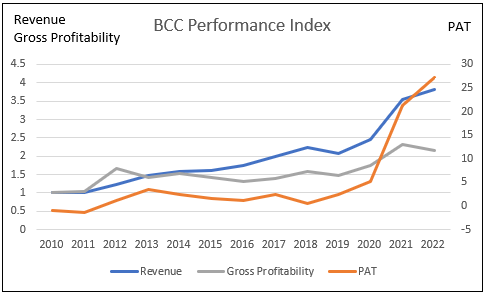
Note to Chart 4: There were losses in 2010 and 2011. That is why the PAT index was below 0 for these years. In the Chart, the PAT index axis is on the right.
These exceptional results were driven by a combination of higher gross profit margins and lower SGA margins. Refer to Chart 5.
Chart 5: Gross Profit and SGA Margins (Author)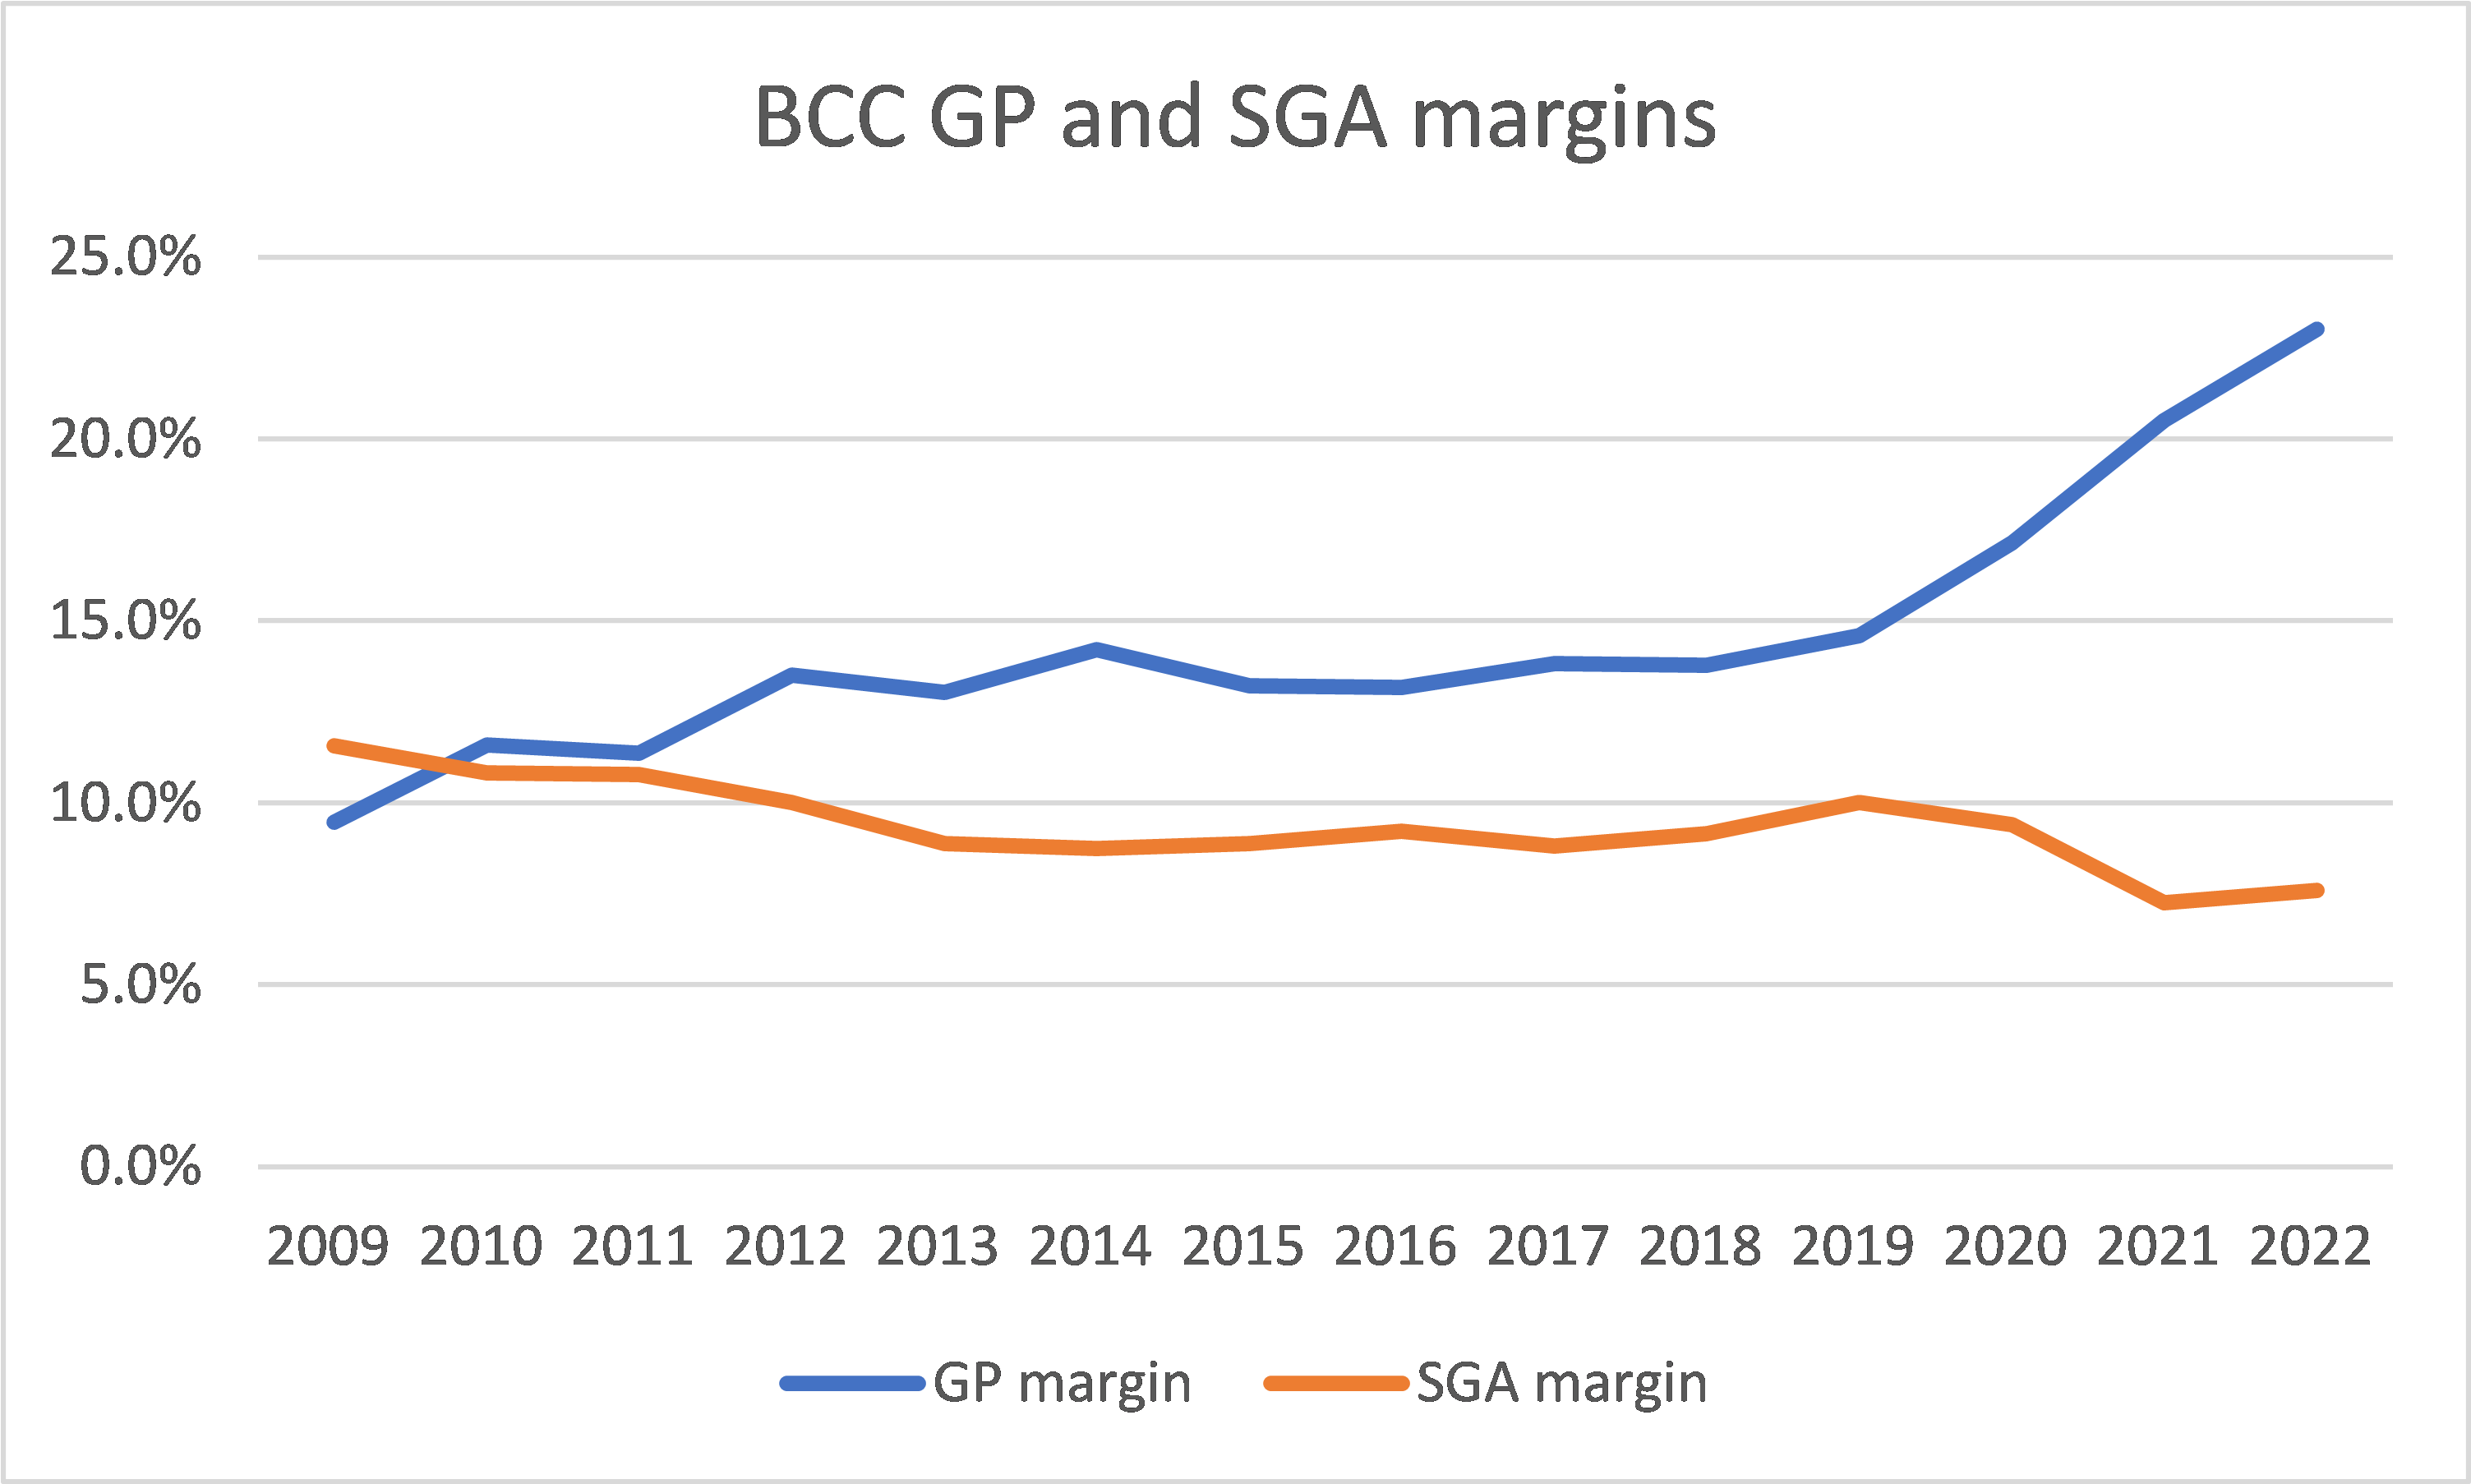
The extraordinarily high GP margins over the past 2 years in turn were driven by exceptional lumber prices as illustrated in Chart 6.
In my March 2022 article, I considered that the past 2 years prices were not sustainable. This meant that in determining the Gross Profit margins over the cycle, we should exclude the 2021 and 2022 values.
Chart 6: Lumber Prices (TradingEconomics)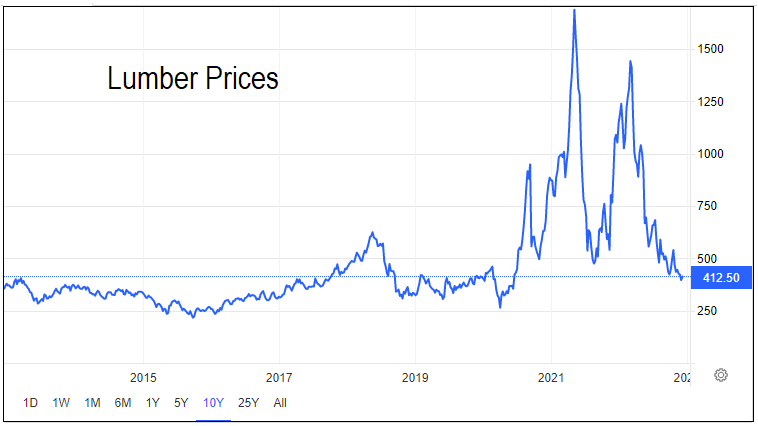
Financial strengths
Given the uncertainty about the duration and depth of the coming cycle, we would want companies to be financially strong going into a downtrend. This will enable them to be able to withstand the impact of a prolonged cycle.
I would consider BCC financially strong for the following reasons:
- Its current Debt Equity ratio is 0.3. This has reduced significantly from a high of 2.8 in 2012.
- Except for 2011, it had been able to generate positive Cash Flow from Operations every year for the past 13 years. On average, it generated USD 222 million of Cash Flow from Operations annually compared to its annual net income of USD 171 million.
- It has USD 867 million in cash as of the end Sep 2022.
- It has a cash conversion cycle that ranged between 1 to 1 ½ months.
BCC incurred losses in the downtrend of the last Housing Starts cycle (2005 to 2010). Its financial strength will ensure that it can withstand the impact of a downtrend.
I would add that in a downtrend with reduced revenue, the working capital would be reduced. In other words, BCC would generate cash from the reduction in working capital. This is another positive sign of its financial strengths.
Valuation of BCC
To determine the value of BCC, I first determined the Earnings Value under the 2 Scenarios. I then derived the expected intrinsic value by multiplying the respective values of each Scenario by the probability.
Based on the above, I estimated the expected intrinsic value of BCC to be
- EPV = USD 75 per share.
- Earnings value based on 4.6 % growth rate = USD 119 per share
Compared to the market price of USD 73 per share (8 Dec 2022) the is only a sufficient margin of safety if you valued BCC with growth.
Computation of Earnings Value
To estimate the Earnings Value of BCC, I used a single-stage Free Cash Flow to the Firm (FCFF) model of:
Value = FCFF X (1+g) / (WACC – g).
FCFF = EBIT X (1 – tax) X (1 – Reinvestment rate).
EBIT = Revenue X (Gross Profit margin – SGA margin).
To determine the Revenue, I looked at the cyclical Revenue obtained by scaling the 2020 Revenue with (1.5 / 1.38) where 1.38 was the 2020 Housing Starts.
g = growth = Reinvestment rate X Return.
Given g, we can estimate the Reinvestment rate = g / Return.
Return = EBIT X (1 – tax) / Total Capital Employed or TCE.
I estimated the TCE by determining the TCE/Revenue ratio X Projected Revenue.
WACC = weighted average cost of capital obtained from the first page of a Google search of the term “BCC WACC”. Refer to Table 1.
Table 1: Estimating BCC’s WACC (Various sources)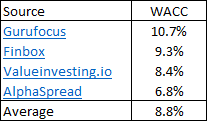
The key variables in the valuation models are the Gross Profit margin, SGA margin, and TCE/revenue. These would vary depending on the Scenarios:
Scenario 1. Based on the 2015 to 2020 averages.
Scenario 2. Based on the 2010 to 2020 averages.
The computation of BCC EPV based on these 2 scenarios is summarized in Table 2 below.
Table 2: Computing the EPV (Author)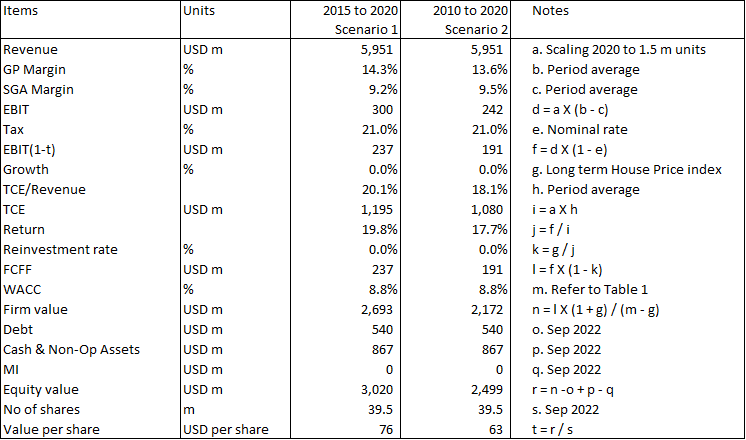
The Earnings Value with 4.6 % growth was similarly estimated.
Expected intrinsic value
The expected intrinsic value of BCC = probability-weighted average value. Table 3 summarizes the expected values of BCC
Table 3: Expected intrinsic values (Author)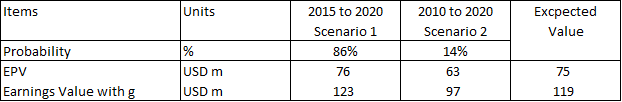
The market price of BCC as of 8 Dec 2022 was USD 73 per share. In my opinion, there is not a sufficient margin of safety based on the EPV. But there is a sufficient margin of safety for the case with growth.
You can see that the value of BCC per share under Scenario 1 is about 21% to 27 % higher than that under Scenario 2. This is due to the higher Gross Profit margin, SGA margin, and return. In other words, BCC was assumed to be more efficient under Scenario 1 (short duration and less severe trough).
Risks and limitations
In estimating the Earnings Value, I have made assumptions about the cash flows, discount rate and Housing Starts.
Cash Flows
I have assumed that the various metrics to compute the cash flows are linked to the cycle. I have shown that there is a 0.94 correlation between BCC revenue and Housing Starts from 2009 to 2021. But as can be seen from Chart 3, this is almost all in the uptrend part of the cycle.
Would the correlation be as strong if I had data to cover also the downtrend part?
The cyclical values would be better if I had computed them based on both the uptrend and downtrend parts. Unfortunately, there is not enough information for such an analysis.
In mitigation, if you look at Chart 5, the Gross Profit margin and SGA margin were relatively “stable” for most of the period ie 2013 to 2019. This gave me confidence that the values for the downtrend part of the cycle would not vary too much.
Secondly, in my growth estimates, I equated BCC’s growth with the growth in house prices. This assumes that the increase in house prices is linked to input cost increase. I am suggesting that even if BCC sales volume are constant (ie because there is no long-term growth in the units of Housing Starts) there is price growth. If you do not accept this, then you should just consider the EPV.
WACC
At the same time, the WACC was assumed to be 8.8 %. In deriving these, many of the sources used the current risk-free rate. The current Treasury rate is higher than historical rates. For consistency, since I am l using different periods for each of the Scenarios, I should also l use the WACC over similar periods. At the same time, I should also use the risk premium for the various periods.
Given the higher risk-free rate and risks currently, the WACC over the cycle would be lower. If I factor this in, the Earnings Value would be higher.
Housing starts
Finally, the values I have estimated for BCC is the value over the cycle. It assumed that over the long term, BCC’s average revenue would be USD 5.9 billion. To give you a sense of the scale, from 2010 to 2022, BCC’s average revenue was USD 4.4 b. Of course, the optimists will point out that the BCC 2022 LTM revenue was USD 8.5 billion.
My point is that my valuation is based on the Housing Starts reverting to the long-term annual average of 1.5 million units. The average Housing Starts from 2010 to 2021 was about 1.1 million units. If you accept my valuation, it means that you consider the past decade of Housing Starts to be an anomaly.
Conclusion
I have shown that BCC is financially sound. The issue then is whether there is any margin of safety based on its performance over the cycle.
The challenge is determining the values of the various metrics to represent the cyclical values. This is because there is uncertainty about the duration and the trough values of the cycle.
To overcome them I considered 2 Scenarios to derive the cyclical values. I then estimated the expected intrinsic value by factoring in the probability of the Scenarios.
My model implies that there is a sufficient margin of safety if you accept the following:
- BCC will continue to grow at 4.6 % per annum.
- There is no change to the long-term annual Housing Starts of 1.5 million.
Should you buy at the current price? If you believe in the strengths of the US economy, then you must believe that the Housings Starts would revert to the long-term annual average. If so, there is a margin of safety for BCC. Of course, this requires you to have a long-term perspective.
All valuation is based on peering into the future. I hope I have provided one perspective for taking all the above uncertainty into account when valuing BCC.
Editor’s Note: This article was submitted as part of Seeking Alpha’s Top 2023 Pick competition, which runs through December 25. This competition is open to all users and contributors; click here to find out more and submit your article today!
Be the first to comment