UK CPI Key Points:
- The Yearly UK CPI Decline to9.9% Annually, below a Consensus Forecast of 10.2%.
- UK Core CPI YoY Actual 6.3% vs Forecast 6.2%.
- Largest Upward Contribution came from Housing and Household Services.
The CPI and Forex: How CPI Data Affects Currency Prices
The Annual inflation rate in the UK surprised to the downside by beating estimates. The print is down from 10.1% in July to 9.9% in August with estimates at 10.2%. The largest contributors this month were from housing and household services (which includes electricity, gas and other fuels. Transport, food and non-alcoholic beverages remain major contributors as well.
Customize and filter live economic data via our DailyFX economic calendar
The print may have come as somewhat of a surprise, however I do not see the print having a material impact on the BOE policy moving forward. With another hike already priced in for next week the BOE has to keep up its hawkish trajectory or risk further downside for the Pound as well as rising inflation as gas shortages threaten power cuts in winter. Yesterday’s employment data saw worker shortages persist with demand cooling ever so slightly. Of interest to the Bank of England will be wage growth, which could push higher should the shortages continue which in turn would add to inflation woes. The only positive to come from the job numbers was the unemployment rate which came in at a new low of 3.6%, its lowest level since 1974. Thus, on the face of it the numbers may appear okay yet the drop in unemployment seems to have been driven by a rise in those classified as inactive. The workers classified as long-term sick has risen at a startling pace with a 150000 being added in the last two months. The Bank of England is in a tough spot as the US Federal Reserve looks set to continue its hiking cycle following yesterday’s CPI print while the ECB delivered a jumbo rate hike last week.
Starts in:
Live now:
Dec 31
( 10:12 GMT )

Recommended by Zain Vawda
Becoming a Better Trader in Current Markets
Market reaction
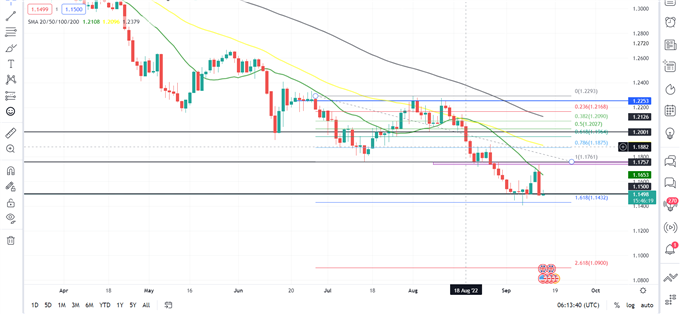
GBPUSD Daily Chart
Source: TradingView, prepared by Zain Vawda
Initial reaction was relatively muted with a 10pip spike higher for GBPUSD before pulling back and looking to push lower. Yesterday’s US CPI print has brought dollar bulls back to the fore, with any upside move for the GBPUSD seeming less likely with a huge bearish engulfing candle close hinting at further downside. We rallied on Monday and yesterday toward resistance area at 1.17500 as the CPI news broke and have since posted declines with YTD lows now in sight. We currently trade below the 20,50 and 100-SMA’s with a downward sloping gradient supporting further weakness in the pound. Should we take out YTD lows targets rest at 1.12000 followed by the 2.618 fib level at around 1.0900.
Key Intraday Levels Worth Watching:
Support Areas
Resistance Areas
Introduction to Technical Analysis
Learn Technical Analysis
Recommended by Zain Vawda
— Written by Zain Vawda for DailyFX.com
Contact and follow Zain on Twitter: @ zvawda


Be the first to comment