da-kuk
Written by Nick Ackerman, co-produced by Stanford Chemist. This article was originally published to members of the CEF/ETF Income Laboratory on August 2nd, 2022.
BlackRock Enhanced Global Dividend Trust (NYSE:BOE) is quite similar to its sister fund, BlackRock Enhanced Equity Dividend Trust (BDJ). Both funds utilize a covered call strategy while investing in primarily large-cap equity names. The difference with BOE is that the fund has a tilt towards global exposure. Just over 50% of the fund’s exposure is outside of the United States.
This global weighting has meant an underperformance in terms of total returns compared to BDJ over the last decade.
Ycharts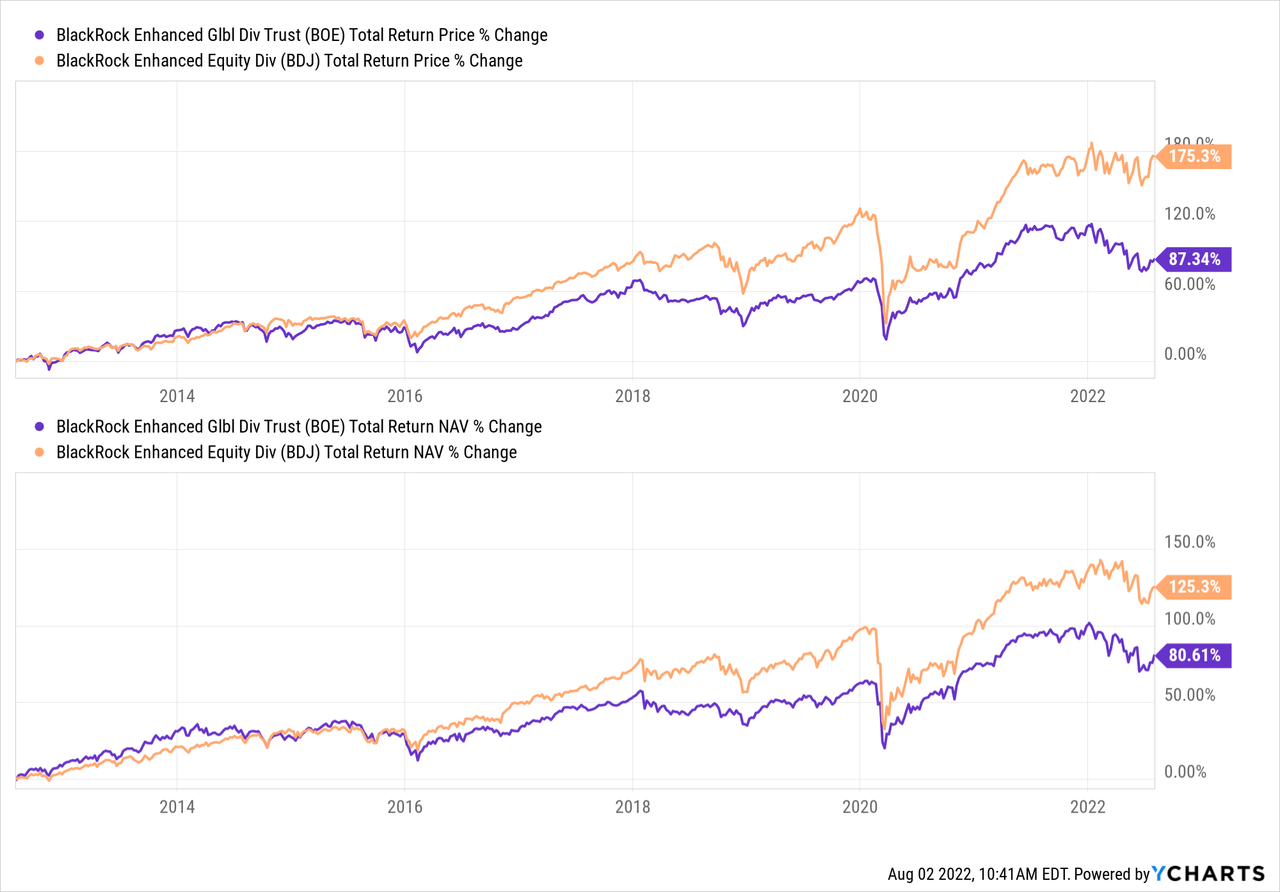
That was even considering that BDJ tilts more into financial and healthcare stocks. BOE is tilted a bit more towards tech as its heaviest weighted allocation. Despite the significant outperformance of growth over value in the last decade, we can still see BOE has lagged meaningfully.
I hold both funds, and while it’s easier to look back and judge a fund simply on past returns, I don’t find that appropriate. I think that valuation and current circumstances are more important. In fact, U.S. stocks have been outperforming their international counterparts for most years in the last decade. That isn’t always the case, though. There have been periods where this has been reversed.
U.S. Vs. International (BlackRock)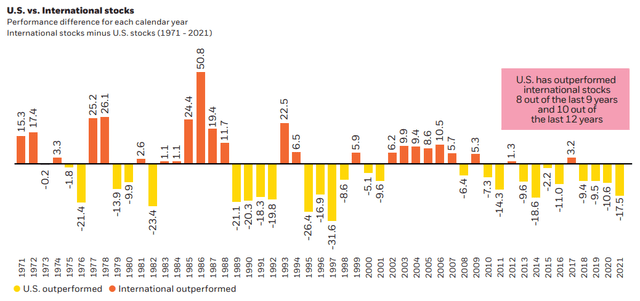
The valuations are definitely in favor of global stocks at this time, too. That could result in global stocks performing better over the next decade.
Valuations Around The World (RBC)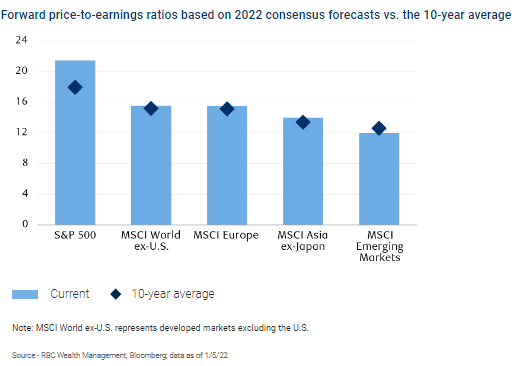
The caveat that I would include here is that it will necessarily play out that way. This is especially true as Russia has sort of set back itself and the rest of Europe in terms of economic growth.
That’s why I find that BOE is still worthwhile having in my portfolio. BDJ is a larger position for me and has certainly been a much better performer, but valuation and diversification are important to me. Of course, equities being down across the board also create a longer-term opportunity.
The Basics
- 1-Year Z-score: -0.76
- Discount: -11.01%
- Distribution Yield: 7.30%
- Expense Ratio: 1.07%
- Leverage: N/A
- Managed Assets: $744.6 million
- Structure: Perpetual
BOE has an investment objective to “provide current income and current gains, with a secondary objective of long-term capital appreciation.”
They intend to achieve this through:
“investing in at least 80% of its net assets in dividend-paying equity securities and at least 40% of its assets outside of the U.S. The Fund may invest in securities of companies of any market capitalization but intends to invest primarily in securities of large-capitalization companies. The Fund generally intends to write covered put and call options with respect to approximately 30% to 45% of its total assets. However, the percentage may vary from time to time with market conditions.”
They focus on writing options on individual stocks in their portfolio. The fund last reported that the portfolio was 43.29% overwritten at the end of June. That is on the higher end of their 30 to 45% target. That could suggest they are more defensive at this time. Having more of a portfolio overwritten could suggest that they don’t foresee these positions being called away.
The fund’s expense ratio comes in at 1.07%, which is reasonable when compared to other closed-end funds. BOE has no leverage to be concerned with on the fund level, which can be another benefit during a volatile time. This is especially true when we have a volatile period of 2022 that is being driven by rising rates. Rising rates can work against leveraged funds because their borrowing costs will usually rise.
Performance – Widened Discount Relative To Its Historical Range
I showed a bit on the performance above relative to BDJ. With results such as that, it isn’t hard to imagine that the historical results across the usual timeframes aren’t showing results that will blow you away. In fact, most investors would probably see them as pretty mediocre.
BOE Annualized Returns (BlackRock)
While I can’t argue with the past results being rather disappointing, I’d say that going forward could be different. We might have already seen some glimmer of hopes in that, with the fund performing slightly better than the S&P 500 as measured by (SPY) on a YTD basis.
I’ve also included BDJ in the chart, as that fund has done even better this year. I’d say that’s thanks to its more defensive tilt towards healthcare and even financials performing better than tech. Remember, BOE has a tilt towards more tech.
Ycharts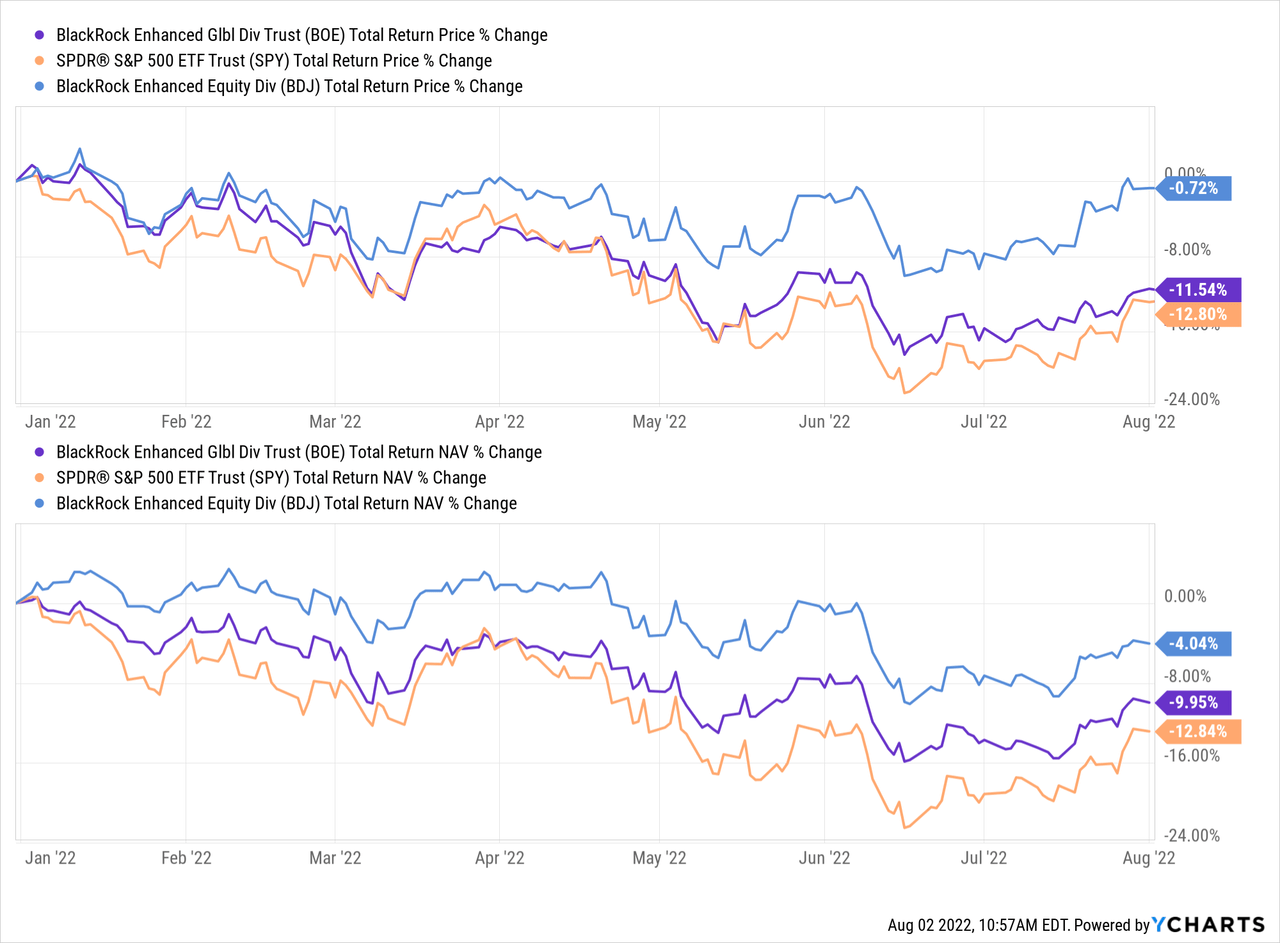
SPY isn’t necessarily an appropriate benchmark because it doesn’t utilize any options strategy. However, it can provide some context of how the fund is performing this year. Additionally, BOE is an investment vehicle designed to provide regular distributions to investors.
Another factor to consider is that BOE is attractively priced at a fairly deep discount. Relative to BDJ, it’s at a deep discount but based on its own history, it isn’t quite as deep of a discount as it might first appear. Instead, it is right around its decade-long average. That makes it an interesting buy at this time if you also consider the overall equity declines we’ve seen this year and the international valuations.
Ycharts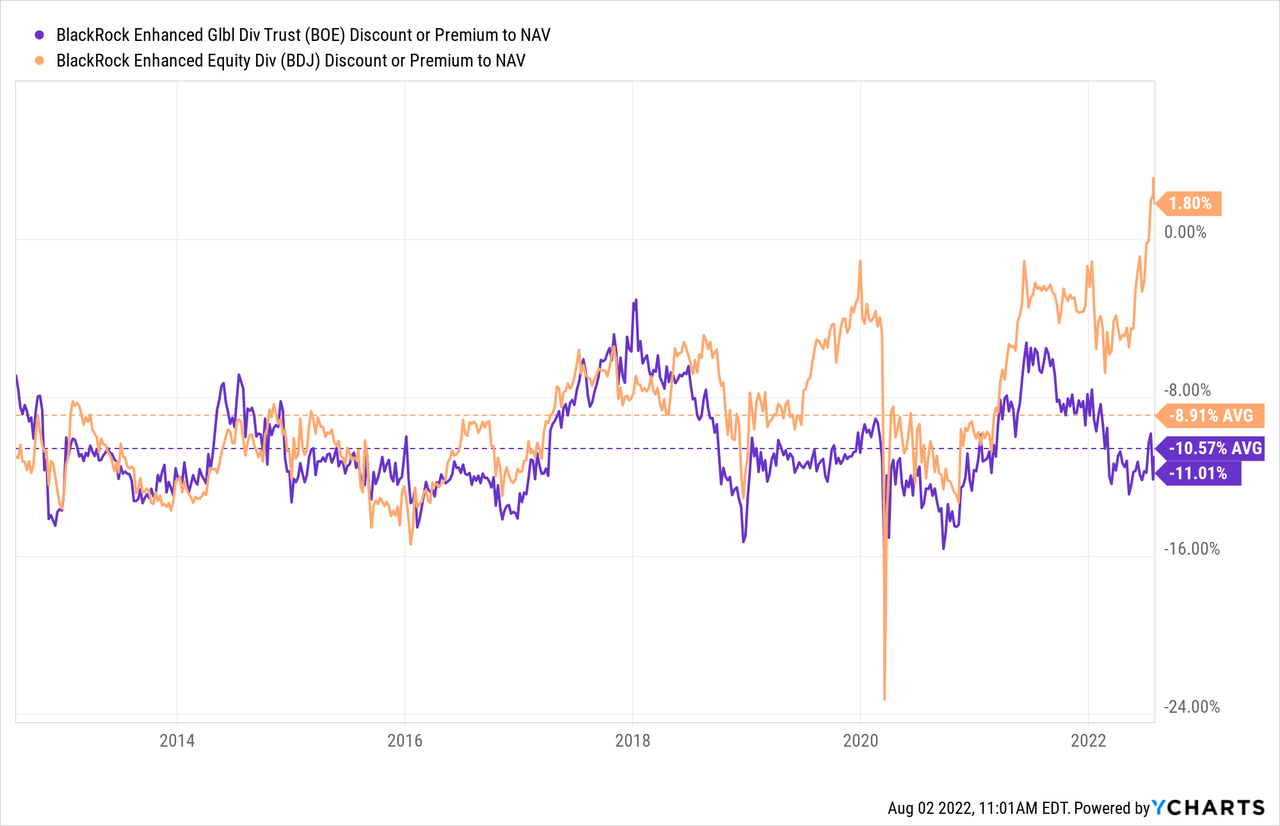
Distribution – Attractive Monthly Payout
At this time, the fund’s distribution yield comes to 7.30%. On a NAV basis, it works out to 6.50%. An interesting point worth calling out is the meaningful difference in what the fund pays investors and what the fund has to earn to pay investors. For BOE, since it’s at such a wide discount, the fund can earn significantly less while investors receive more.
BOE Distribution History (CEFConnect)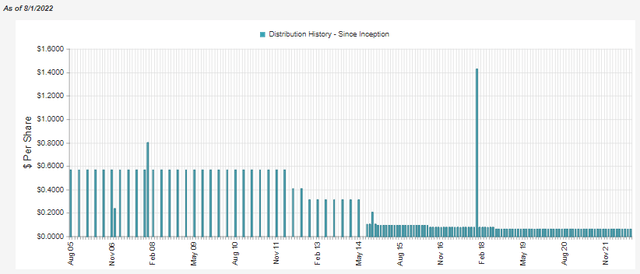
The fund has had several cuts over its history. Again, I’d say it’s mostly related to the relatively underperforming international exposure that the fund carries. This trend is also likely to push away investors.
To cover this distribution, the fund will require a sizeable amount of capital gains. During a down year, those can be more difficult to come across. That could result in some destructive return of capital in its payout.
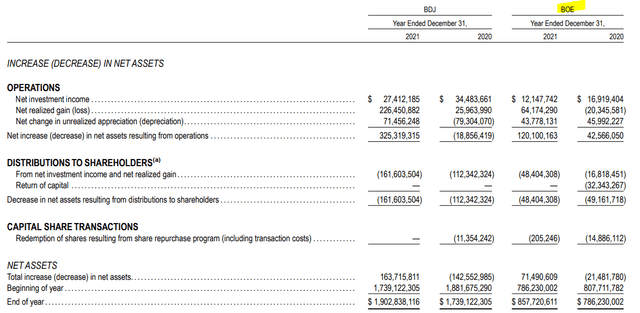
At the same time, at the end of 2021, the fund was sitting on nearly $171 million in unrealized appreciation in the fund. Some of these would have been from last year, which was a strong year for the fund. That has since come down, but these embedded gains in positions over the years could be sold to fund the distribution with capital gains. That can still happen, even in a down market.
That’s why judging a distribution for an equity closed-end fund becomes more difficult. In particular, when there is a challenging year. At the end of the day, a closed-end fund (“CEF”) can pay out whatever it wants for as long as it wants to. Up until the point that NAV reaches $0, of course.
Based solely on the current NAV distribution yield, it would suggest that no cut would be necessary. That doesn’t mean that we won’t see any cuts, though.
For 2021, the fund reported that most of the distribution that was paid out was considered non-qualified dividend income.
BOE 2021 Tax Classification (BlackRock)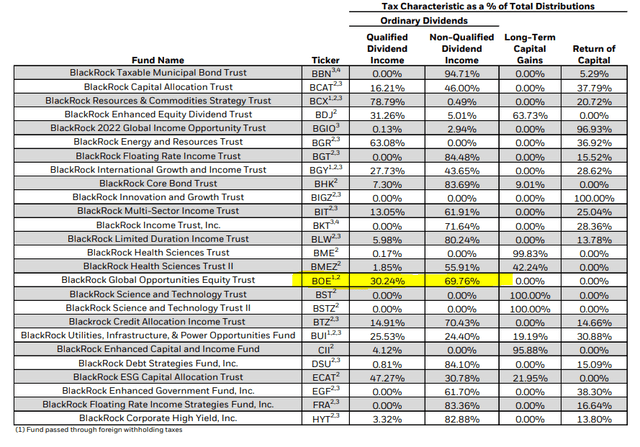
That’s quite the change from the prior year. 2020 showed that a large portion was long-term capital gains and then qualified dividend income.
BOE 2020 tax Classification (BlackRock)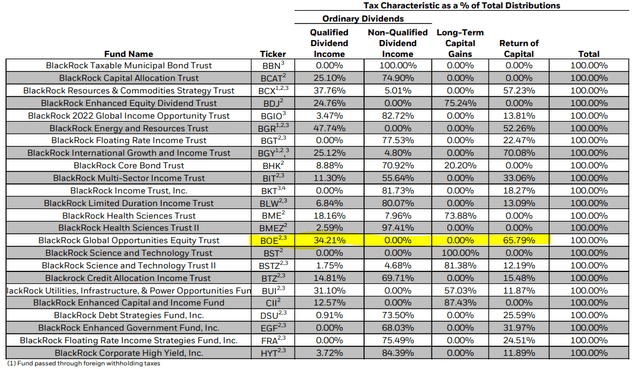
This also highlights the challenges in holding a CEF when you are a tax-sensitive investor. If you hold in a taxable account and a small adjustment in tax classifications can change your tax situation meaningfully, I’d almost suggest not utilizing CEFs. These classifications can change drastically from year to year. This is simply just one example.
Throughout the year, funds provide section 19a press releases. They are simply just estimates. These are required if a fund believes that any part of the distribution will come from any source other than income. I’ve found that these can change drastically by year-end too, which is why I personally don’t even look at them.
This is particularly true for equity funds. An equity fund’s situation can change drastically if, on the last day of the tax year, they decide to realize a ton of gains. At the same time, they could have been estimating throughout the entire year that return of capital was going to be significant. Since these are actively managed funds, the situations can change daily.
BOE’s Portfolio
At this time, the largest weighting of the portfolio is in U.S. positions. This is common, even for “global” funds.
BOE Geographic Allocation (BlackRock)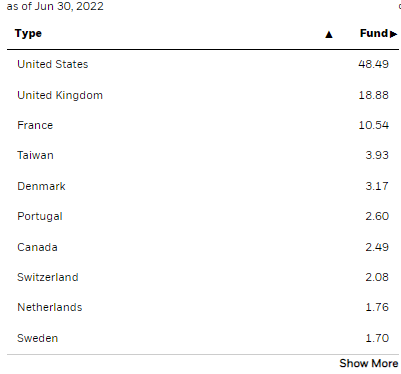
In this case, the U.K. and France make up fairly meaningful allocations. In our previous update, that was also the case even with the fund’s 65% turnover rate that they reported. 65% doesn’t make it the most active fund, but it does mean they are also fairly active.
Despite this, the overall weightings in the portfolio stay rather static. That suggests they are moving around positions within the same countries and sectors. The sector weightings also look fairly similar to our last update, which looked at the position at the end of February 2022.
BOE Sector Allocation (BlackRock)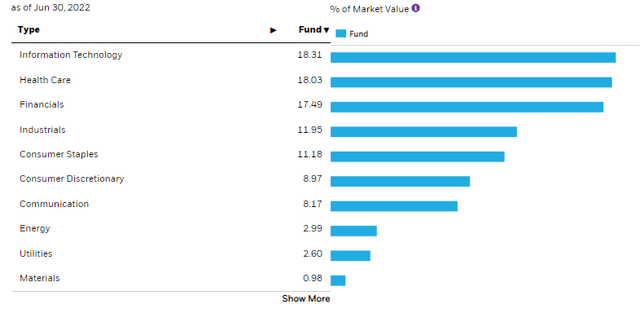
Tech allocation only slid down a bit from the 20.85% weighting it was previously. That could have simply been normal market gyrations due to underperforming tech since that time relative to the rest of the sector weightings in the fund. I believe that to be the case because the top ten holdings haven’t changed drastically since that previous update either.
Microsoft (MSFT) and Sanofi (SNY) make up the top two spots, as they previously did. Other positions had moved around some, and UnitedHealth Group (UNH) and AbbVie (ABBV) have made their way into the top ten. On the other hand, Medtronic (MDT) and Telus (TU) are not appearing in the top spots anymore. That change only appears to be due to UNH and ABBV performing much better relative to MDT and TU.
Ycharts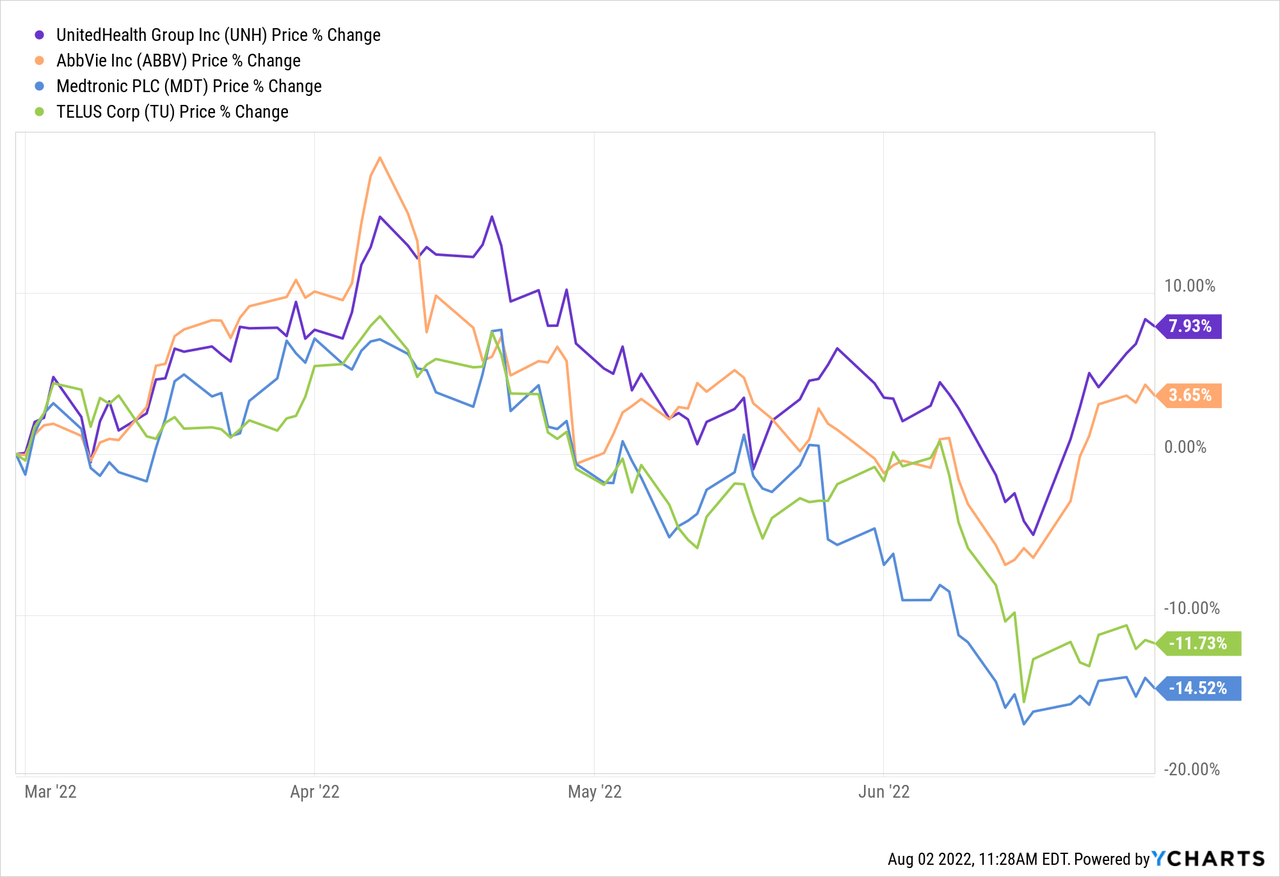
We’ll get a better look at positioning in specific positions when BlackRock posts the consolidated semi-annual report. That should be available in the early parts of September. I would suspect that MDT and TU are still positions being held in the fund, though.
Conclusion
BOE is a fairly straightforward fund invested primarily in large-cap equities. The fund has a covered call strategy with a global tilt in its positioning. Global positions remain cheap relative to U.S. investments. While U.S. investments have outperformed for several years in a row, and for most of the last decade, that isn’t always the case historically. Given the discount on BOE and the overall market declines, BOE seems to be in a fairly attractive position. That is, if an investor is looking for more international exposure.



Be the first to comment