

GOLD OUTLOOK
- Gold prices under pressure in spite of fading dollar.
- Crude oil finds support.
- U.S. inflation in focus later today.
XAU/USD FUNDAMENTAL BACKDROP
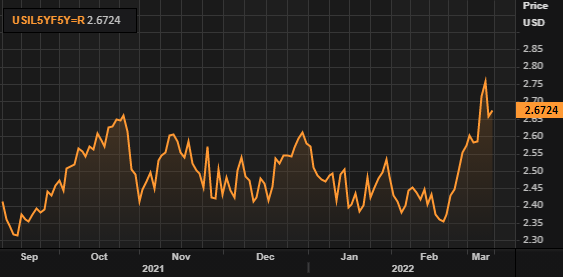
Spot gold tracked lower crude oil prices yesterday but has since pulled back some lost gains after the UAE expressed its unwillingness to budge on the OPEC+ supply agreement. Traditionally, higher oil prices point to upward pressure on inflation which in turn plays into the hands of the yellow metals “inflation hedge” characteristic that many investors look for. The dip in expected inflation after the fall in oil prices is evident by the chart below. The 5Y5Y forward inflation linked swap is often used as a preferred metric over breakeven inflation rate as it accounts for any adjustments from Fed quantitative easing.
USD 5 YEAR BY 5 YEAR FORWARD INFLATION LINKED SWAP:
Source: Refinitiv
The safe-haven allure for gold is maintained despite the markets assimilation with commodity supply shocks and will be a driving force for bullion as the war in Ukraine persists. Rising US Treasury yields coupled with falling inflation expectations add to increasing real yields (across maturities) leading to gold weakness. Not even a weakening dollar (historically inverse relationship) has been able to come to gold’s aid but with geopolitical tensions being so volatile, gold upside is not out of the picture.
ECONOMIC CALENDAR
The economic calendar holds some high impact events including headline and core inflation data. Both prints are expected to release higher than January’s numbers and could add to hawkish pressure should this come in line or beat estimates. Jobless claims should not be overlooked either after positive JOLTs job openings data yesterday, we could see support for a stronger dollar, resulting in added strain on gold prices.
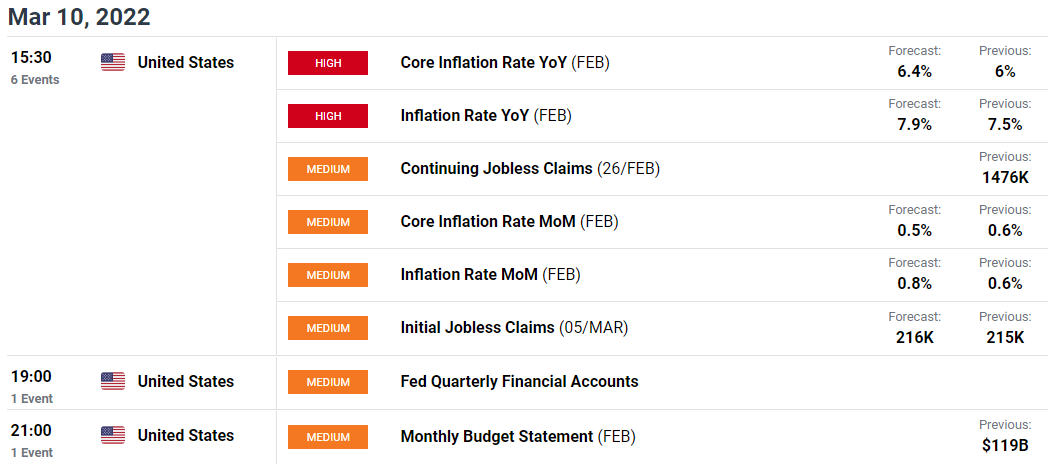
Source: DailyFX Economic Calendar
TECHNICAL ANALYSIS
GOLD PRICE DAILY CHART
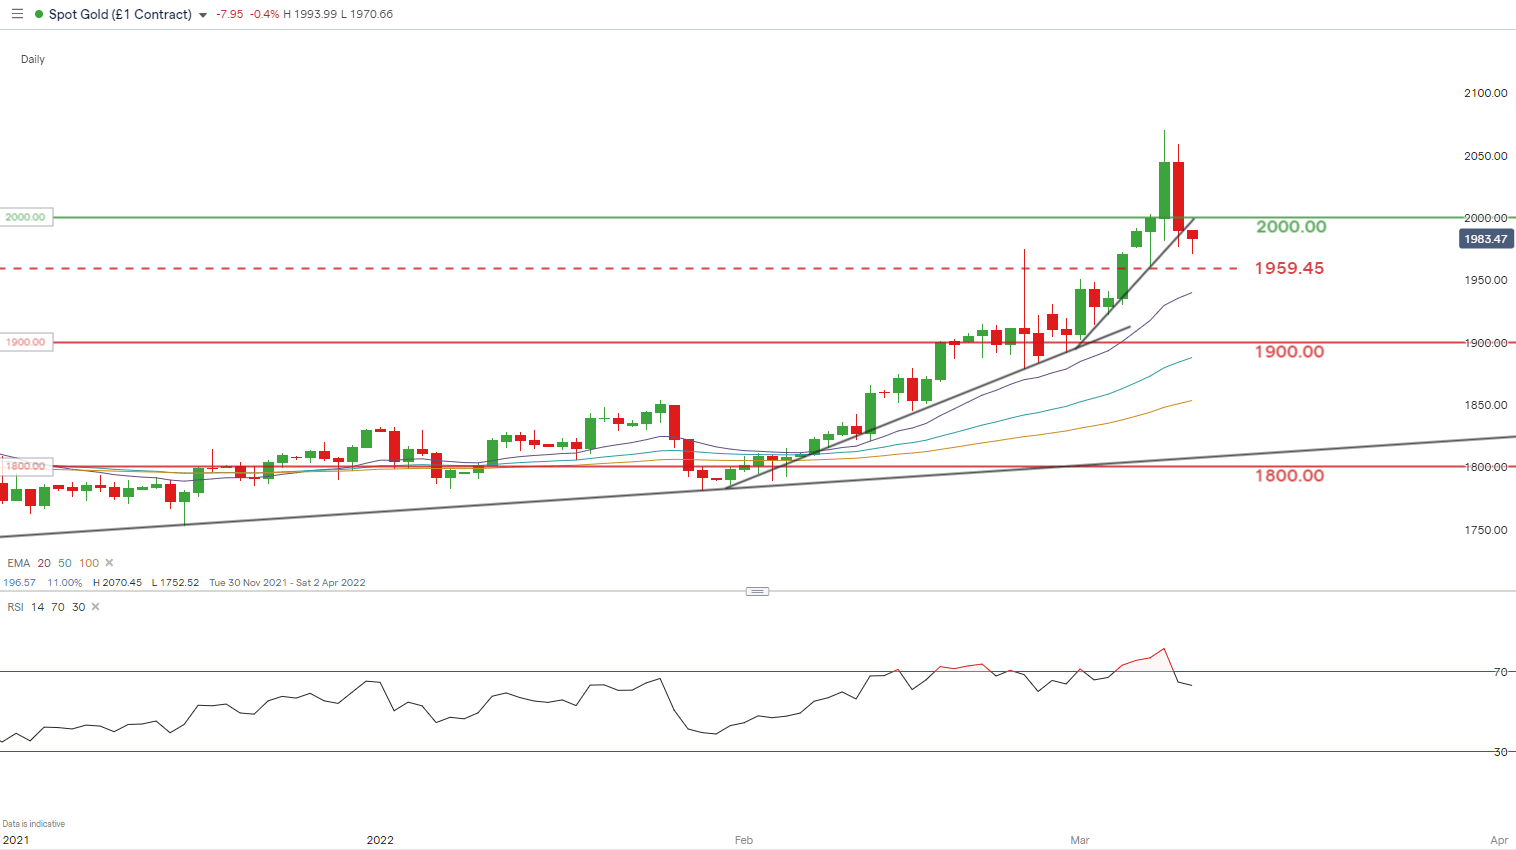
Chart prepared by Warren Venketas, IG
Steepening trendlines (black) and increased volumes can often lead to what is termed as a blow-out top in technical analysis. This could be unfolding on the daily spot gold chart. However, it can be difficult to spot a turnaround over a pullback. I think calling the reversal now is premature as geological tensions remain prevalent despite some easing from yesterday. Bullion is likely to remain elevated as long as the war continues leaving the $2000 psychological level open for another advancement.
Price action has been extremely extended to the upside as evident from the overbought RSI, coinciding with the corrective move lower. The trend remains firmly positive supported by gold prices trading above all EMA levels rendering a reversal much more risky. The pullback has further room to move towards the $1959.45 support swing low after which one of two things could occur:
- A break below $1959.45 (catalysed by some fundamental or news data) sparking preference towards a blow-off top reaction.
- Bulls find support at $1959.45 and push prices back up towards the $2000 handle.
Resistance levels:
Support levels:
- 1959.45
- 20-day EMA (purple)
- 1900.00
IG CLIENT SENTIMENT FAVORS SHORT-TERM DOWNSIDE
IGCS shows retail traders are currently distinctly long on gold, with 72% of traders currently holding long positions (as of this writing). At DailyFX we typically take a contrarian view to crowd sentiment resulting in a bearish bias.
Contact and follow Warren on Twitter: @WVenketas
Be the first to comment