

Bitcoin Price Chart, Ethereum, Ripple, BTC/USD, ETH/USD, XRP/USD – TALKING POINTS
- Bitcoin retreated from October high and may be in danger of bearish correction
- Ethereum trading below descending resistance ETH/USD eyes January uptrend
- Ripple has broken below a month-long uptrend and is approaching key support
BITCOIN PRICE CHART
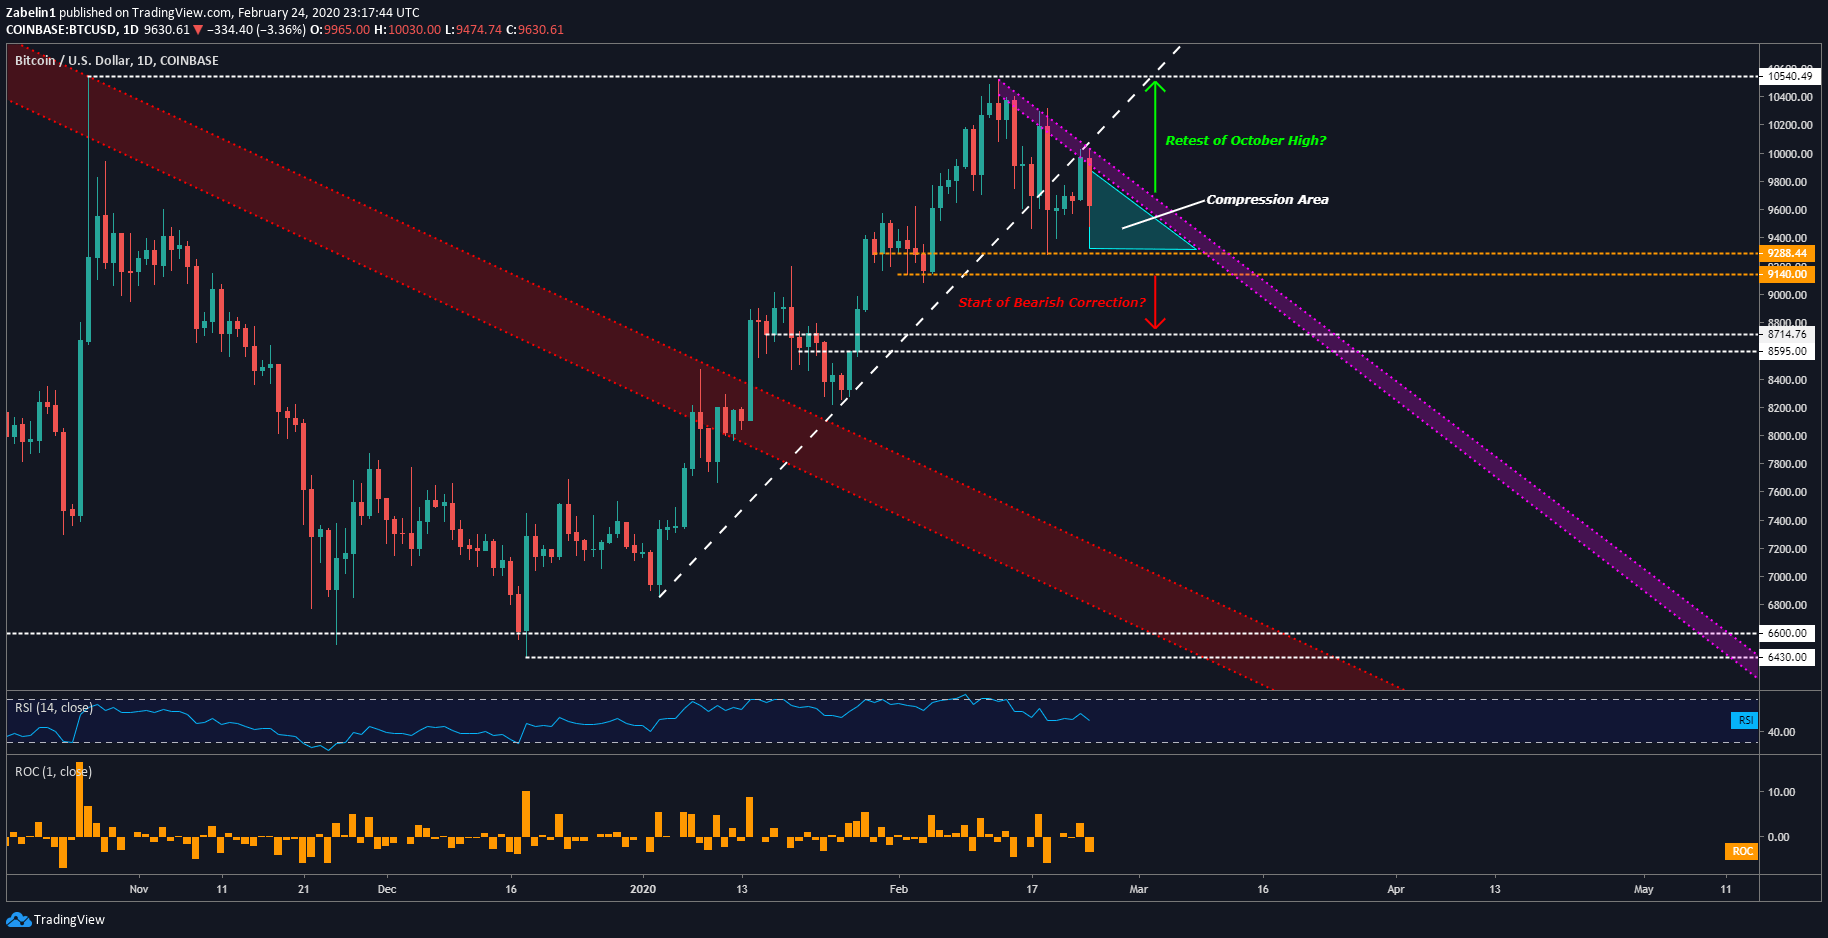
BTC/USD has retreated from the October-high at 10540.49 and is now trading below a newly-established descending resistance channel. Bitcoin may now start getting squeezed between the slope of depreciation and support at 9288.44. In the process of coiling up, if BTC/USD springs higher and shatters resistance, the pair may aim to retest 10540.49. Conversely, capitulation and a downside breakout could precede a more aggressive decline.
BTC/USD – Daily Chart
BTC/USD chart created using TradingView
ETHEREUM FORECAST
ETH/USD is in a similar situation to that of BTC/USD insofar that the pair reached a multi-month high and subsequently wilted and both are now trading under descending ceilings. Looking ahead, ETH/USD may continue to trade below the downward-inclined slope may aim to retest the January uptrend. However, the pair may bounce around in the compression zone (labelled as “A”) before turning lower.
Conversely, ETH/USD may push higher and break resistance but may then find itself in another similar dilemma in the area labelled as “B”. The pair may then flirt with retesting the multi-layered ceiling between 286.27 and 290.00. If they are able to surmount resistance, it could revitalize bullish sentiment. However, if they capitulate and shatter the uptrend along the way, it could be the start of a short-term bearish correction.
ETH/USD – Daily Chart

ETH/USD chart created using TradingView
RIPPLE OUTLOOK
Ripple is up almost 50 percent year-to-date, but its gains may be at risk. XRP/USD recently invalidated the January uptrend and the pair is now flirting with testing the upper layer of the 0.2398-0.25458 support zone. If broken, the pair may trade sideways within that range before breaching the lower-tier with follow-through. The latter scenario may precede a decline until around 0.2196 where selling pressure may start abating.
XRP/USD – Daily Chart
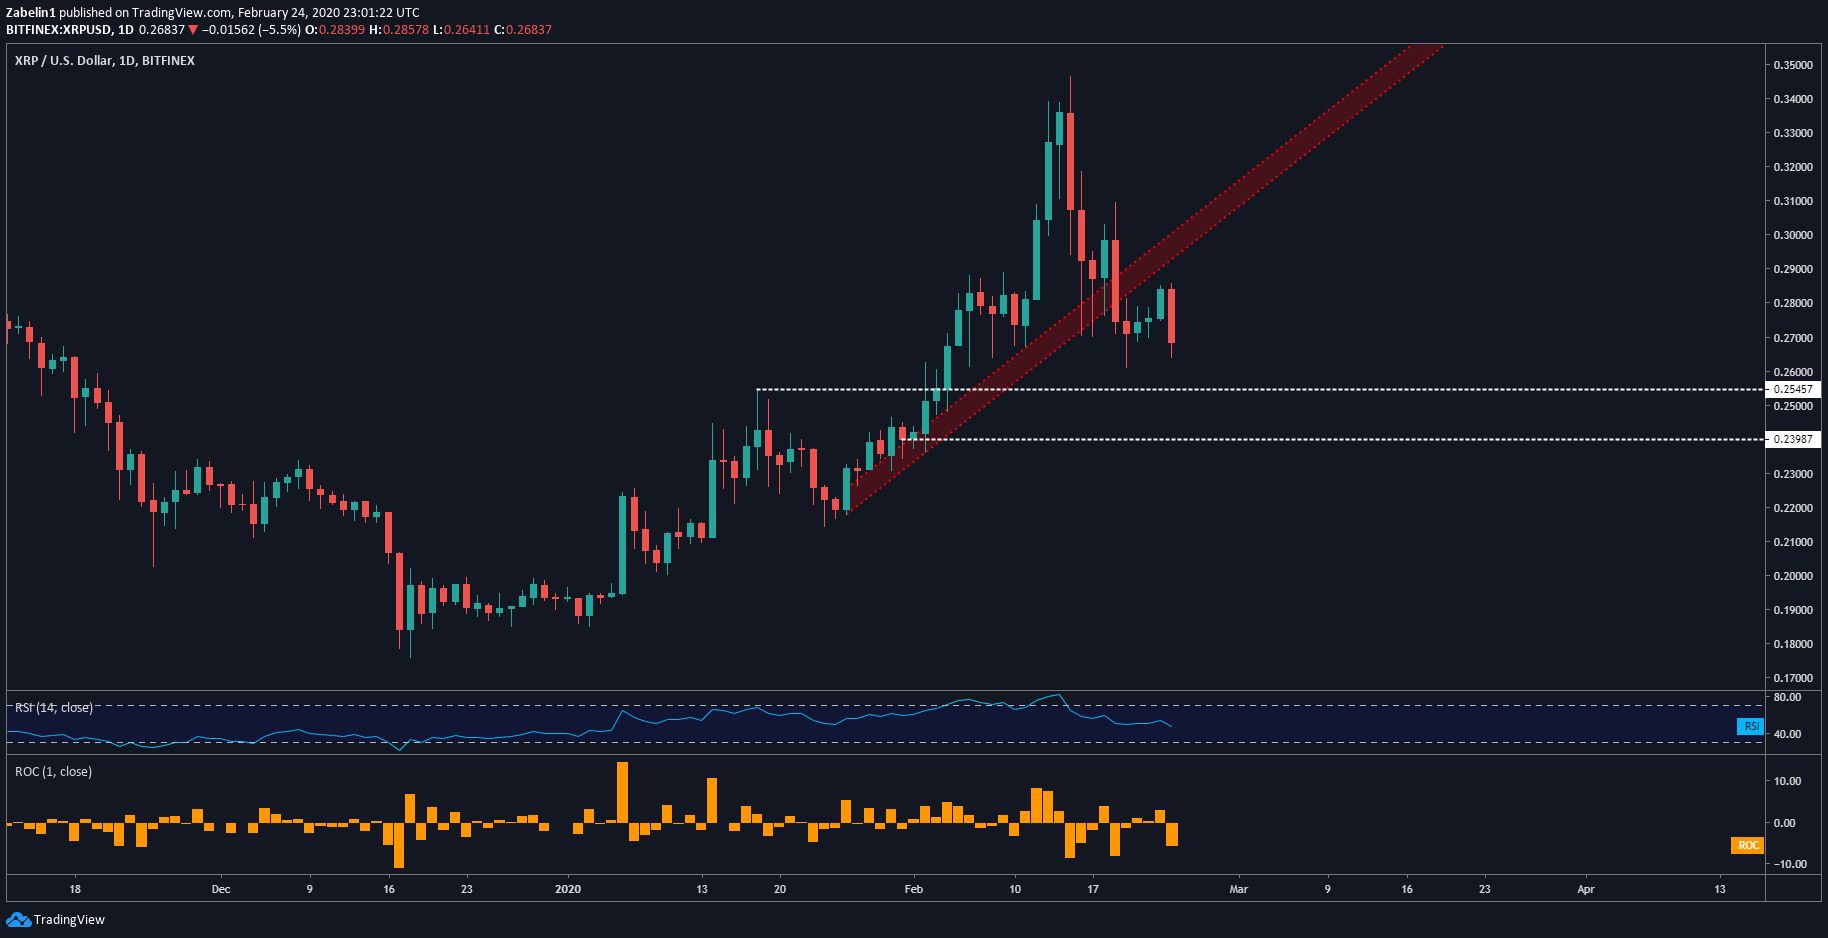
XRP/USD chart created using TradingView
BITCOIN TRADING RESOURCES
— Written by Dimitri Zabelin, Jr Currency Analyst for DailyFX.com
To contact Dimitri, use the comments section below or @ZabelinDimitrion Twitter
Be the first to comment