

Key Talking Points:
- BTC/USD was signalling at increased bearish pressure before a sudden 11% surge this morning
- Find out what levels to look out for as BTC/USD recovers volatility
VOLATILITY SHIFTS TO EQUITIES
After a few very busy weeks at the start of the new year, Bitcoin has taken the backseat in the last few days as investors piled into US shares, shifting volatility towards equity markets. The impressive surge of single-name equities like GameStop and AMC entertainment caught the attention of many traders looking for rapid gains, taking the attention away from cryptocurrencies for a few sessions.

Recommended by Daniela Sabin Hathorn
Trading Forex News: The Strategy
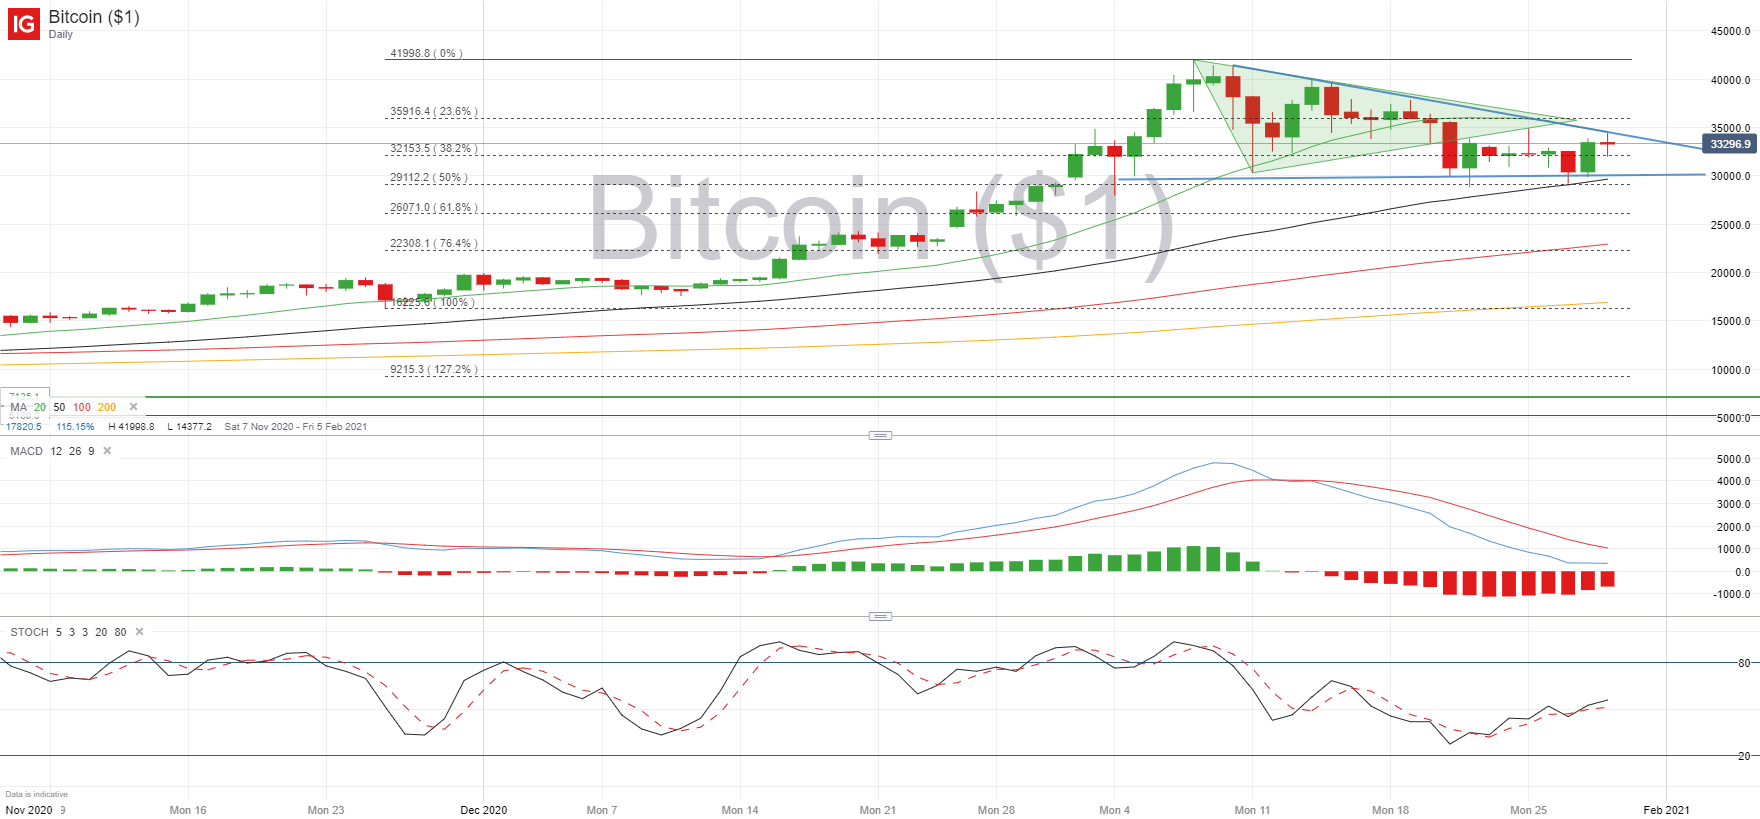
Whilst away from all the attention, Bitcoin price has been consolidating after breaking below the symmetrical triangle, and now seems trapped below the 35,000 mark and the 50% Fibonacci (29,112) from the 16,000 – 42,000 surge. This range is also marked by the 20-day and 50-day simple moving averages, strengthening their potential to act as support and resistance levels.
Trading interest seems to have returned to cryptocurrencies as many of the companies targeted by retail traders in the last few days have faced trading restrictions, leaving investors looking for other sources volatility, although retail investors now have limited influence over the price of Bitcoin.
BITCOIN LEVELS
The key area to look out for now is the 30,000 mark, where price has been able to find support since the beginning of January. But there have been various attempts to break below and a succession of lower highs is now threatening to bring BTC/USD below this level as a descending triangle pattern could be coming to an end.
Momentum indicators are somewhat mixed given the lack of momentum in Bitcoin in the last few days, but the MACD is deeply in the red whilst the Stochastic is placed in the middle of the range, signalling there is room to move in either direction. In order to see upside potential BTC/USD would need to invalidate the descending trendline and finish the week above 34,500, signalling that buyers are regaining control. If not, we may see price break below 30,000 and head lower with the next significant support level coming up at 26,000.
BTC/USD Daily chart

Recommended by Daniela Sabin Hathorn
Top Trading Lessons
ELON MUSK STEPS IN
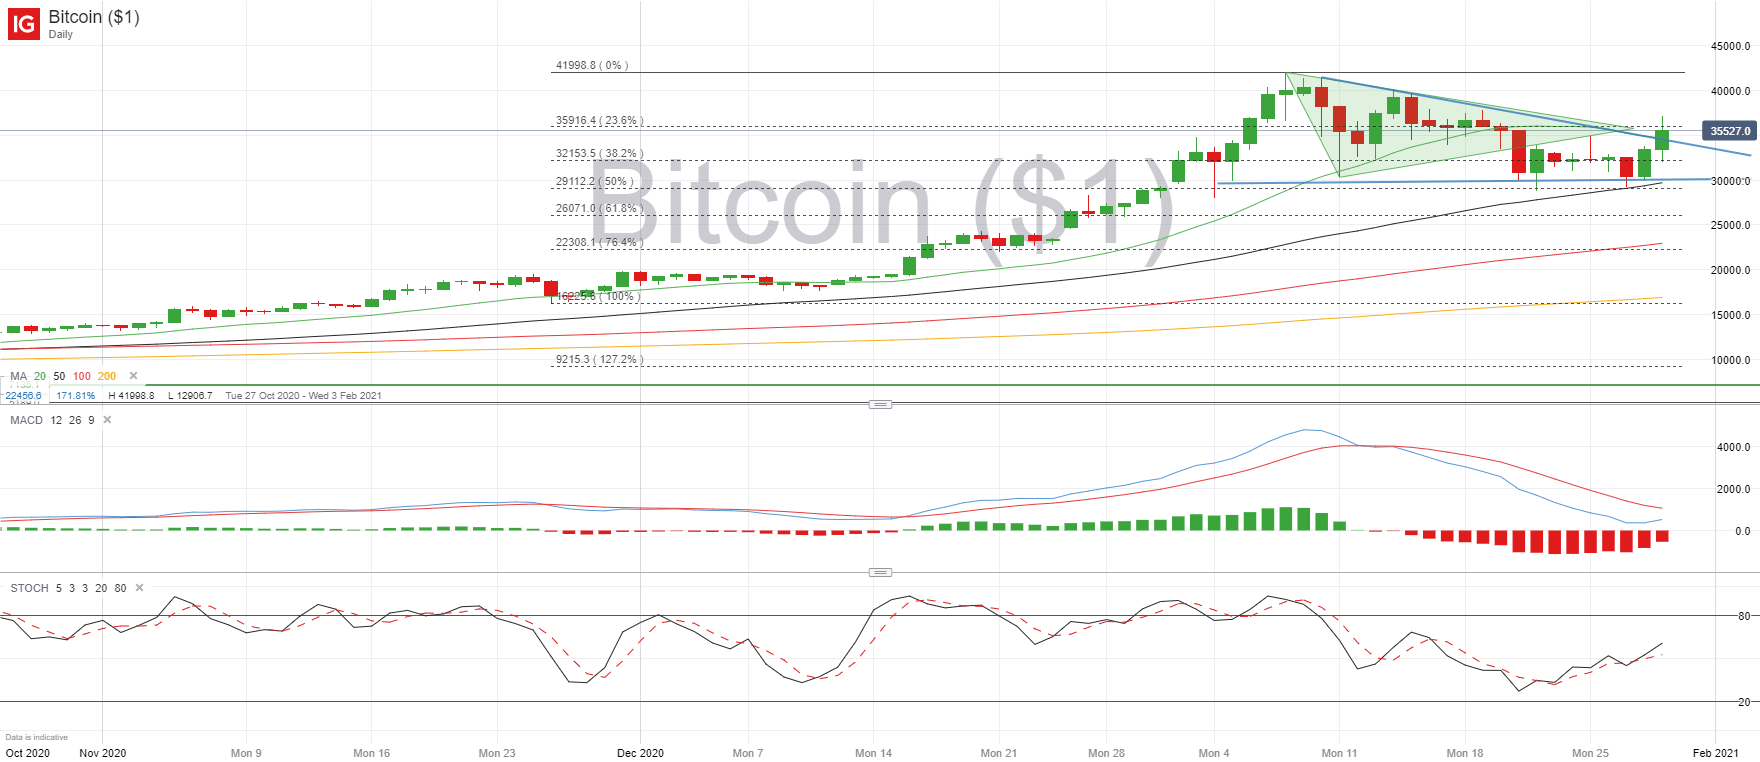
So what you’ve read above is the analysis I was concluding before Bitcoin suddenly shot up 11% in 15 minutes just before 9am GMT, after what seems like an endorsement from Elon Musk about the cryptocurrency, which he added with a hashtag to his Twitter bio.

Another glance at the daily price chart and we can see that BTC/USD has in fact broken above the descending trendline which I had mentioned just minutes ago as the level to watch out for further gains. I still believe this level is of significance, and if price remains above this level throughout the day then we might see a weakening of this bearish case for Bitcoin. Then again, a fall below this level will be an even stronger signal that bears are taking control and aiming for a break below 30,000.
BTC/USD Daily Chart
Learn more about the stock market basics here or download our free trading guides.
— Written by Daniela Sabin Hathorn, Market Analyst
Follow Daniela on Twitter @HathornSabin
Be the first to comment