

Bitcoin (BTC) and Ethereum (ETH) Charts and Analysis
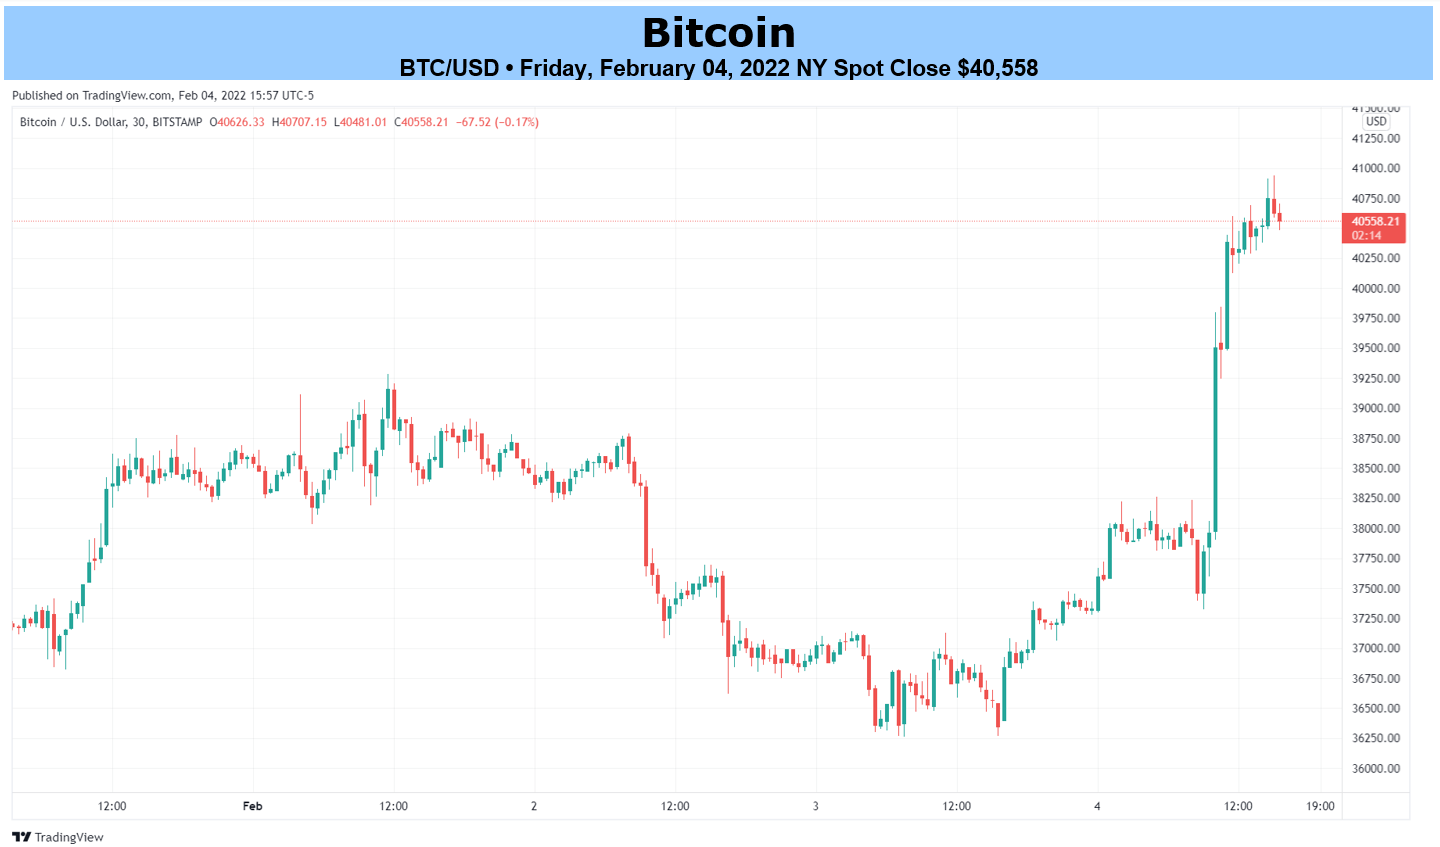
- Cryptocurrencies hit by US good news means bad news theory.
- Bitcoin trying to break the important $39.6k barrier.
The latest look at the US jobs market shows companies continue to hire at a rapid pace despite fears that Omicron would curtail business activity. The January NFP figure beat market expectations by a wide margin, while the December number was revised sharply higher. On balance, nearly one million jobs were created in the last two months.
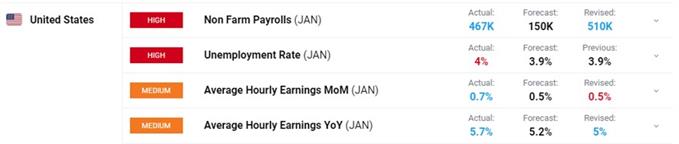
With the Federal Reserve already set to tighten monetary conditions, today’s good news will be seen as bad news for financial markets as it gives the central bank more room to hike rates faster and higher as it seems the job market is powering ahead. And with cryptocurrencies currently in step with other risk markets, it may be harder for the space to move higher.
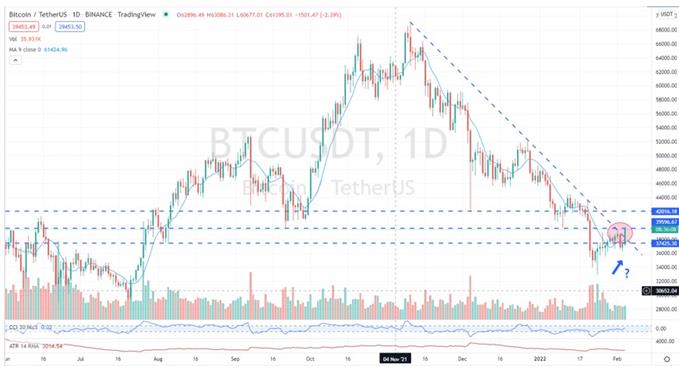
Bitcoin (BTC) sits at an interesting chart point with a prior low providing horizontal support while a descending trendline from the mid-November high is providing dynamic resistance. This situation is likely to break soon as the two lines intersect. A break higher sees $39.6k back in play followed by $42k, both influential levels, while a move lower would bring recent prior lows back into action ahead of $33k.
Bitcoin Daily Price Chart – February 4, 2022
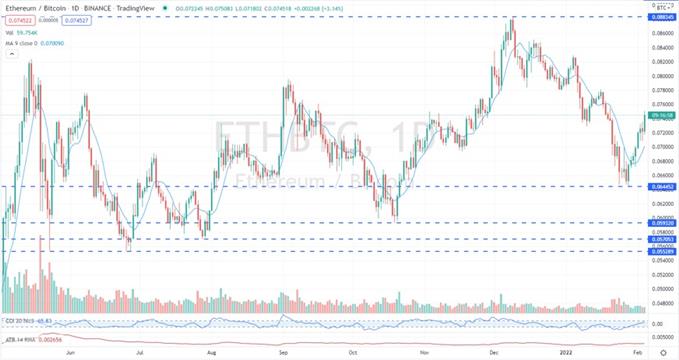
Ethereum is trying to push higher and has out-performed Bitcoin over the last week, pulling back around 40% of the sell-off in the Ether/Bitcoin spread seen since early December. A move higher in the spread has historically paved the way for the altcoin market to rally. The spread needs to break and close above the January 16 swing low around 0.7820 to allow further upside.
Ethereum/Bitcoin Spread – February 4, 2022
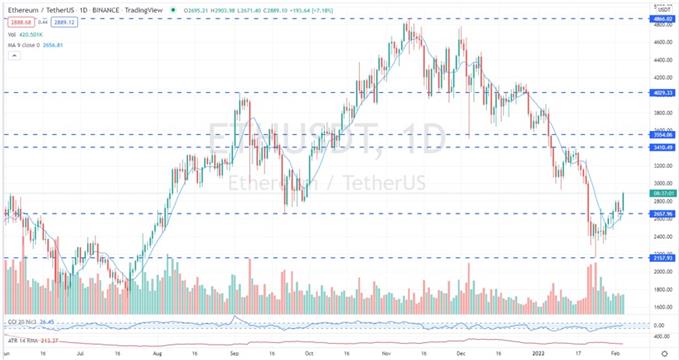
Ethereum, while strong against Bitcoin, is still struggling to pare back the substantial losses seen since the early November high just under $4,900. The daily chart shows an ongoing series of lower highs since the ATH was made with Ethereum needing to close above the $3,400 area to break this trend. It does look like the series of lower lows has been broken which may help Ethereum turn further higher. The recent $2,157 low print may hold for some time if it is tested.
Ethereum Daily Price Chart – February 4, 2022
All Charts via TradingView
What is your view on Bitcoin and Ethereum – bullish or bearish?? You can let us know via the form at the end of this piece or you can contact the author via Twitter @nickcawley1.
Be the first to comment