

Martin Barraud/OJO Images via Getty Images
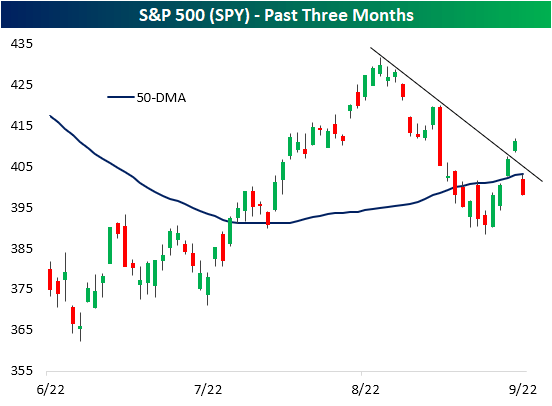
Headed into Tuesday, the S&P 500 (SPY) had been on a solid post-Labor Day rally, however, the hotter-than-expected CPI reading sent stocks reeling. After gapping down below its 50-day moving average, the S&P 500 finished the day with a decline of over 4%. Additionally, another technical development of note as a result of yesterday’s move was that the breakout above the past few weeks’ downtrend line appears to have only been a pump fake.
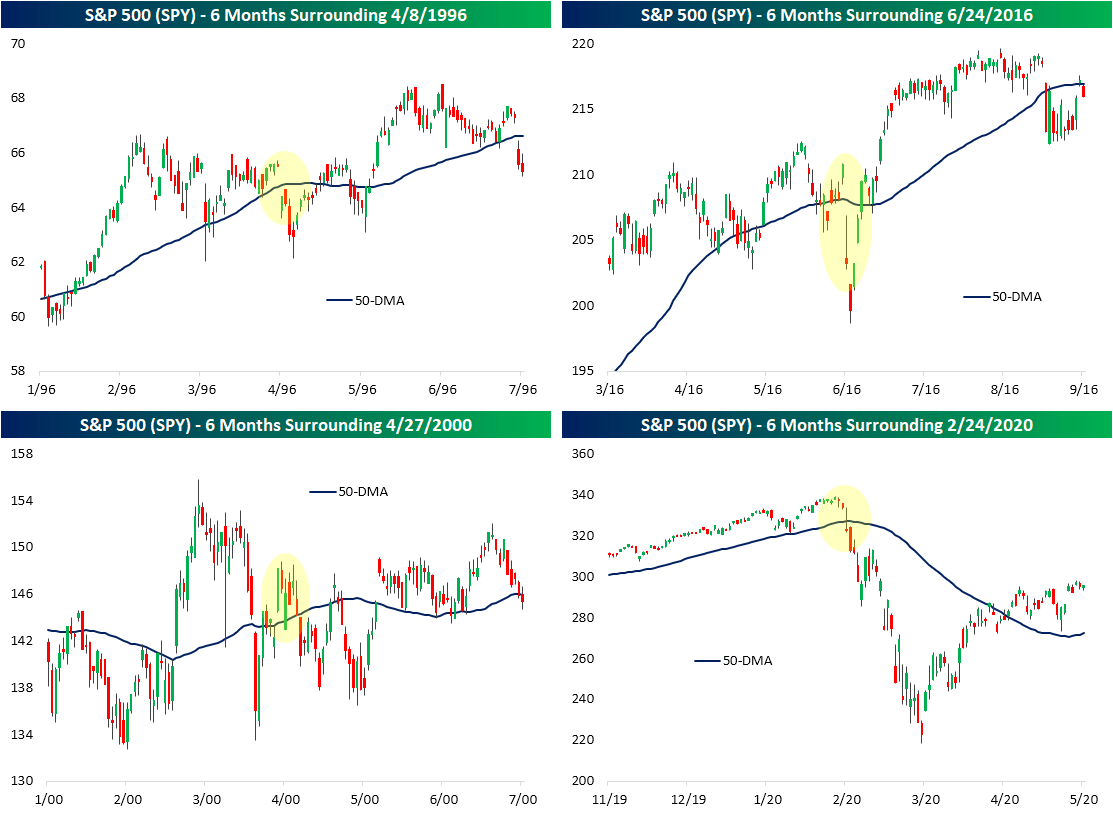
While moves above or below the 50-DMA are a fairly common technical development, those similar to Tuesday are a bit rarer than might be expected at first glance. Prior to yesterday, the S&P 500 ETF had only opened below its 50-DMA thanks to a gap down of at least 2% four other times since the ETF began trading in 1993: April 8, 1996, April 27, 2000, June 24, 2016, and February 24, 2020. Looking across each of these instances, the 2020 occurrence was the only one that was followed by a prolonged period with the SPY staying below its 50-day. By comparison, the 1996 and 2000 instances saw the S&P continue to fluctuate around its 50-day in the months ahead. In fact, the April 2000 occurrence actually saw the S&P 500 rise back above its 50-day by the end of that same day. Meanwhile, the 2016 instance saw SPY quickly regain its losses as it traded above its 50-DMA for much of the next few months.
Editor’s Note: The summary bullets for this article were chosen by Seeking Alpha editors.
Be the first to comment